1
THE IMPACT OF FREE CASH FLOW ON THE FIRM VALUE
Arief Shylvie Kumara Profita Dewi Ratnaningsih
International Financial Accounting Program (IFAP) Faculty of Economics
Universitas Atma Jaya Yogyakarta Jalan Babarsari 43-44, Yogyakarta
ABSTRACT
This study aimed to investigate the impact of free cash flow on the firm value. Manufacturing companies that listed in Indonesia Stock Exchange is chosen to be the sample of research and 303 companies during 2012-2014 were selected as the sample.
Firm value is the investor’s perception towards the degree of success of a company. According to several previous researches, free cash flow becomes one of the factors that affect firm value. Some research said that the more free cash flow generated by the company, the higher the firm value. The other research found distinct result where the higher free cash flow owned by the company, the lower the firm value. thus, there is still a conflicting result regarding the effect of free cash flow towards firm value.
Free cash flow is calculated using the formula from Wang (2010) which later modified to adjust with certain regulation in Indonesia. Firm value is calculated by price to book value ratio. The result of study comes up with a conclusion that free cash flow has no positive impact on firm value. Thus, whether or not the company possesses free cash flow, it will not affect firm value as a whole. It is essential to have skillful manager that has the capability to manage free cash flow in order to utilize the cash for value-improving activity and not wasting it for unprofitable investment.
Keywords: free cash flow, firm value, price to book value
I.Introduction 1.1. Background
2
The owner of the company required skilled manager that believed have an ability to maximize firm value (Simamora, 2013). The role of manager is very critical in order to effectively and efficiently run the business operation which later can affect the firm performance. Excellent firm performance will lead to better perception from the investor over the well-being of the company which later can increase firm value. Maximizing firm value has a meaningful contribution for a company because by maximizing firm value it also maximizes the prosperity of shareholders which is the main purpose of the company.
Firm value is investor perception towards the company’s degree of success. For public companies, it commonly linked to the share price of the company because firm value is reflected on their share price. In addition, market price of shares also reflects investor valuation over total equity that the company had. For companies that have been go public, maximizing firm market value is equal to maximizing market price of shares. Therefore, if the market price of shares increases, then firm market value will increase as well.
There are several factors that affect firm value. This research emphasize on examining the impact of free cash flow on firm value. Mills et al. (2002:38) defined free cash flow as the cash that available after meeting all current commitments, which is required payment continue operations. As an addition to the accounting concept, Wang (2010) stated that free cash flow is idle cash in which the utilization is depend on management discretion.
Free cash flow portrays the level of company’s financial flexibility since it is the source of internal fund. Companies with excess free cash flow has better performance compare to another company since those companies has available sufficient capital to take an advantage which another company cannot take. Furthermore, a company which has high free cash flow has more durability of survival in terrible situation compared to companies which has low free cash flow. This is because the company has sufficient capital that available for supporting stable operational activity and also determining succeed in long-term period.
1.2. Research problem
The research problem for this study can be formulated as follows: Does free cash flow have an impact on the firm value?
1.3. Objectives of Research
The objective of this research is to obtain empirical evidence about the impact of free cash flow on the firm value.
1.4. Contribution of Research
3
research may increase insight and knowledge for the readers in general. For practitioners, this research will add more knowledge related to how the amount of free cash flow has an impact on firm value and become a reference regarding to decision making before investing on certain companies.
II. Theoretical Background and Hypothesis Development 2.1. Free Cash Flow
Regarding to Mills et al. (2002:38), free cash flow is the cash that available after meeting all current commitments, which is required payments continue operations. Those payments are including dividends, current debt repayment and regular reinvestment to maintain current operating activities. Free cash flow becomes a basis for measuring a company’s ability to meet continuing capital requirements. Jensen (1986) stated that free cash flow is cash flow left after the firm has invested in all available positive NPV projects.
Ross et al. (2010) stated that free cash flow refers to cash that the firm is free to distribute to creditors and shareholders because it is not needed for working capital or fixed asset investment. Wild (2009), defining FCF as cash flow available to shareholders after operating asset reinvestments and debt payments. In line with Wang (2010), Lehn and Poulsen (1989), and Lang (1991), free cash flow is defined as operating income before depreciation expense, less corporate income tax, interest expenses, and cash dividend. The benefit of this definition is that it indicates how much the actual free cash flows were available for management exercise.
Company which has excess amount of free cash flow may have better performance compared to another company because they can achieve an advantage over various opportunities which may not be achieved by the other company. Company with huge amount of free cash flow is predicted to be more survive in depraved situation. Furthermore, company which has negative free cash flow indicates that internal source of fund is insufficient to fulfill the demand of company investment so that it necessary to extend external fund in form of debt or issuing additional shares (Rosdini 2011:2).
2.2. Agency Theory
4
result, shareholder paid a certain fee to monitor the performance of manager. This will incurred agency cost for the management to pay the monitoring activity.
To reduce the agency cost, the management voluntarily gives financial information to the shareholder. By regularly reporting the financial statement to the shareholder, management expects that the agency cost will be decreased.
2.3. Firm Value
Firm value is investor’s perception toward the firm’s degree of success which is commonly linked to firm share price (Sujoko and Soebiantoro, 2007). If the investor’s perception toward the probability of firm’s success in the future is high, thus market value of shares will increase. The main purpose of the company is to maximize the shareholders’ wealth. Shareholders’ wealth can be improved through enhancing firm value. Van Horne (1998) stated that firm value is represented by the market price of the company’s common stock. The purpose of a company establishment is to increase the firm value. Firm value also can be defined as the size of the success of company in improving the prosperity of shareholders. Maximizing firm value has truly important meaning for a firm. By maximizing firm value it means that maximizing the welfare of shareholder as well, which is the major purpose of the firm. Firm value is reflected on market value of share. Higher share price result on higher firm value. Higher firm value will build market trust not only on current firm performance but also on firm prospect in the future.
2.4. Hypothesis Development
Firm value is the perception of investors towards the degree of success of the company. It is important for the company to maintain the firm value in order to gain trust from shareholders to keep investing the fund on that company. Since the main purpose of the company is to maximize shareholders’ wealth, by maximizing firm value, the company also maximizes the shareholders’ wealth.
Firm value is reflected on the share price of the company. If the share price goes up, then the firm value will goes up too. If the perception of investors towards the company’s prospect in the future is promising, then there will be an increasing demand of shares. Investors’ presume that this company will give them high return in the future. If the demand increases, there will be more and more investors are attracted to invest on that company. As the demand of shares is increase, the share price will goes up.
5
consider exercising more capital spending if there are available new investment opportunities to increase firm value. Vogt (1997) argue that firms whose announced capital spending decision was responded by positive stock price on capital market. This implies that firms want to build shareholders’ trust and prove that management could manage the fund and sustain the business operation to improve firm value which later on will increase shareholders’ wealth.
A company that has free cash flow usually uses it for expanding the business. If the expansion is successful, then the company will collect more revenue. The increasing amount of revenue compared by more the industry average over a sustain period will increase the firm growth. As the company still in the process of expansion, the probability of growth is promising. The investors see the opportunity of firm growth as an attractive investment. They are attracted to invest because growing company has the probability of increasing share price in the future.
Since there are more investors attracted to invest on the company, the demand of their share is increase. When the demand of share is increase, the price goes up. When the price goes up, the firm value will increase as well. It has mention earlier that high firm value is a desire for the entire shareholder. This is because high firm value identic with high shareholders welfare. Shareholders’ welfare is related to their wealth. The wealthiness of shareholders is presented on the market value or market price of shares.
Several previous researches that examine the influence of free cash flow on firm value found a distinct result. Some of them found that free cash flow has positive impact on firm value. But, the other research found that free cash bring negative impact on firm value. Since the majority of research found that free cash flow has positive impact towards firm value, thus this research predict the impact of free cash flow on firm value for Indonesian companies that it will end up with the same result
Thus, from the explanation above the formulation of hypothesis is: H1: There is positive impact of free cash flow towards the firm value.
III. Definition and Measurement of Research Variables 3.1. Population and Sample
The statistical population of this research includes the entire manufacturing companies that listed in Indonesia Stock Exchange (IDX) since year 2012-2014. Manufacturing company is chosen to be the sample of research because this type of company is pretty sensitive to react over every event that happen in the capital market Gantyowati (1998) in Susilawati (2010). Totally 303 manufacturing companies are included as a sample of this research.
The sample of this research is taken by using purposive sampling method with some specific criteria The following sample criteria are set below:
6 2. The company has positive equity.
3. Issued financial reports in Indonesian currency (Rupiah). 3.2. Type and Data Collection Method
Type of data on this research is classified as secondary data source. 3.3. Dependent Variables
The dependent variable of this research is firm value. Firm value is investor’s perception toward the firm’s degree of success which is commonly linked to firm share price (Sujoko and Soebiantoro, 2007).
Firm value here is measured using Price to Book Value ratio (PBV). PBV shows how many times investors appreciate firm shares based on the book value per shares. The ratio denotes how much equity investors are paying for each cash in net assets. In short, PBV is a market ratio that used to measure the performance of market value towards book value.
Below is the formula for Price to Book Value ratio.
⁄ � = � ℎ
The value of stock price is taken at the publication date of financial report. Meanwhile, the book value per share is taken when the outstanding shares is at December 31. Book value is measured using this formula:
ℎ = � � ℎ�
3.4. Independent Variables
The independent variable of this research is free cash flow. Based on Mills et al. (2002:38), free cash flow is the cash that available after meeting all current commitments, that is required payment to continue business operations. In short, free cash flow is simply idle cash, which is the remaining cash owned by the company after payment of required expense. Wang (2010) use standardized formula of free cash flows which expressed below:
� = �− �− � �− ℎ � � �
7
OCF represents operating cash flows, Tax is corporate income tax expense, IExp is interest expense, CDiv is common stock dividends, PDiv is preferred stock dividends and Sales refers to net sales.
3.5. Control Variables 3.5.1. Firm Size
The size of the firm depicts how big is the firm which is appeared as total assets, total net sales and the average amount of assets the company had. Related to the firm size, (Pouragajhan et al., 2013; Wang, 2010; Mansourlakoraj, 2015) suggest that the large companies have more ability in obtaining profits from the resources which shareholders placed at the disposal of company. To determine the size of the firm here, the natural logarithm of net sales was chosen. The formula to calculate firm size was shown below.
� � = ln �
3.5.2. Financial Leverage
To control how financial leverage could influence firm value, the scale used to determine the leverage is debt ratio. Debt ratio is used to reflect the capital structure variable on a company. This ratio is used under the consideration that the tendency of debt utilization generally is based on how much assets that can be used as warrant (collateralizable assets). This ratio shows how much debt that will be exercised in order to fund the assets that used by the company to run the operational activity.
Debt ratio formula was shown below.
� = �
�
Where DA denotes debt ratio, Debt is total debt, and Asset is total asset. 3.6. Data Analysis Technique
8 IV.Data Analysis and Discussion 4.1. Descriptive Statistics
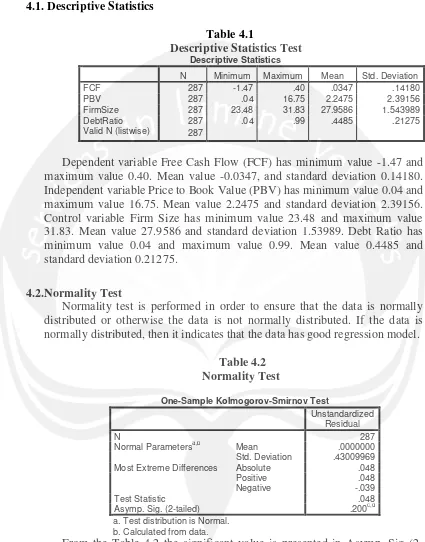
Table 4.1
Descriptive Statistics Test
Descriptive Statistics
N Minimum Maximum Mean Std. Deviation
FCF 287 -1.47 .40 .0347 .14180
PBV 287 .04 16.75 2.2475 2.39156
FirmSize 287 23.48 31.83 27.9586 1.543989
DebtRatio 287 .04 .99 .4485 .21275
Valid N (listwise) 287
Dependent variable Free Cash Flow (FCF) has minimum value -1.47 and maximum value 0.40. Mean value -0.0347, and standard deviation 0.14180. Independent variable Price to Book Value (PBV) has minimum value 0.04 and maximum value 16.75. Mean value 2.2475 and standard deviation 2.39156. Control variable Firm Size has minimum value 23.48 and maximum value 31.83. Mean value 27.9586 and standard deviation 1.53989. Debt Ratio has minimum value 0.04 and maximum value 0.99. Mean value 0.4485 and standard deviation 0.21275.
4.2.Normality Test
Normality test is performed in order to ensure that the data is normally distributed or otherwise the data is not normally distributed. If the data is normally distributed, then it indicates that the data has good regression model.
Table 4.2 Normality Test
One-Sample Kolmogorov-Smirnov Test
Unstandardized Residual
N 287
Normal Parametersa,b Mean .0000000
Std. Deviation .43009969
Most Extreme Differences Absolute .048
Positive .048
Negative -.039
Test Statistic .048
Asymp. Sig. (2-tailed) .200c,d
a. Test distribution is Normal. b. Calculated from data.
9 4.3. Multicollinearity Test
This test aimed to prove that there are no correlations among independent variables in the regression model (no multicollinearity). It is a good signal if regression model doesn’t have multicollinearity problem.
Table 4.3
Multicollinearity Test
Coefficientsa
Model
Unstandardized Coefficients
Standardized Coefficients
t Sig.
Collinearity Statistics
B
Std.
Error Beta Tolerance VIF
1 (Constant) -2.344 .472 -4.960 .000
FCF -.133 .185 -.042 -.717 .474 .946 1.057
FirmSize .090 .017 .309 5.262 .000 .933 1.071
DebtRatio -.095 .123 -.045 -.733 .440 .949 1.054
a. Dependent Variable: log_PBV
Table 4.3 shows that the value of Tolerance (TOL) of all independent variables is less than 1, which suggests that there is no correlation or multicollinearity between independent variables. The value of Variance Inflation Factor (VIF) of the entire independent variables also less than 10, which indicates there is no multicollinearity.
4.4. Heteroskedasticity Test
The purpose of this test is to test whether or not the variance of residual of one observation to another is identical. A good regression model is the one that possess homoscedasticity which means that the variance of residual is identical.
Table 4.4
10
From the picture above, the points do not construct any structured formation neither a specific pattern. Therefore, it indicates that the regression model has no heteroskedasticity problem or in other words it is homoscedastic.
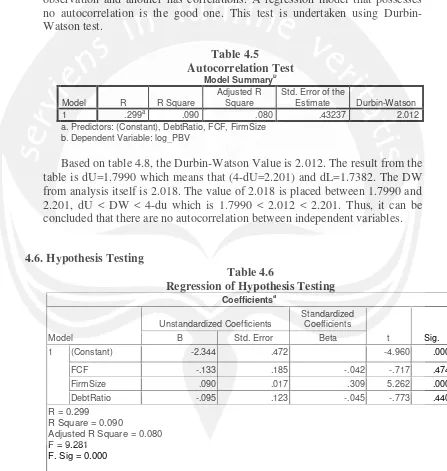
4.5. Autocorrelation Test
The aim of this test is to examine whether or not the residual of one observation and another has correlations. A regression model that possesses no autocorrelation is the good one. This test is undertaken using Durbin-Watson test.
Table 4.5
Autocorrelation Test
Model Summaryb
Model R R Square
Adjusted R Square
Std. Error of the
Estimate Durbin-Watson
1 .299a .090 .080 .43237 2.012
a. Predictors: (Constant), DebtRatio, FCF, FirmSize b. Dependent Variable: log_PBV
Based on table 4.8, the Durbin-Watson Value is 2.012. The result from the table is dU=1.7990 which means that (4-dU=2.201) and dL=1.7382. The DW from analysis itself is 2.018. The value of 2.018 is placed between 1.7990 and 2.201, dU < DW < 4-du which is 1.7990 < 2.012 < 2.201. Thus, it can be concluded that there are no autocorrelation between independent variables.
4.6. Hypothesis Testing
Table 4.6
Regression of Hypothesis Testing
Coefficientsa
Model
Unstandardized Coefficients
Standardized Coefficients
t Sig.
B Std. Error Beta
1 (Constant) -2.344 .472 -4.960 .000
FCF -.133 .185 -.042 -.717 .474
FirmSize .090 .017 .309 5.262 .000
DebtRatio -.095 .123 -.045 -.773 .440
R = 0.299 R Square = 0.090
Adjusted R Square = 0.080 F = 9.281
11
Table 4.9 displays that the significant value of FCF is 0.474 > 0.05 which means that FCF has insignificant impact towards Firm Value. It suggests that the company which possesses free cash flow will not have any effect on firm value.
The value of adjusted R square is 0.080, which shows that variable of FCF, Firm Size and Debt Ratio has the ability to explain the value of variance over variable Firm Value by 8.0%. The rest of 92.0% is influenced by the other variable other than variable that used in this research. The significant value of F-statistic is 0.000 and the value of F-statistic is 9.281 which imply that FCF, Firm Size and Debt Ratio are simultaneously having an impact on Firm Value.
4.7. Discussion
From the result of hypothesis testing above, it shows that free cash flow does not have positive impact towards firm value. The more free cash flow produced by the company, it will have no effect on firm value. Thus, the H1
that states free cash flow has positive impact on firm value is rejected.
This result is along with the research of Jensen (1986) which stated that too much free cash flow is linked to the waste of corporate resource, and inefficient resource allocation which lead to agency cost as a burden of stockholder’s wealth. It also suggests that management does not have capability to manage cash on hand so the resource (free cash flow) was invested on unprofitable investment which later can be lead to the downfall of firm value. The agency cost that caused by management will add more problem for shareholders and as a result caused more loss for them. Management might abuse free cash flow at their authority when there is less profitable investment that available for the firm.
V. Conclusion and Suggestion
This research examines the impact of free cash flow towards firm value by selecting the sample of 287 manufacturing companies that listed in Indonesia Stock Exchange during 2012-2014. It comes up with a conclusion that free cash does not have positive impact on firm value. This is suggests that if the company possess or does not possess free cash flow, it will not provide any impact on firm value.
It is important to choose skillful and capable manager that know how to manage free cash flow while maintaining firm value. Firm value is necessary to be maintained and improved because it is related to sustainability of the company. Since the appearance of free cash flow brings no positive impact towards firm value, then it is essential to keep the amount free cash flow as steady as possible. It is vital for management to prove that management has noble intention to gain trust from shareholders and increase shareholders wealth by maintaining free cash flow and improving firm value.
12
research may use another formula to calculate firm value in order to provide wide range of variety in measuring firm value.
References
Jensen, Michael., (1986), “Agency Cost of Free Cash Flow, Corporate Finance and Takeovers”, American Economic Review (76), pp. 323-339
K. Lehn and A. Poulsen, “Free Cash Flow and Stock-holder Gains in Going Private Transactions,” Journal of Finance, Vol. 44, No. 3, pp. 771-787. L. H. P. Lang., R. M. Stulz., R. A. Walking., (1991), “A Test of Free Cash Flow
Hypothesis: The Case of Bidder Returns”, Journal of Financial Economics, 29 (2), pp. 315-335
Mansourlakoraj, Roya., Sahar Sepasi., (2015), “Free Cash Flow, Capital Structure and the Value of Listed Companies in Tehran Stock Exchange”, International Journal of Management, Accounting and Economics (2), pp. 144-148
Mills, John., Lynn Bible., Richard Mason., (2002), “Defining Free Cash Flow: Certified Public Accountant”, The CPA Journal, 72 (1), pp. 36-41
Pouraghajan, Abbas Ali., Naser Ali Yadollahzadeh Tabari., Elham Mansourinia., Milad Emamgholipour., (2013), “The Effect of Free Cash Flows and Agency Costs on Performance of Listed Companies in Tehran Stock Exchange”, World of Sciences Journal, (1), pp. 1-10
Rosdini, Dini., (2009), “Pengaruh Free Cash Flow Terhadap Dividend Payout Ratio”, Working Paper in Accounting and Finance, Faculty of Economics – Padjadjaran University.
Ross, Stephen A., Randolph P. Westerfield., Jeffrey Jaffe, Corporate Finance, 9th Edition, McGraw-Hill, Singapore.
Salvatore, Kennedy., (2005), Ekonomi, Penerbit Gramedia Jakarta
Simamora, Alex Johanes., (2013), “Pengaruh Kecakapan Manajerial Terhadap Nilai Perusahaan Dengan Kepemilikan Manajerial Sebagai Variabel Pemoderasi”, Tesis Magister Akuntansi, Universitas Gadjah Mada.
Sujoko & Soebiantoro, U. (2007), “Pengaruh Struktur Kepemilikan Saham, Leverage, Faktor Intern dan Faktor Ekstern terhadap Nilai Perusahaan”, Jurnal Manajemen dan Kewirausahaan, 9 (1), hal. 41-48
Susilawati, R. Anastasia Endang., (2010), “Analisis Free cash Flow Dan Kepemilikan Manajerial Terhadap Kebijakan Hutang Pada Perusahaan Publik Di Indonesia”, Jurnal Ekonomi MODERNISASI, 5 (2), hal. 109-129 Vogt, Stephen C., (1997), “Cash Flows and Capital Spending: Evidence from
Capital Expenditure Announcement”, Financial Management (Summer), pp. 44-57
Wang, George Yungchih., (2010), “The Impacts of Free Cash Flows and Agency Costs on Firm Performance”, J. Service Science & Management, 3, pp. 408-418