DUCTILITY OF HOLLOW RC SHORT COLUMNS
IN COMPRESSION REGION
Achfas Zacoeb*
ABSTRACT
Five reinforced concrete short rectangular columns with hollow made from PVC pipe that placed in the center of cross section were tested under eccentrically axial loading in compression region with load eccentricity of 60mm (e < eb). The hollow ratio was taken from 3.63% up to 20.28%, and concrete strength used was 34.52MPa. The columns had
four longitudinal steel reinforcements of 12mm diameter were symmetrically placed in both sides of the square column section with average yield strength of 323.06MPa, and average modulus of elasticity of 257411.49MPa. The objective of this research is to study the ductility of hollow RC short columns with square cross section of 150mm x 150mm. The results show that generally all columns give significant difference in ductility escalation. The maximum ductility escalation was occurred at column with maximum hollow ratio (20.28%), that is 16.38%, compared relatively to the solid column. It could be stated that PVC pipe installation in column will improve the ductility.
Keywords: ductility, hollow ratio, RC short column, square cross section, compression region
INTRODUCTION
In high-rise buildings, it is often to provide a different diameter of pipe in a column for plumbing system. Hollow due to pipe installation has an effect on the strength degradation and stiffness of structural elements such as column. Generally, column failure in compression will affect to another structure component that connected with. For this reason, strength reduction factor for column is taken to be less than that of beam in order to give more spare strength.
Previous study related to the present study had been observing the flexural strength and ductility of circular hollow reinforced concrete columns without confinement on inside face (Zahn et al., 1990). Suprabowo (1996) had developed an analysis for hollow RC column with square cross section based on circular column analysis method. The hollow effect toward ultimate strength of RC column with hollow ratio less than 10% had been investigated (Supriyadi, 1997).
The current code such as the ACI Building Code in the section of 6.3.4, it is stated that conduits and pipes, with their fitting, embedded within a column shall no displace more than 4 percent of the area of cross section in which strength is calculated or which is required for fire protection. The Indonesia National Standard (SNI 1991), it is stated same as the ACI Building Code that hollow ratio is less than 4 percent.
This paper is aimed to study the ductility of hollow RC short columns subjected to eccentrically axial compressive loading in compression region. An offered concept was optimizing the hollow ratio to take a portion of an effective column area and give the significant ductility escalation.
RESEARCH SIGNIFICANCE
Building codes implicitly guarantee an acceptable factor of safety on member design for conventional strength concretes. For the design of hollow RC columns, it is essential that this accepted factor of safety be maintained by modifying design capacities. This research aims to study the ductility of hollow RC short columns with square cross section subjected to eccentrically axial loading in compression region with variation of hollow ratio. The diameter of pipe were taken from 32.25mm up to 76.25mm and made from PVC that placed in the center of column cross section. This research provides the information about the escalation of ductility of the column subjected to eccentrically axial loading in compression region.
DESCRIPTION OF EXPERIMENTAL
PROGRAM Test Specimens
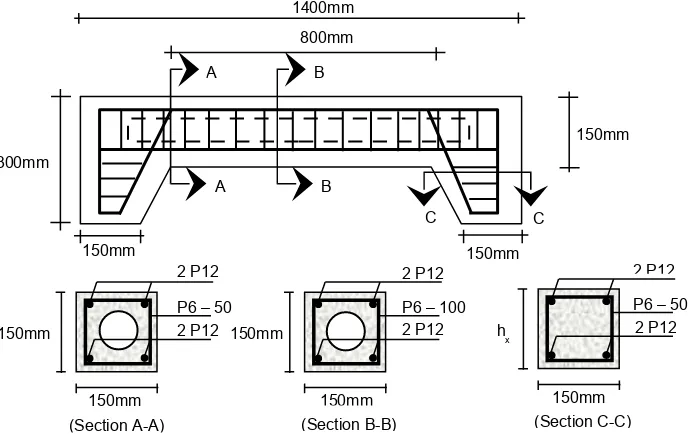
A total of five tie reinforced concrete columns
with square cross section, having dimensions of
150mm high, 150mm width and 800mm length
were tested under eccentric axial
* Achfas Zacoeb, staf pengajar jurusan Teknik Sipil -Universitas Brawijaya, Malang.
Jl. Mayjen. Haryono 167, Malang 65145. Faks : (0341) 574063. E-mail: [email protected]
compressive loading with eccentricity of 100mm. Four of them were hollow columns with hollow ratio were (C2) 3.63%, (C3) 7.95%, (C4) 12.50%, and (C5) 20,28%, while the rest was solid column (C1) representing control specimen. Four longitudinal steel reinforcements of 12mm diameter were
symmetrically placed in both sides of the square column section. Tie reinforcements of 6mm diameter with 100mm spacing were used along the column. The dimension of tests specimen were shown in Figure 1.
Figure 1. Geometric details and configuration of test columns
Figure 2. Loading set up
300mm
150mm 150mm
A
C B
B A
1400mm
800mm
C
150mm
P6 – 100
150mm
2 P12
P6 – 50 2 P12
150mm 150mm
2 P12
2 P12
(Section B-B)
150mm h
x
2 P12
2 P12 P6 – 50
(Section C-C) (Section A-A)
150mm
Strainmeter TC-31K Hydraulic pump A A
Hidraulick Jack Load cell
Massive steel pipe Strong floor
Pinned Supporting
Specimen
1 2 3
(Section A-A)
Rigid frame Massive steel pipe
Dial gauge
Material Properties
The specimens were made using concrete with mix proportion of 1:1.65:2.01 and water-cement ratio of 0.5. The concrete used was a mixture of PPC (type A), crushed sand, and aggregate with maximum size of 20mm that gave an average compressive after 28 days with static load which applied using a hydraulic jack and the load intensity was monitored from load cell which equipped by transducer indicator. Three dial gauges were used for displacement monitoring. Each test specimens were placed on the pinned supporting structure.
Load and displacement reading are conducted in stage with loading step, started from zero up to maximum loading. Variation of loading step is from 4kN up to 10kN. Static load was applied until the test specimens fail. Load and displacement, that occurred during the test were observed and recorded. The loading set up was illustrated in Figure 2.
TEST RESULTS AND DISCUSSION
Strength of Column
Figure 3 shows the relationship between load and mid-span deflection for solid column (C1E1) and hollow columns (C2E1, C3E1, C4E1, and C5E1) with load eccentricity of 60mm. For compression region (e < eb), it is shown that the strength of
column decrease as hollow ratio increase. The strength degradation is followed by a larger displacement that occurred at the mid of column.
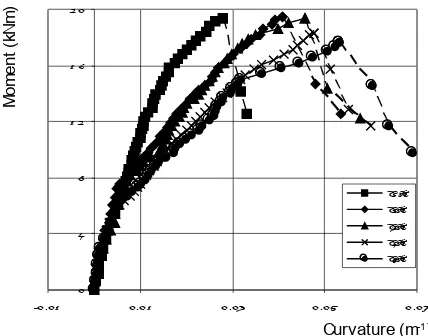
Flexural Capacity of Column
flexural capacities of column decrease as hollow ratio increase. The flexural capacity degradation is
Figure 3. Load versus mid-span deflection
0
-0.01 0.01 0.03 0.05 0.07
Curvature (m-1)
Figure 4. Moment versus mid-span curvature
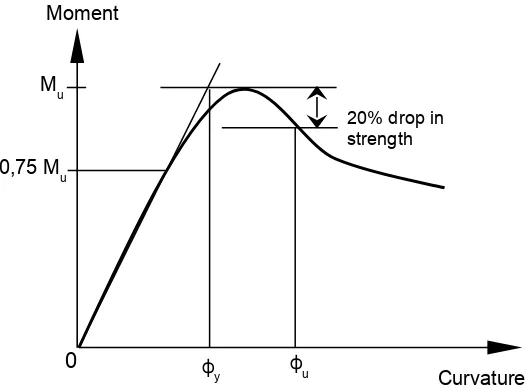
Ductility of Column
Park and Paulay (1975) have defined that ductility of column could be observed by using moment-curvature diagram that known as moment-curvature ductility factor, that is ratio between ultimate curvature (ϕu)
and yield curvature (ϕy). El-Tawil and Deierlein
(1999) have defined that ultimate curvature (ϕu)
could be obtained when moment was 0.80% of the maximum moment (Mmax) in the slope part of
diagram.
Figure 5. Definition of curvature ductility ratio (El-Tawil & Deierlein, 1999)
Table 1. Ductility of column
Test Specimen
Eccentricity (mm)
Diameter of Pipe (mm)
Yield Curvature,
ϕy (m-1)
Ultimate Curvature,
ϕu (m-1)
Ductility,
µ
C1 60 0 0,021 0,031 1,48
C2 60 3,63 0,031 0,049 1,58
C3 60 7,95 0,031 0,051 1,65
C4 60 12,50 0,033 0,056 1,70
C5 60 20,28 0,035 0,062 1,77
While for yield curvature (ϕy) could be obtained by
making a straight line from zero point and trough point of contact where diagram have reached 0,75Mmax and horizontal line from Mmax, and from this
point could be made a vertical line beneath curvature axis to get a yield curvature (see Figure 5).
The ductility shown in Table 1 was based on the ultimate curvature (ϕu) and the yield curvature (ϕ
y). The ductility can be calculated by dividing ϕu with
ϕy.
For compression region (e < eb) with load
eccentricity of 60mm, it is shown that ductility of column increase as hollow ratio increase. From Table 1, it could be observed that maximum escalation was occurred at column with maximum hollow ratio (C5E1), that is 16.38%, compared relatively to the solid column (C1E1). It could be stated that PVC pipe installation in column will improve the ductility.
Mode of Failure
In general, cracks are started from critical region where subjected to maximum flexural moment and weakness dimension. The cracks occurred are flexural crack that indicated by vertical crack direction to column height and always found on tension side. In average, the first crack occurred when applied load is 30% from maximum load with crack width observed are between 0.01 to 0.02mm.
Cracking patterns of the hollow and solid columns, in general, follow similar patterns. The modes of failure was started by hairlines cracks appeared at tension side followed by the widening and elongating of several cracks as the load increased, and finally concrete spalled off from the concrete surface at compression side.
All columns with load eccentricity of 60mm were exhibited modes of failure that were similar to that of compression failure. Spalling that occurred is getting bigger as hollow ratio increase.
ϕu ϕy
M u
0,75 Mu
0
Moment
Curvature 20% drop in
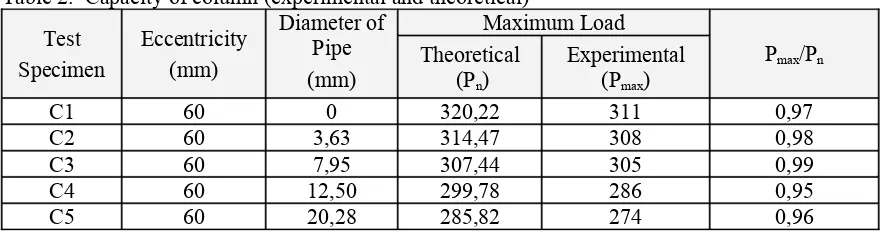
Comparison of Test Results with Theoretical Predictions
Table 2 summarizes the experimental and analytical maximum loads for all five-columns being tested. It is evident from Table 2 that all five-columns do not exceed the theoretical predictions of the maximum load, but this value is still larger than the
requirements for column with tie reinforcement as 0.80Pn. It could be stated that columns are comply
with the requirements. The differences of maximum load between theoretical and experimental were not significant. The average difference is 2.89% with load eccentricity of 60mm.
Table 2. Capacity of column (experimental and theoretical)
Test
C2 60 3,63 314,47 308 0,98
C3 60 7,95 307,44 305 0,99
C4 60 12,50 299,78 286 0,95
C5 60 20,28 285,82 274 0,96
CONCLUSION AND RECOMMENDATION Conclusion
1.
With load eccentricity of 60mm, the maximum load capacity of the hollow column with hollow ratio of 20.28% decrease 11.90%, compared relatively to the solid column.2.
Ductility of the hollow columns with hollow ratio of 20.28% had maximum increase 16.38 %, compared relatively to the solid column.3.
The PVC pipe installation can make the columns more ductile as diameter of pipe increase.4.
All columns with load eccentricity of 60mm were exhibited modes of failure that were similar to that of compression failure.5.
Cracking patterns of the hollow and solid columns, in general, follows similar patterns. The modes of failure was started by hairlines cracks appeared at tension side followed by the widening and elongating of several cracks as the load increase, and finally concrete spalled off from the concrete surface at compression side.6.
The differences of maximum load between theoretical and experimental were not significant. The average difference is 2.89% with load eccentricity of 60mm.Recommendation
1.
More tests need to be conducted to verify the accuracy of the test results.2.
It is recommended to examine the hollow RC column in the different type of cross section and the slender column.3.
Other environmental exposure test under dynamic loading also recommended examining the hollow RC column.4.
Field monitoring project are also recommended to further study the hollow effect under actual field conditions.ACKNOWLEDGEMENTS
The research work for this study was conducted by the author during Master research at Gadjah Mada University. Thanks to Dr.-Ing. Ir. Andreas Triwiyono and Prof. Ir. Bambang Suhendro, M.Sc., Ph.D. for their supervision and benefit advice, also thanks to the Directorate General of Higher Education of Indonesia for financial support through a BPPS (the Post Graduate Program Scholarship).
REFERENCES 1977. Peraturan Beton Bertulang Indonesia
1971 NI-2. Bandung.
Departemen Pekerjaan Umum, 1991. SK SNI T-15-1991-03, Tata Cara Perhitungan Struktur
Beton untuk Bangunan Gedung. Bandung.
Dipohusodo, I., 1996. Struktur Beton Bertulang : Berdasarkan SK SNI T-15-1991-03 Departemen Pekerjaan Umum RI. Gramedia Pustaka Utama. Jakarta.
El Tawil, S., & Deierlein, G.G., 1999. Strength and Ductility of Concrete Encased Composite Columns. Journal of Structural Engineering,
Vol. 125 no. 9, pp. 1009-1019.
Gere, J.M., & Timoshenko, S.P., 1984. Mechanics of Material, 2nd Edition. Wadsworth, Inc.,
Belmont, California.
Nawy, E.G., 1998. Beton Bertulang : Suatu
Pendekatan Dasar. Terjemahan oleh
Bambang Suryotomo. Refika Aditama, Bandung.
Park, R., & Paulay, T., 1975. Reinforced Concrete Structures. John Wiley & Sons. Inc., New York.
Poston, R.W., Breen, J.E., & Roesset, J.M., 1985. Analysis of Non Prismatic or Hollow Slender Concrete Bridge Piers. ACI Journal,
September-October, pp. 731-739.
Poston, R.W., Gilliam, T.E., Yamamoto, Y., & Breen, J.E., 1985. Hollow Concrete Bridge
Pier Behaviour. ACI Journal, November-December, pp. 779-787.
Suprabowo, S., 1996. Analisis Kapasitas Kolom
Beton Bertulang Berlubang. Skripsi, Jurusan
Teknik Sipil, Universitas Gadjah Mada, Yogyakarta.
Supriyadi, 1997. Pengaruh Lubang dan Rasio Tulangan pada Kuat Batas Kolom Beton Bertulang. S2 Tesis, Universitas Gadjah Mada, Yogyakarta.
Wang, C.K., & Salmon, C.G., 1993. Disain Beton
Bertulang, Jilid 1, Edisi Keempat.