The Comparison of Bathymetric Estimation from Three High
Resolution Satellite Imagery
Samsul Bachri
Institute Technology of Bandung (ITB)
Muhammad Banda Selamat
Bogor Agricultural University (IPB)
Vincentius P Siregar
Hasanuddin University (UNHAS)
Sam Wouthuyzen
LIPI
ABSTRACT
This study was using three high resolution satellite imagery to estimate bathymetric condition at shallow water coral reef environment around Pulau Panggang, Jakarta. The Worldview 2 supply 2 m spasial resolution with 8 spectral band, whereas Quickbird 2 produce 2.44 m spatial resolution in 4 spectral band and ALOS produce 10 m spasial resolution with also 4 spectral band. Red band of ALOS and Quickbird have high correlation with sand depth and the lowest are blue bands. Among this bands, Quickbird red band is the highest and its blue band is the lowest. Worldview visible bands may have low sand depth correlation because of noise from ripple wave during acquisition. This study shown that, Quickbird image is proven able to map water depth variation up to 8 metre at reef flat and lagoon area of Panggang island, Jakarta with RMSe is 1.1 metre. The result also shown an opportunity to implement this approach to bathymetric mapping of shallow water area at remote small islands.
Keywords :bathymetric estimation, high resolution imagery
1 Introduction
Water depth (bathymetry) is an important factor to solve various coastal studies such as wave and current modelling, erosion, shoreline stability, sedimen propagation, port construction, thermal dispersion and maintenance of navigation routes. Collecting bathymetric data at a remote small islands are an expensive, time consuming and sometimes extremely difficult to conduct. For various reasons like wide area coverage, data dependency on depth and repetition, satellite images can be used to determine shallow water depth on these sites. Sometimes ground truth at selected locations is still needed to validate the bathymetric model produced by satellite imagery.
Depth water images acquired by remote sensing satellites consist of reflectance from water column and also atmosphere. Considering the case of water bodies, there will be significant change in the reflectance due to various parameters including water depth, dissolved matter and sea bed characteristics. Assuming the other two parameters uniform, it is obvious that the intensity of reflected electromagnetic energy will vary inversely with water depth. However, water depth variations are not easily distinguished from bottom color differences. Surface reflection effects add another element of confusion to the interpretation of the images.
The recent satellite imaging development promising a great challenge on this bathymetric mapping. Considering a new spectral band (ranging around ultraviolet to blue wave spectral region - called “coastal” band) on worldview 2 it hoping that visible satellite imaging may be use as an alternative to bathymetric mapping works on low to middle accuracy levels.
The main goal of this study is to evaluate the ability of two high resolution satellite image (eg Worldview and Quickbird) to on water depth mapping. The evaluation will based on depth penetration of visible bands of each satellite.
2 Background Theories
Lyzenga (1978) studies on mapping water depth conclude that the ratio algorithms for water depth and bottom features mapping are relatively simple and give acceptable results in many situations. The ratio algorithm can be develop to shallow water radiance model that involves effects of scattering in the atmosphere, reflection at the water surface as well as the components originating in the water itself.
dark substrates such as sea-grasses may be misinterpreted as deep water, the technique is probably the most reliable for navigation purposes.
Bierwirth, et.al (1993) develop an algorithm to derived both substrate reflectance and water depth simultaneously. Their aim was to derive substrate reflectance factors in each band processed and, as a by-product, produce a continuous grey-scale depth image. At that stage of research, their assumed relatively clear water and only minor variations in the concentration of water column materials. The water attenuation coefficients were determined by regressing known bathymetric data against Landsat radiances. They assume that water column conditions were constant over the scene. The method was successfully tested in the Hamelin Pool area of Shark Bay, Western Australia. The errors are greatest for dark substrates which will resolve as deeper than true.
The studies on shallow water depth mapping were done using Quickbird images (Lyons et al. 2011), IKONOS (Stumpf et al. 2003; Lyzenga et al. 2006), SPOT (Melsheimer & Liew 2001; Lafon et al. 2002; Kao et al. 2009) and Landsat (Lyzenga 1981). The method used for bathymetric mapping may classified into two categories, empirical (Lyzenga 1978; Jupp 1988; Lafon et al. 2002; Gao 2009) and analytic / invertion (Dierssen et al. 2003; Su et al. 2008; Dekker et al. 2011). The common band use were blue and green band.
The fundamental principle behind using remote sensing to map bathymetry is that different wavelengths of light will penetrate water to varying degrees. When light passes through the water, it becomes attenuated by interaction with water column. The intensity of light, Id, remaining after passage length p
through water is formulated as:
= . eq.1
I0= intensity of the incident light and
k= attenuation coefficient, which varies with wavelength
if vertical pathway of light from surface to bottom and back is assumed then p may be substituted by the term of 2d. where d is water depth. Then equation 1, may linierize by natural logarithm:
= − eq.2
Red light has a higher attenuation coefficient than green or blue, therefore it does not penetrate further than a few centimeter. The depth of penetration is depent on water turbidity. Dissolved materials in water will affects the depth of penetration because they scatter and absorb light, and so increase attenuation.
According to Benny and Dawson (1983), there are three assumptions to implement their algorithm: i) light attenuation is an exponential function of depth (equation 1), ii) water quality (the attenuation coefficient, k) does not vary within an image, iii) the color (reflective properties or albedo) of the substrate is constant. Assumption (ii) may or may not be valid for any image but has to be made unless supplementary field data are collected at the time of image acquisition. Assumption (iii) is certainly not true for many areas and will cause dense sea grass beds to be interpreted as deep water. Corrections to the final bathymetry chart could be made if a habitat map exists.
Even Jupp’s method had same assumptions as Benny and Dawson’s, but actually he made quiet different step to map water depth from satellite images. Jupp’s method may implement by doing these steps : 1) the calculating depth of penetration (DOP) zones, 2) the interpolating depths within DOP zones, and 3) the calibrating depth within DOP zones.
Lyzenga’s method applies water column correction to compensate the effect of variable depth (bathymetry) from different substrate. a transformation using natural logarithms will linearise the effect of depth on bottom reflectance. Theoretically, each bottom type should be represented by a parallel line, the gradient of which is the ratio of the attenuation coefficients for each band ( / ). It may say, for one of bottom type (e.g. sand), all pixels must lie along the same regression line. Those pixels further up the line have greater reflectance and are found in shallower water. Those pixels nearest the y-intercept are found in deeper water.
The y-intercept can be used as an index of bottom type. Relative depth can be inferred by the position of a pixel along a line of gradient
/ . Depth varies along the line so that the shallowest (brightest) pixels have the highest values, the deepest (darkest) pixels the lowest. Once the gradient / is known, the axes of the bi-plot can be rotated through the angle θ, so that the new y-axis lies parallel to / . Positions of pixels along this new y-axis are indicative of depth.
Water depth calculated by an image is depth beneath a temporary water surface. This depth will depend on the height of the tide at the time of satellite overpass. Field depth data will also have been collected at different times of the day, at different points in the tidal cycle. Image and field depths must be unificated by reducing to depth datum. This tidal datum is normally calculated from the Lowest Astronomical Tide (LAT) level (the lowest point that the tide ever recedes to).
height for each depth recording, must therefore be calculated and subtracted from the measured depth to give the depth of water below datum. Thus it is essential to record the time when each calibration depth is measured so that it can be corrected to datum later.
3 Methodology
The data for this study were collecting at Panggang island and its vicinity. The island may reach by boating around half an hour heading to the north from Jakarta. The equipments used during survey (January, 2012) were:
- 1 unit GPS MAP Sounder (freq. 50 kHz and 200 kHz)
- 1 unit Automatic Data Logger + software
- 1 unit laptop core2 duo
- 1 unit boat with 5 HP outboard engines - 1 unit tide pole
- 1 unit steel chain with rope for transducer calibration
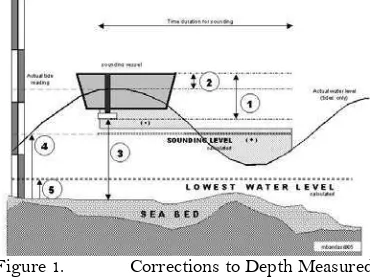
- 1 unit digital camera for documentation Due to sea wave characteristics, some corrections must be apply to water depth measured. These corrections are: 1) equipment default correction, this value obtained by transducer calibration, and 2) tide correction, which obtained by tidal observation coincident with sounding work. The relationship between depth measured, depth corrected and its corrected values is shown in Figure 1.
Figure 1. Corrections to Depth Measured Three different satellite images were use for this study. The images description are shown at Table 1 and 2. The visualization of natural composite image from three satellites are shown in Figure 2.
Table 1. Satellite images used in this study
Satellite Bands Spatial Resolution
Acquisition Worldview
2
8 2.07 m October 19, 2011 Quickbird 2 4 2.44 m September
28. 2008
ALOS 4 15 m September
AVNIR 2 15. 2008
Table 2. Sensor characteristics of Worldview, Quickbird and ALOS AVNIR 2 satellites
(modificated from Digital Globe, 2010 and JAEA, 2008)
Spectrum Wave length (nm)
Worldview 2 Quickbird 2 AVNIR 2
Coastal 400 - 450
Blue 450 - 510 430 - 545 420 – 500 Green 510 - 580 466 - 620 520 – 600 Yellow 585 - 625
Red
630
-690
590 -
710
610 –
690
Red
Edge
705
-745
Near IR
770
-895
715 -
918
760 –
890
Near IR
860
-1040
Creating Depth of Penetration (DOP)
Zones (Jupp, 1988)
Digital Number data require either dark pixel subtraction or some other form of atmospheric correction. All infrared bands removed and land areas masked out.
1) choose an area of deep water with properties we believe to be typical for the area
2) Calculate the maximum, minimum and mean deep water pixel for each band. Let the minimum in band i be Li deep min, the maximum
Li deep max and the mean Li deep mean
3) if a pixel value in band i, Li, is > Li deep max
then some light in band i is being reflected from the seabed to the sensor. The depth is therefore less than the maximum depth of penetration, denoted by zifor band i. If, for
the same pixel, Lj, is > Lj deep max , then the
depth of that pixel is between zi and zij.
4) a few error pixels will have higher values in some band, which should not happen in theory. They may be coded to zero and filtered out of the final depth image.
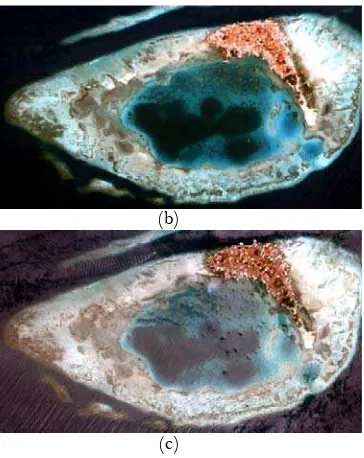
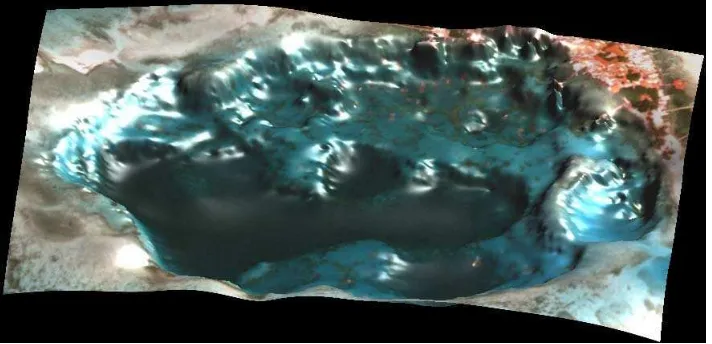
(b)
(c)
Figure 2. Natural composite images of study area: a) ALOS AVNIR, b) Quickbird 2
and c) Worldview 2
Interpolating DOP Zones
1) DOP images then may be used to make DOP zone masks for all bands. All pixels within DOP zone 1 coded to a value of 1 and all other pixels in the image to 0, and repeating with other DOP zones.
2) Multiply the original image by each DOP zone masks. Data in pixels outside the DOP zone will be recorded to 0.
3) Estimate Li max and Li min for each DOP zone i.
Xi min and Xi max can then be calculated since
Lideepmean is known. The Ai can then be
calculated from equation 3 and 4. = −
− eq. 3
= + eq. 4 4) Using equation 5 to assign depth for each
pixel in each DOP. This will produces separate interpolated DOP depth images. These are added together to produce a depth image for the area of interest.
= − eq. 5
Calibration of DOP zones
1) Depth data typically consist of echo sounder readings at a series of positions. Calculate which sites lie within each DOP and plot frequency distribution histograms of known depths in each DOP
2) Jupp indicates that the point of intersection between histograms is the best decision value for the depth separating each DOP zone.
3) new values of Zj, ki and Ai are calculated and equation 5 written to assign depths to each pixel in each DOP
Accuracy Assessment
Simple regression between depth pair of data could be implement to estimate how accurate this method in water depth mapping. The regression equation also will portray the level of confidence of the final bathymetric map for area of interest.
4 Result and Discussion
Geomorphic zonation at coral reef environment usually associated to depth profile. Hence it presentation is spatially easy to detect by moderate satellite resolution such Landsat, SPOT and ASTER. According to Mumby and Harborne (1999) geomorphic zone has clear boundary between them due to depth differences so it is easy to identified by using visible band combination from satellite images. Blanchon (2011) could recognize reef flat, reef lagoon, reef front and reef slope from high resolution Quickbird satellite image.
Figure 2. Geomorphic zonation of Panggang reef waters It is obvious that bottom substrate like
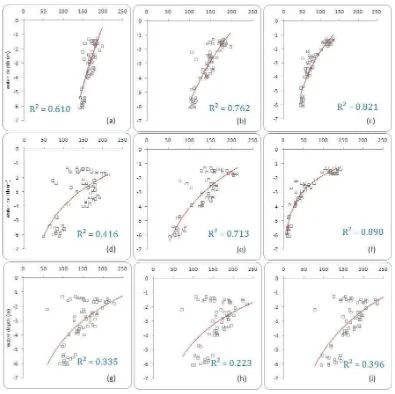
sand have good relationship with depth variation. Common substrates in reef environment are sand, seagrasses and coral reef. We evaluate sand relationship with waterdepth by extracting its correspondence digital value from ALOS, Quickbird and worldview images. Figure 3 shows us that, even Worldview has great spatial resolution compare to ALOS and Quickbird, but in this case it has very low coefficient determination hence not representative to bathymetric image processing.
Figure 3. Digital number comparison of sand depth from band 1, 2 and 3 of ALOS (a, b, c), Quickbird (d, e, f) and Worldview (g, h, i) respectively
We re-evaluate worldview image due its low sand depth correlation value and found that the image also record ripple wave during acquisition. So this noise may affected every digital number of visible bands we use and contribute to low value of sand depth correlation. Considering to sand depth correlation values, we decide to use Quickbird image to produce bathymetric image by implement Jupp’s algorithm. The Jupp’s algorithm paremeters are shown at Table 2. The DOP (depth penetration values) of band 2 is actually acting as boundary level for depth more than 2 metre, whereas DOP of band 3 was use for delineating depth area less than 2 metre. Ki and Ai coefficient are needed to solve depth estimation by using equation 5. The result of Jupp’s algorithm implementation is shown in Figure 5.
Table 2. Summary of Jupp Parameters for Quickbird image
Parameters band 2 3 DOP 2 42 - 53
DOP 3 8 - 131
Parameters band 2 3
Figure 5. Bathymetric image from Quickbird
Figure 6. Tracing bathymetric contour from Quickbird bathymetric image
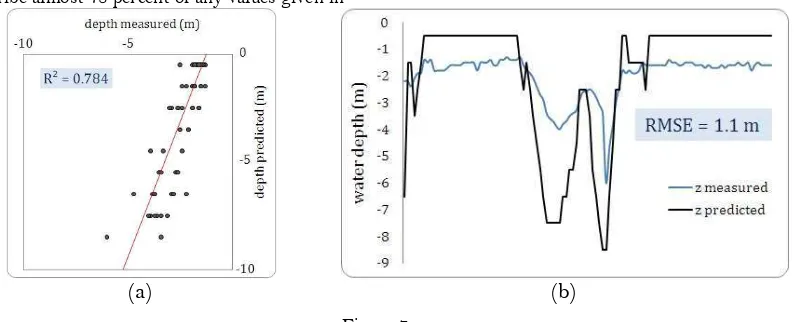
To measure the accuracy of this bathymetric map, some point was carried out on both field depth values and bathymetric image. The pair of depth values then plotted in to cartesian diagram to get a general formulation of the regression. The determination coefficient describes the reliability of the model, the bigger the value the more reliable is (Figure 7a).
In statistical view, this model is able to describe almost 78 percent of any values given in
data set. This means if we get a value say 2 meter from bathymetric image, then we should note that the real value maybe around 1 to 3 meters depth. The predicted water depth profile shown in Figure 7b, where it gives a more clear explanation about the accuracy of bathymetric image. The root mean square error (RMSe) for each pair of water depth (image and field) is around 1.1 metre for a maximum 9 metre depth.
(a) (b)
Figure 7. The final product from Jupp’s algorithm is not just bathymetric image as shown in Figure 5. By draping its raster image to bathymetric countour (Figure 6) then we get some kind of digital bathymetric terrain model (Figure 8). So then we may say that for the sake of simplicity,
Figure 8. Digital bathymetric terrain model of Panggang island
5 Conclusion
In clear shallow water coral reef areas (e.g remote small island), the optic sensor of satellite imagery promising an opportunities as a source of bathymetric mapping technology. This study shown that, Quickbird image is proven able to map water depth variation up to 9 metre at reef flat and lagoon area of Panggang island, Jakarta. Eventough the RMSe is 1.1 metre, but the potray of bathymetric terrain may give a valuable information for some application such as sea current modelling, predicting fish juvenil migration along seagrass and coral reef habitat.
REFERENCES
Benny, A.H and Dawson, G.J. 1983. Satellite Imagery as an aid to bathymetric charting in the Red Sea. The Cartographic Journal. 20 (1), 5-16. Bierwirth, P.N, T Lee and R V Burne. 1993. Shallow
Sea-Floor Reflectance and Water Depth Derived by Unmixing Multispectral lmagery. Photogrammetric Engineering & Remote Sensing, Vol.59, No.3, 331-338.
Blanchon P. 2011. Geomorphic zonation. Di dalam: David H, editor. Encyclopedia of Modern Coral Reefs. Springer Science.
Dekker AG et al. 2011. Intercomparison of shallow water bathymetry, hydro-optics, and benthos mapping techniques in Australian and Caribbean coastal environments. Limnol Oceanogr. 9: 396–425.
Dierssen HM, Zimmerman RC, Leathers RA, Downes TV, Davis CO. 2003. Ocean color remote sensing of seagrass and bathymetry in the Bahamas Banks by high-resolution airborne imagery. Limnol Oceanogr 48(1 part 2):444– 455.
Digital Globe, 2010. White Paper. The Benefits of the 8 Spectral Bands of WorldView-2. Digitalglobe JAEA, 2008. ALOS Data Users Handbook. Revision C. Earth Observation Research and Application Center
Gao J. 2009. Bathymetric mapping by means of remote sensing: methods, accuracy and limitations.
Progr. in Physic. Geogr. 33(1):103–116.Jupp, D.L.B. 1988. Background and Extentions to Depth of Penetration (DOP) mapping in shallow coastal waters. Proceedings of the Symposium on Remote Sensing of the Coastal Zone, Gold Coast, Queensland, September 1988, IV.2.1 – IV.2.19.
Kao HM, Ren H, Lee CS, Chang CP, Yen JY, Lin TH. 2009. Determination of shallow water depth using optical satellite images. Int. J. Remote Sensing 30(23): 6241–6260.
Lafon V, Froidefond JM, Lahet F, Castaing P. 2002. SPOT shallow water bathymetry of a moderately turbid tidal inlet based on field measurements. Remote Sen. of Environ. 81: 136– 148.
Lyons M, Phinn S, Roelfsema C. 2011. Integrating Quickbird multi-spectral satellite and field data: mapping bathymetry, seagrass cover, seagrass species and change in moreton bay, australia in 2004 and 2007. Remote Sens. 3: 42-64.
Lyzenga, D.R. 1978. Passive Remote Sensing Techniques for Mapping Water Depth and Bottom Features. Applied Optics, 17, 379-383. Lyzenga DR. 1981. Remote sensing of bottom
reflectance and water attenuation parameters in shallow water using aircraft and landsat data. Int. J. Remote Sensing 2(1):71-82. Lyzenga, DR, Malinas NP, Tanis FJ. 2006.
Multispectral bathymetry using a simple physically based algorithm. IEEE Trans. on Geosci. and Remote Sens. 44(8):2251-2259. Melsheimer C, Liew SC. 2001. Extracting bathymetry
from multi-temporal SPOT. Paper presented at the 22nd Asian Conference on Remote Sensing, 5-9 November 2001, Singapore.
Mumby PJ, Harborne AR. 1999. Development of a systematic classification scheme of marine habitats to facilitate regional management and mapping of Caribbean coral reefs. Biologic. Conserv. 88:155-163.
SEMINAR PROCEEDING
International Seminar and Workshop on Hydrography
Roles of Hydrography in Marine
Industry and Resources Management
Steering Committee
Head of Geospatial Information Agency, Dr. Asep Karsidi, MSc Head of National Land Agency, Hendarman Supandji, S.H., M.H., C.N. Head of Hydro-Oceanographic Office, Laksma TNI Aan Kurnia, SSos Head of Indonesian Surveyor Association, Ir. Budhy Andono Soenhadi, MCP Head of Indonesian Hydrographic Society, Prof. Dr.-Ing. Sjamsir Mira
Reviewer and Scientific Committee
Prof. Dr. Widyo Nugroho SULASDI (Bandung Institute of Technology) Prof. Dr. Hasanuddin Z. Abidin (Bandung Institute of Technology) Prof. Dr. Razali Mahmud (University of Technology Malaysia-Malaysia) Prof. Dr.-Ing. Delf Egge (Hafen City University, Hamburg, Germany)
Organizing Committee
Chair : Dr. Ir. Samsul Bachri, M.Eng Co-chair : Ir. Tri Patmasari, MSi Finance : Sylvia Nayoan
Secretary : Ir. Nanang Henky Suharto Co-secretary : Wiria Indraswari, SE Sponsorship : Ir. Fuad Fachrudin Publication : Ir. Syartoni Kamaruddin Security and Permit : Kol. Laut Daryanto
: Letkol. Laut Nurriyadi
Coordinator of Seminar : Dr.rer.nat. Wiwin Windupranata, ST., MSi Publication : Agung Pandi Nugroho, ST.
Sella Lestari, ST, MT Design : Auzan Kasyfu Ambara Registration : Intan Hayatiningsih, ST, MSc
Alifiya Ikhsani Apriliyana
Coordinator of Exhibition : Renny Rachmalia, ST. Coordinator of Workshop : Kol. Laut. Trismadi
iv
O
O
Or
r
r
g
ga
g
a
an
n
n
i
iz
i
z
z
e
er
e
r
r
a
a
an
n
n
d
d
d
S
S
S
p
po
p
o
on
n
n
s
s
s
o
o
o
r
r
r
Main Organizer
Indonesian Surveyor Association, Ikatan Surveyor Indonesia (ISI) Indonesian Hydrographic Society, Masyarakat Hidrografi Indonesia (MHI) Geospatial Information Agency, Badan Informasi Geospasial (BIG) National Land Agency, Badan Pertanahan Nasional (BPN)
Naval Hydro-Oceanographic Office, Dinas Hidro-Oseanografi (DISHIDROS)
Co-Organizer
Bandung Institute of Technology, Institut Teknologi Bandung (ITB) Batam State Polytechnic, Politeknik Negeri Batam (Poltek Batam) Maritime University Raja Ali Haji, Universitas Maritim Raja Ali Haji (UMRAH) Naval Hydro-Oceanographic Training Centre, Pusat Pendidikan Hidro-Oseanografi (PUSDIKHIDROS) Riau Islands Province Government, Pemprov Kepulauan Riau Batam Indonesia Free Zone Authority, Badan Pengusaha Batam (BP Batam)
Gold Sponsor
Silver Sponsor
Workshop Sponsor
-
Dear Hydrographers and Distinguished Guests,
It is my great pleasure to have this opportunity to welcome many participations from countries all over the world. I am very pleased to be grateful for all of you to the International seminar and Workshop on Hydrography on behalf of the organising committe and all those who have constributed to this Seminar and workshop.
It was December 2012, when the Indonesian Surveyor Association (ISI) and Indonesian Hydrographic Society (MHI) began to initiate the first International Hydrography Seminar in Indonesia, since then the various preparations for the Seminar have progressed steadily, especially through the hard work of the Organising committee.
The objective this seminar is to share and perceive the development of science, technology as well as human resources on hydrography in the world. Futhermore, workshop is intended to develop the capacity of human resources on the ability of Hydrography.
Our Seminar’s theme : “ the roles of Hydrography for marine Industry “ was selected partly due to the significant important for Indonesia which is an Archipelagic country, and has abundant marine resources.
I am sure that our Seminar and Workshop will constribute to a substantial progress in approaching the goals of sustainable development marine Industry in the local and global scale, one of the central problems of contemporary hydrography.
This event is organized by ISI and MHI incorporate with Geospatial Information Agency (BIG), Hydro-Oceanographic Office (DISHIDROS), Bandung Institute of Technology (ITB) and National Land Agency (BPN). Moreover, the constribution of KOSNBERG, CARIS, FUGRO, and other stakeholders who have provided significant assistance to run this seminar and workshop.
We sincerely this Seminar and workshop will be a forum for productive discussions and learning by all participations.
With the great success of seninar and workshop on Hydrography 2013, I sincerely wish that you have an enjoyable stay in Batam of Riau Islands Province and have nice time in this wonderful country
Samsul Bachri, Chair of the Organising Committee
vi
Dear All Participans,
First of all, I would like to thank to the Mighty God, Allah SWT and all supporting organizations and institutions which make this INTERNATIONAL SEMINAR AND WORKSHOP ON HYDROGRAPHY (ISWH 2013) happen. The event is organized by Indonesian Surveyor Association (ISI) and Indonesian Hydrographic Society (MHI) together with Geospatial Information Agency (BIG), Hydro-Oceanographic Office (DISHIDROS), Bandung Institute of Technology and National Land Agency (BPN). It is an honour for ISI and MHI to organize the first event of hydrographic-related seminar in Indonesia. The seminar is intended to identify development of science, technology as well as human resources in hydrography in the world, particularly Indonesia and ASEAN region to support sustainable development planning and maritime industry.
As it is defined by International Hydrographic Organization (IHO), hydrography is the branch of science which is dealing with measurement and description of the nature and configuration of seabed and the dynamics of water bodies. Hydrography plays an important role in any aspect of maritime and coastal development. It is related to basic knowledge of the geographical, geological and geophysical features of the seabed and coast, as well the currents, tides and certain physical properties of the sea water. In brief, Hydrography is the key to progress on all maritime activities, normally of great national economic importance.
In addition to supporting safe and efficient navigation of ships, hydrography underpins almost every other activity associated with the sea, including resource exploitation, environmental protection and management, maritime boundary delimitation, national marine spatial data infrastructures, recreational boating, maritime defence and security, tsunami flood and inundation modelling, coastal zone management, tourism and marine science.
Indonesia, with 17,508 islands, 81,000 km of coastline, and 3.1 million km2 of maritime area is the largest archipelagic country in the world. Based on the United Nations Convention on the Law of the Sea 1982, Indonesia has a sovereign right to utilize and manage the Exclusive Economic Zone (EEZ) as large as 2.7 million km2. Its coastal and marine area has a huge number of both renewable as well as unrenewable resources. In order to utilize and manage the marine and coastal resources properly, it is required to have an appropriate geospatial data infrastructure for planning, execution, and evaluation, which are regulated by law and public policy.
Bathymetry, seabed features, as well the currents, tides and certain physical properties of the sea water are types of marine and coastal geospatial information. Related to the Geospatial Information, Indonesian Government has produced a National Law Nr. 4/2011 about Geospatial Information to assure availability of and access to responsible and accurate geospatial information as well as to establish expediency of those geospatial information.
As the official Geospatial Information Agency in Indonesia, Geospatial Information Agency (Badan Informasi Geospasial-BIG) has deliver a National Act Planning through an inter-governmental agencies and departments coordination meeting to support efficient and effective spatial decision support system for national sustainable development planning.
In July 2002, the revised Chapter V of the IMO Safety of Life at Sea (SOLAS) Convention entered into force. Under the new Regulation 9, the Contracting Governments of SOLAS are now required to provide and maintain Hydrographic Services and products.
Many charts which were adequate a decade ago, may have to be recompiled using new survey data, collected to a higher degree of accuracy and providing improved coverage. This deficiency may not be limited to sparsely surveyed waters of developing nations, but may also apply to the coastal waters of major industrial states. The advent of accurate satellite navigation, has made poorly positioned historical data an even greater problem for navigators. Fortunately, new survey technologies have improved the precision to which modern hydrographic surveys can be conducted.
Indonesian Surveyor Association (ISI) is a professional organization for surveyors which was established on 27 June 1972. It has a long history on supporting geodetic, surveying, mapping and geospatial information projects in Indonesia. ISI was created based on the same vision of surveying and mapping experts to place the human resources development as the key component for development of geospatial information science and technology. Since 2008, Indonesian’s hydrographer society created an official organization to support hydrographic science and technology development as well as an exchange and discussion media for all hydrographic survey experts and companies in Indonesia. This organization was initiated by Prof. Dr. Ing. Sjamsir Mira and is named as Masyarakat Hidrografi Indonesia (MHI) or Indonesian Hydrographic Society.
Finally, I would like to great all participants of ISWH2013. Citing the Indonesian Navy motto, Jalesveva Jayamahe, ON THE SEA WE ARE GLORIOUS, I wish you to have a very nice seminar and workshop event
Cibinong, 17 August 2013 Head of Indonesian Surveyor Association
ix
TABLE OF CONTENTS
Page Ship Detection based on Synthetic Aperture Radar Technique Agustan
Rubby Sidik Agustino
1
Mapping of Coastal Vulnerability Index on Coastal Erotion In The Perspective of Eeconomy (Study Area: Kecamatan Muara Gembong, Kabupaten Bekasi)
Aldila Pradhana, S.T. Dr. rer. nat. Wiwin Windupranata, M.Si.
Dr. Ir. Dwi Wisayantono, M.T.
9
The Spatio Temporal Dynamic of Diffuse Attenuation Coefficient In The Tropical Berau Estuary, East Kalimantan Indonesia
Wiwin Ambarwulan Widiatmaka
21
Mapping Multi Coastlines With Multi-Tidal Imageries Fahmi Amhar Habib Subagio Tri Patmasari
29
Identification Problem of Marine Cadastrein Indonesian Archipelagic Perspective
Yackob Astor
Widyo Nugroho SULASDI S. Hendriatiningsih Dwi Wisayantono
33
The Comparison of Bathymetric Estimation from Three High Resolution Satellite Imagery
Samsul Bachri
Muhammad Banda Selamat Vincentius P Siregar Sam Wouthuyzen
43
The Progression of Multi-Dimensional Water Column Analysis in a Processing Environment
Corey M. Collins Andrew Hoggarth Matthew Holland
51
Variability of Sea Surface Temperature and Sea Surface Salinity in the Ambon Bay and its Relation to ENSO/IOD and Monsoon
Corry Corvianawatie* Mutiara Rachmat Putri Sri Yudawati Cahyarini Willem Merpy Tatipatta
55
The Calculation of Erosion and Sedimentation Rate in Coastal Zone Using Satellite Imageries (Case Study: Kecamatan Muara Gembong, Kabupaten Bekasi, West Java)
Dianlisa Ekaputri, S.T. Dr. rer. nat. Wiwin Windupranata, M.Si. Dr. Agung Budi Harto, M.Sc.
61
Reconstructing Disrupted Water Level Records in A Tide Dominated Region Using Data Mining Technique
Hidayat Fajar Setiawan Unggul Handoko
71
Initiative on Implementation of 3D Cadstre In Indonesia Sri Karina, ST, DEA Deni Santo, ST Dr. Trias Aditya Dr. Eka Djunarsjah, MT
77
Geomatics Roles In Capacity Building For Hydrographic Mapping at Prigi Beach
Khomsin Yuwono
Akbar Kurniawan
89
The Coastal Platform Morphodynamics Characteristics Belang Bay, North Sulawesi Province
Joyce Christian Kumaat Sontje Tonly Boy Kandoli Agnes Tenly Moningkey
93
Evaluation of Warm Water (thermal) dispersion using a numerical model at the Binceta Coast (North Sulawesi) in PLTU Development
Mahatma Lanuru 97
RV Baruna Jaya Marine Data Processing and Information Management
Imam Mudita Fineza Ilova Ratna Juwita
107
Study On The Other Possible Applications of The Aavailable Tie Points of The Basepoints In Indonesia
Rorim Panday Sri Handoyo
x
Susilohadi Kresna Tri Dewi Nugroho Dwi Hananto Mustaba Ari. Suryoko Nazar Nurdin Eko Saputro Adi C. Sinaga
Septriono Hary. Nugroho
Marine Geoscientific Survey for Possible Extend of Indonesia Legal Continental Shelf Beyond 200 M at North Papua – Indonesia : A Preliminary Results
Catur Purwanto Nugroho D. Hananto Mustafa Hanafi Hersenanto C. Widi Rahadian
Rainer A. Troa Tumpal Bernhard Bisma J. Zakaria Ronald D. Michel Andi Wisnu
LKI 2013 Expedition Team
131
20071Pseudo 3D Sesmic Methods Using 2D Seismic Multichannel Data Taken From Offshore Karawang, West Java
Trevi Jayanti Puspasari, SSi Dr. Udrekh
Sumirah, S.Si
135
Study The Changes of SSH Value Using Altimetry Satellite In The NKRI’S Outermost Islands
(Case Study: Fani Island)
Dika Ayu Safitri Muhammad Taufik Yuwono
139
The Study of Sea Bottom Morphology and Bathymetric Mapping Using Worldview-2 Imagery
Iwan E. Setiawan Doddy M. Yuwono Vincentius P. Siregar Gatot H. Pramono
143
People and The Environmental Change: Impact and Aadaption Model
Dewayany Sutrisno 151
Designing of Decission Support System For Maritime Boundary Management In South China Sea
Trismadi S. Sutisna K.B. Seminar Machfud
159
Hydrodynamic Condition of Kapuas Kecil River, Pontianak Based On Simulation Model
Iswiati Utamiputeri Mutiara Rachmat Putri Zainal Arifin