POLYPHENOL EXTRACTION FROM MANGOSTEEN
PERICARP (
Garcinia mangostana
L
.)AND
ITS APPLICATION IN TEA PRODUCT
RUFNIA AYU AFIFAH
DEPARTEMENT OF FOOD SCIENCE AND TECHNOLOGY
FACULTY OF AGRICULTURAL ENGINEERING AND TECHNOLOGY BOGOR AGRICULTURAL UNIVERSITY
STATEMENT LETTER OF MANUSCRIPT AND SOURCES OF
INFORMATION*
Hereby I genuinely stated that the manuscript entitled Polyphenol Extraction from Mangosteen Pericarp (Garcinia mangostana L.) and Its Application in Tea Product is an authentic work of mine under supervision of academic conselor and never being presented in any forms and universities. All the information taken and quoted from published or unpublished works of the writters has been mentioned in texts and attached in the bibliography at the end of this manuscript.
Hereby I bestow the copyright of my manuscript to the Bogor Agricultural university and Mae Fah Luang University.
Bogor, Desember 2013
Rufnia Ayu Afifah
ABSTRACT
RUFNIA AYU AFIFAH. Polyphenol Extraction from Mangosteen Pericarp (Garcinia mangostana L.) and Its Application in Tea Product. Supervised by DR. MUHAMMAD ARPAH and DR. CHUTAMAT NIWAT.
Mangosteen pericarp has high polyphenol content that have disease preventive properties. The objective of this research was to utilize mangosteen pericarp from waste into added value and to evaluate stability on polyphenol content of green tea drink with mangosteen pericarp extract. Mangosteen pericarp was dried at 50ºC using tray dryer and the moisture content reached 7.43±0.10%. Dried pericarp was extracted with distilled water at 1:5 ratio (w/v). Green tea drink was added by mangosteen pericarp extract with seven different concentrations (0.1-0.7%). The extract then was infused into green tea drink which was mixed with three different concentrations of citric acid (0.06, 0.1, and 0.2%). The result showed that mangosteen pericarp extract had total phenolic compound (127.39±1.19 mg GAE/ml sample), DPPH (4491.63±67.52 µmol Trolox/ml sample), and FRAP (21,492±134.50 mM asorbic acid/ml sample). The maximum concentration of mangosteen pericarp extract in the tea drink that can be accepted by panelist was 0.4%. Tea with the highest concentration of citric acid (0.2%) had the lowest pH (2.79), the highest total phenolic compound (25.48±0.38 mg GAE/ml sample), DPPH (57862.08±1248.85 µmol Trolox/100 ml sample), and FRAP (5,681.11±33.39 mM asorbic acid/ml sample) compared with other treatments (p<0.05). Therefore, the study concluded that mangosteen pericarp extract can be applied in tea drink and provided more polyphenol content for the product. In addition, polyphenol was more stable in acid condition.
Manuscript
submitted as a partial fulfillment of the requirement for degree of Sarjana Teknologi Pertanian
at the Departement of Food Science and Technology
POLYPHENOL EXTRACTION FROM MANGOSTEEN
PERICARP (
Garcinia mangostana
L
.
) AND
ITS APPLICATION IN TEA PRODUCT
DEPARTEMENT OF FOOD SCIENCE AND TECHNOLOGY
FACULTY OF AGRICULTURAL ENGINEERING AND TECHNOLOGY BOGOR AGRICULTURAL UNIVERSITY
BOGOR 2013
Title : Polyphenol Extraction from Mangosteen Pericarp (Garcinia mangostana L.) and Its Application in Tea Product
Name : Rufnia Ayu Afifah Student ID : F24090055
Approved by,
Dr. Ir. Muhammad Arpah, M.Si Advisor
Acknowledged by,
Dr. Ir. Feri Kusnandar, M.Sc
Head of Departement of Food Science and Technology
PREFACE
Praise to Allah for the mercy, the graciousness, and the guidance throughout the research and manuscript completion. The research entitled
“Polyphenol Extraction from Mangosteen Pericarp and Its Application in Tea Product” was carried out in Mae Fah Luang University from June to October 2013.
By completion of this research and manuscript, the author would like to express great appreciation and sincere thanks to :
1. Beloved Ibu, Bapak, and Dek Fadly for their endless loves, cares, and support. 2. Dr. Ir. Muhammad Arpah, M.Si, as academic advisor, for his enormous help
academically throughtout the completion of my manuscript.
3. Dr. Chutamat Niwat for her valuable and inspiring advices, supports, loves, and also her time providing me as advisee at Mae Fah Luang University. 4. Dr. Nancy Dewi S.TP, M.Sc and Ibu Dias Indrasti, S.TP, M.Si, as examiners,
for their time, corrections, input and helps.
5. Ditjen DIKTI for full financial support during research and all of comitte of AIMS Exchange Program both in IPB (Bapak Eko, Ibu Sima, Ibu Dias, Bapak Pungki, Mbak Tika) and MFU (Ajarn of Food Technology, Ms. Warunee Kaewbunruang and other staff of International Division Affair) for chance doing research in MFU and chance knowing another part of the world. 6. Bapak Lutfi Rauf as ambassador of Indonesia for Thailand and Bapak Yunardi Yusuf as Attache Educational and Culture for their kindness and help. 7. All of staff in S4 Laboratory (Phii Tik, Phii Phin, Phii Sud, Phii Kwan) also
all of staff in Departement of Food Science and Technology (Mbak Anie, Mbak Ina, Mbak May, Ibu Novi etc) for their time to help.
8. The Minis that was not mini anymore (Sarida, Farah, Annisa, Faisal) for love, care, support and beautiful friendship during survive studying in foodtech. 9. AIMS Student Thailand 2013 (Idong, Desi, Olga, Stella, Jenny, Ardi, Ardy)
and MFU Friends (Mameaw, Praw, Foodtech student, Muslim Club students, and others) for kindness and wonderful memories during stay in Thailand. 10. P2 team for the greatest colaboration during laboratory class and all of
foodtech „46 student for being together in good and bad time.
Last but not least, hopefully this manuscript is useful for the readers and gives a real contribution in food science development.
Bogor, Desember 2013
TABLE OF CONTENT
LIST OF FIGURE x
LIST OF TABLE x
LIST OF APPENDIX x
INTRODUCTION 1
Background 1
Objective 1
METHODOLOGY 2
Materials 2
Instruments 2 Methods 2
Method of Analysis 3 RESULT AND DISCUSSION 5
Polyphenol extraction in mangosteen pericarp 5
Extract Application in Tea Product 5
Chemical quality of green tea drink with mangosteen pericarp extract 7
CONCLUSION AND RECOMMENDATION 13
Conclusion 13
Recommendation 14
REFERENCES 14
APPENDIX 16
LIST OF TABLE
1. Formulation of tea drink mixed with extract.
2. Formulation of tea drink mixed with extract and citric acid. 3. Chemical content of mangosteen pericarp extract
4. Chemical content of tea drink with extract.
5. Chemical content of tea drink with extract per total phenol.
6. Sensory analysis tea drink.
7. Chemical content of tea drink mixed with extract and citric acid.
8. Chemical content of tea drink mixed with extract and citric acid per total phenol
9. Sensory analysis tea drink mixed with extract and citric acid.
LIST OF FIGURES
1. Fresh mangosteen pericarp and dried mangosteen pericarp 2. Ingredients of green tea drink
3. Five formulas of green tea drink
LIST OF APENDICES
1. Moisture content of dried powder mangosteen pericarp 2. Preparation standar solution
3. Standard curve for total polyphenol of extract 4. Standard curve for DPPH of extract
5. Standard curve for total polyphenol of green tea drink with extract 6. Standard curve for DPPH of green tea drink with extract
7. Standard curve for FRAP of extract and green tea drink with extract 8. Standard curve for TPC of green tea mixed with extract and citric acid 9. Standard curve for DPPH of green tea mixed with extract and citric acid 10.Standard curve for FRAP of green tea mixed with extract and citric acid 11.Result of total polyphenol content
12.Result of DPPH assay 13.Result of FRAP assay
14.Sensory analysis of green tea with extract
15.Sensory analysis of green tea with extract and citric acid 16.Score sheet sensory analysis green tea with extract
17.Score sheet sensory analysis green tea mixed with extract and citric acid 18.Statistical analysis of chemical analysis tea with extract
19.Statistical analysis of sensory analysis tea with extract
1
INTRODUCTION
Background
Garcinia mangostana L. or Mangosteen is a tropical fruit from the family Guttiferae (Ji et al., 2007). Thailand and Indonesia have a lot of production of mangosteen. From the data of FAOSTAT in 2011, mangosteen production in Thailand is approximately 3,000,000 tons and 2,000,000 tons in Indonesia.
Mangosteen consists of endocarp and pericarp. Pericarp of mangosteen is the largest part of the fruit. According to Siriphanick and Luckanatinvong (1997), the part of pericarp is almost 66.67% of the total fruits. It has deep reddish purple when ripe and usually disposed as waste due to its unpleasant taste of bitterness. However, this pericarp has a lot of polyphenol content, such as xanthone. So, we can utilize it as a good source of antioxidant. According to Pedraza-Chaverri et al.
(2008), consumption of mangosteen pericarp products has increased as dietary supplement because of their potential pharmaceutical property.
Numerous extraction methods have been conducted to get the phenolic compounds from mangosteen pericarp due to the relationship between phenolic compounds with an antioxidant capacity. However, the most commonly used method of extraction of phenolic compounds was mixing mangosteen pericarp with organic solvent or aqueous organic solvent for a period of time to ensure complete extraction (Cheok et al. 2001).
Mangosteen pericarp extract should can be applied in food product. One of food product that can be mixed with mangosteen pericarp extract is tea. Tea is one of the most popular drink. More than three billion cups of tea are consumed daily worldwide (Hicks 2009). Recently, popularity of tea has increased due to its potential health benefits against cardiovascular diseases and cancer as well as pharmaceutical activities such as anti-hypertensive, antiateriosclerotic, hipo-cholesterolic, and hypolipidemic properties mostly from activities of antioxidant flavonoids present in tea (Cheng 2006).
Mangosteen pericarp extract and tea drink is matched due to the acidity properties. The phytochemical screening performed on the mangosteen pericarp extract showed that it is acidic with pH 5 (Judilyn et al. 2012). In tea, polyphenol is stable when pH is below 4, whereas they are unstable in solutions with pH>6 (Ananingsih et al. 2013). In comercial process, pH of drink tea usually adjusted in acid condition until pH reaches 3.8-4.0 (Bazinet 2010). Citric acid is normally used for adjusting pH of tea drink (Kusumaningrum 2008).
Adding extract of mangosteen pericarp may add some taste in the tea drink and also may increase functional properties, like its antioxidant capacity because of its high polyphenol content. However, the ingredient of tea drink may have effect on the stability of the polyphenol in both of mangosteen pericarp extract and tea.
Objectives
2
RESEARCH METHODOLOGY
Materials
Mangosteens and dried green tea were obtained from Baan Duu Market in Chiang Rai, Thailand. Sucrose and fructose syrup were obtained from market with Mitr Phol® Brand. Other material was citric acid.
Chemical reagent that used in this research were Folin-Ciocalteu‟s phenol reagent from Loba®, gallic acid, 2,2-Diphenyl-1-picrylhydrazyl, and Trolox-6-hydroxy-2,5,7,8-tetramethyl-chroman-2-carboxylic acid from Sigma Aldrich®, sodium carbonate from Ajax, Univar, Unilab, potassium hexacyano-ferrate (III) from Rankem®, iron (III) chloride hexahydrate from Fisher®, trichloroacetic acid from Loba®, sodium dihydrogen phosphate from JHD®, disodium hydrogen phosphate from Fisher, ascorbic acid and methanol from Ajax, Univar, Unilab, and distilled water.
Instruments
Instrument that used in this research were tray dryer, hammer mill, shaking water bath, centifuge, rotary evaporator, spectrophotometer (UV Vis. Biochrom/Libra S22, England), oven, analytical balance, pH meter, glassware.
Method
Polyphenol extraction in mangosteen pericarp
Extraction methods were modified from methods of Cheok et al. (2012) and Zarena (2009). Mangosteen was washed and seperated between fruit and pericarp then weighted. Mangosteen pericarp was tray dried at 50°C until the moisture content reaches 7 %. Dried mangosteen pericarp was ground into powder using hammer mill equipment.
Twenty grams of mangosteen pericarp powder was accurately weighed in a 250 ml erlenmeyer flask. After that, 100 ml of distilled water was added to erlenmeyer flask. The mixture was stirred for 20 hours on a shaking water bath at 25°C. The mixture then was centrifuged at 5,000 rpm for 10 minutes and filtered with Whatman filter paper No. 1. After filtering the extract, the filtrate was concentrated using rotary evaporator at 40°C for 1 hour at 120 rpm. The volume of the each extract was noted then the extract was stored in refrigerator 4°C until they were analysed of total polyphenol content, DPPH, and FRAP.
Extract Application in Tea Product
3
Table 1–Formulation of tea drink mixed with extract.
Ingredients Control T1 T2 T3 T4 T5 T6 T7 Concentration (%)
Tea infusion 88.7 88.7 88.7 88.7 88.7 88.7 88.7 88.7 Fructose 8 8 8 8 8 8 8 8
Sucrose 3 3 3 3 3 3 3 3 Extract 0 0.1 0.2 0.3 0.4 0.5 0.6 0.7
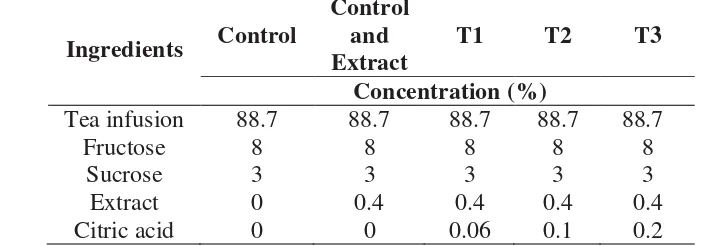
After that, the next step was applied the selected concentration of extract in tea drink then mixed with citric acid. Different concentration of citric acid (0.06, 0.1, and 0.2%) was used as a treatment. The formulation of tea drink was follow table below :
Table 2–Formulation of tea drink mixed with extract and citric acid.
Ingredients Control
Control and Extract
T1 T2 T3
Concentration (%)
Tea infusion 88.7 88.7 88.7 88.7 88.7 Fructose 8 8 8 8 8
Sucrose 3 3 3 3 3 Extract 0 0.4 0.4 0.4 0.4 Citric acid 0 0 0.06 0.1 0.2
After adding citric acid in tea drink, mangosteen pericarp extract was added then stirred until homogen. After that, tea drink was pasteurized in 70oC for 2 minutes. Then bottle was prepared and introduced into a pre-heating stage, in boiled water, to reduce thermal shock. After pasteurized, tea was put in the bottle. The final step was a cooling process. This process reduces product temperature to aroud 40 oC.
Method of Analysis
Sample preparation
Mangosteen pericarp extract was diluted with ratio 1:200 and tea drink was diluted with ratio 1:100 with distilled water. Then the mixture was stirred for 10 minutes. Sample then was kept in refrigerator (4ºC) for further analysis.
pH measurement
4
Determination of moisture content
According to AOAC (2002), moisture content of the dried pericarp powder was determined using oven method. The moisture can was cleaned and dried in hot air oven for 12 hours, then cooled in desiccators and weighed using digital balance. Samples were weighed and placed into moisture can then are dried in hot air oven at 105 oC overnight or until the constant weight accomplished. Then, the moisture can containing sample was cooled in desiccators and was weighed using digital balance. Dried sample was also weighed to determine its moisture content. The assay was carried out in triplicate.
% Moisture content (wet basis) =
x 100
% Moisture content (dry basis) =
x 100
Determination of total polyphenol content (TPC)
Total polyphenol content was determined according to the method described by the ISO 14502-1 (2005). This method was using gallic acid as a standard. 1.0 ml of diluted sample extract was put into tubes. Then, 5.0 ml of 10% v/v Folin-Ciocalteu‟s reagent and 4.0 ml of 7.5% w/v sodium carbonate solution was added. The mixture was left for 1 hour at room temperature and then measured the absorbance at 765 nm using water as blank. The total polyphenol content was expressed as gallic acid equivalents (GAE) in mg/ml sample extract. The assay was carried out in triplicate.
TPC = [ ]
Determination of DPPH radical scavenging activity
The DPPH assay was determined according to the method of Molyneux (2004). 50 µl of diluted sample extract was mixed with 1950 µl of 60 µM DPPH solutions. Then, the mixtures were left in the dark place for 30 minutes and measured the absorbance at 517 nm using methanol as blank and Trolox as standard. The radical scavenging activity was expressed as % inhibition and the assay was carried out in triplicate.
DPPH = [ ]
Determination of ferric reducing antioxidant power (FRAP)
5 10% trichloroacetic acid and centrifuged for 10 min. 2.5 ml of supernatant was mixed with 2.5 ml of water and 0.5 ml of 1% ferric chloride. Then, the mixture was measured the absorbance at 700 nm. The assay was carried out in triplicate. FRAP = [ ]
Sensory analysis
Sensory evaluation was carried out to know the acceptance of tea product. Thirty panelist were determined the sensory evaluation of green tea drink with mangosteen pericarp extract. Green tea drink with mangosteen pericarp extract were evaluated on the basis of acceptance of their color, aroma, tea flavor, sweetness, sourness, bitterness, taste, and overall liking. Then, 9-point hedonic scale was used for testing.
Statistical analysis
All data was analysis of variance to identify different among means by
Duncan‟s multiple range test using SPSS program (version 16.0) at p<0.05.
RESULT AND DISCUSSION
Polyphenol extraction in mangosteen pericarp
Mangosteens were obtained from Baan Duu market, traditional market in Chiang Rai (Thailand). Mangosteen pericarp was tray dried at 50°C. According to Suvarnakuta et al. (2010), 75oC was proposed as an appropriate drying technique and condition to preserve polyphenol in mangosteen pericarp. So, drying at 50°C could prevent the damage of polyphenol compounds. Mangosteen pericarp was dried for 53 hour until the moisture content of the dried pericarp powder was found to be 7.43±0.10%. Data was shown in Appendix 1.
6
Junita et al. (2001), organic solvent is not matched for extracting main ingredient because the extract will be used at food product formulation. The mixtured then was centifuged at 5000 rpm for 10 minutes to separate the supernatant. Supernatant was filtered and it became crude extract. The crude extract was evaporated with rotary evaporated for concentrating the extact.
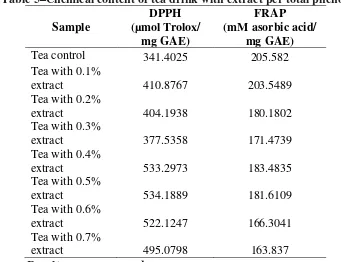
There were some chemical content that have been observed in this step, which were moisture content of dried powder pericarp, total polyphenol content, and antioxidant capacity by DPPH and FRAP method of mangosteen pericarp extract. Table 3 showed the amount of total polyphenol content, DPPH and FRAP value of mangosteen pericarp extract. Total polyphenol content of mangosteen pericarp extract was 127.3± 0.19 mg GAE/ml sample. DPPH value of mangosteen pericarp extract was 44,916.27±675.22 µmol Trolox/100 ml sample. It had higher result compare with antioxidant in Indonesian mangosteen pericarp extract which was 34,673 µmol Trolox/100 ml sample (Dungir et al. 2012) Futhermore, FRAP value of mangosteen pericarp extract was 21,492.66±134.50 mM asorbic acid/ml sample.
Table 3–Chemical content of mangosteen pericarp extract
Chemical content Concentration
Moisture content dried
mangosteen pericarp (%) 7.43±0.10 Total polyphenol content
(mg GAE/ml sample) 127.3± 0.19
DPPH antioxidant capacity
(µmol Trolox/100 ml sample) 44,916.27±675.22 DPPH antioxidant capacity
(µmol Trolox/mg GAE) 352.83
FRAP antioxidant capacity
(mM asorbic acid/ml sample) 21,492.66±134.50 FRAP antioxidant capacity
(mM asorbic acid/mg GAE) 168.83
Results were expressed as mean±SD.
Extract Application in Tea Product
Dried green tea was mixed with boiled water and became tea infusion. Tea infusion then was mixed with another ingredient, such as fructose and sucrose following the formulation of tea drink with Oishi® Green Tea brand.
7 For extend the shelf-life of tea drink, thermal process was given into tea drink. So after mixed, tea drink was pasteurized in 70oC for 2 minutes. Pasteurization was chosen because it matched with drinking product which had high acidity. Pasteurization also used not really high tempearture compare than sterilization, so the bioactive compound on the drink lost minimally (Haryadi 2000). After that, tea drink was hot filled to the bottle for keeping thermal condition avoiding the germination of microorganism. The final step was a cooling process. This process reduced product temperature to aroud 40oC for avoiding the germination of thermophilic bacteria (Haryadi 2000).
Pasteurization will be efective in high acid product. Citric acid usually use as acidulant for drinking product. Citric acid usually added to tea drink for adjusting pH and flavor enhancer. Citric acid could be preservative also because increasing acid will lower the pH so it against microorganism growth (Kusumawati 2008). Adding citric acid into tea drink also prevent polyphenol content. According to Zimmermann and Gleichenhagen (2001), lower pH can prevent oxidation reaction of polyphenol in green tea drink. According to Peters et al. (2010) conditioning solution in the acid condition can increase the stability of polyphenol content. So in the tea making process, citric acid was added before adding mangosteen pericarp extract.
Chemical quality of green tea drink with mangosteen pericarp extract
Total polyphenol content
Polyphenol is the main compound in mangosteen pericarp extract and tea.
Folin-Ciocalteu‟s assay was used to determine total phenolic content in sample. Darker color of solution, higher concentration of phenolic content. Total polyphenol content was analyzed using gallic acid as standard. Standard solution preparation was shown in Appendix 2 and standard curve was shown in Appendix 5.
Table 4 showed the data of total phenolic content of tea drink with extract. The highest amount of total polyphenol content was found at tea drink mixed with 0.7% extract (w/v) and it had significantly different with another tea treatments (p<0.05). Statistical analysis was shown in Appendix 18. From the data, it was known that total phenolic content was increased as increasing concentration of mangosteen pericarp extract. It because increasing concentration of mangosteen pericarp extract added more polyphenol content in tea drink.
Antioxidant capasity
8
an indicator of electron donating activity and can be strongly correlated with other antioxidant properties (Benzie and Strain 1996).
Table 4 showed the data of antioxidant capacity by DPPH method. Antioxidant capacity by DPPH method was analyzed using Trolox as standard. Standard solution preparation was shown in Appendix 2 and standard curve was shown in Appendix 4. From the data, it was found that adding higher concentration of extract in the tea drink increased antioxidant capasity by DPPH value. It was because higher concentration of extract added more polyphenol content in tea drink. As known, polyphenol content was main compound of antioxidant (Tsao 2010). So, adding more polyphenol content in tea drink, also add more antioxidant capacity in the tea drink The highest amount of antioxidant capacity by DPPH method was found at tea drink mixed with 0.7% extract (w/v) and it had significantly different with another tea treatments (p<0.05). Statistical analysis was shown in Appendix 18.
Table 4 showed FRAP data. Antioxidant capacity by FRAP method was analyzed using ascorbic acid as standard. Standard solution preparation was shown in Appendix 2 and standard curve was shown in Appendix 7. FRAP value was increased as increasing concentration of mangosteen pericarp extract. The highest amount of antioxidant capacity by FRAP method was found at tea drink mixed with 0.7% extract (w/v) and it had significantly different with another tea treatments (p<0.05). Statistical analysis was shown in Appendix 18. It had same result with antioxidant capacity by DPPH method.
Table 4–Chemical content of tea drink with extract.
Sample
Tea control 25.24±0.80h 86.17±3.60g 5188.89±103.60h Tea with 0.1%
Results were expressed as mean±SD
a-h in superscript in column was significantly different
9 Antioxidant capacity of tea drink with mangosteen pericarp extract also increase comparing with antioxidant capacity of mangosteen pericarp extract only. From this result, it can be found that polyphenol compound in tea also contibute for increasing antioxidant capacity in tea drink. The highest antioxidant capacity by DPPH method per total phenol in tea drink was tea drink with 0.5% of extract. It has same result with antioxidant capacity assay by FRAP method. Antioxidant capacity of tea drink with mangosteen pericarp extract increase comparing with antioxidant capacity of mangosteen pericarp extract only. The highest antioxidant capacity by FRAP method per total phenol in tea drink was tea drink with 0.4% of extract.
Table 5–Chemical content of tea drink with extract per total phenol.
Sample
Tea control 341.4025 205.582
Tea with 0.1%
extract 410.8767 203.5489
Tea with 0.2%
extract 404.1938 180.1802
Tea with 0.3%
extract 377.5358 171.4739
Tea with 0.4%
extract 533.2973 183.4835
Tea with 0.5%
extract 534.1889 181.6109
Tea with 0.6%
extract 522.1247 166.3041
Tea with 0.7%
extract 495.0798 163.837
Results were expressed as mean
Sensory Analysis
10
Table 6-Sensory analysis tea drink.
Sample Color Aroma Tea flavor Sweetness
Tea control 6.67±0.76ns 6.63±0.76a 6.40±0.97ab 6.43±0.97ns Tea with 0.1% extract 6.57±1.14ns 6.30±0.92ab 6.60±1.13a 6.53±1.14ns Tea with 0.2% extract 6.33±0.92ns 6.10±0.71b 6.53±1.07ab 6.47±0.97ns Tea with 0.3% extract 6.47±0.97ns 6.27±1.01bab 6.33±0.80ab 6.40±0.97ns Tea with 0.4% extract 6.60±1.00ns 6.07±0.64b 6.33±0.96ab 6.27±1.08ns Tea with 0.5% extract 6.47±0.97ns 5.47±0.82c 6.03±0.81ab 6.27±1.01ns Tea with 0.6% extract 6.27±1.08ns 5.47±0.73c 5.97±1.07b 6.30±0.79ns Tea with 0.7% extract 6.30±1.15ns 4.93±0.83d 6.10±0.96ab 6.57±0.77ns
Sample Bitterness Taste Overall
Tea control 6.07±0.99a 6.63±0.85a 6.60±0.77a Tea with 0.1% extract 6.33±0.84a 6.23±1.01ab 6.30±1.02ab Tea with 0.2% extract 6.27±0.83a 6.07±0.78b 6.03±0.72b Tea with 0.3% extract 6.27±1.05a 6.27±1.05ab 6.23±0.97ab Tea with 0.4% extract 6.07±0.74a 6.10±0.71b 6.03±0.67b Tea with 0.5% extract 5.50±0.86b 5.33±0.76d 5.37±0.76cd Tea with 0.6% extract 5.37±0.76bc 5.47±0.73d 5.43±0.77c Tea with 0.7% extract 5.03±0.81c 5.07±0.78d 4.97±0.81d
Results were expressed as mean±SD
a-d in superscript in column was significantly different ns in superscript in column was not significantly different
Chemical quality of green tea drink with mangosteen pericarp extract and different concentration of citric acid
pH
Different concentration of citric acid had significantly effected to pH of tea drink (p<0.05). Statistical analysis was shown in Appendix 20. Adding mangosteen pericarp extract decreased the pH of tea drink (Table 7). The phytochemical screening performed on the mangosteen pericarp extract showed that it was acidic with pH 5 (Judilyn et al. 2012). It made the pH of tea decreased when it was added by extract. Citric acid is an acidulant that can lower the pH of solution (Zimmermann and Gleichenhagen 2011). So, higher concentration of citric acid also decreased the pH of tea.
Total polyphenol content
11 acid. Total polyphenol content assay was analyzed using gallic acid as standard. Standard solution preparation was shown in Appendix 2 and standard curve was shown in Appendix 8.
This result showed that citric acid had significantly affected to the total polyphenol content (p<0.05). Statistical analysis was shown in Appendix 20. Total polyphenol was increased as increasing concentration of citric acid. Tea with extract and 0.2% of citric acid had the highest total polyphenol content (Table 7).
Total polyphenol content increased when concentration of citric acid increased and pH decreased. It is because low pH inactivated polyphenol oxidase so polyphenol is more stable at acidic condition (Ananingsih et al. 2010). It also had same result with Zimmermann and Gleichenhagen (2011) that showed the low pH can maintain the amount of main of polyphenol in the tea (catechin) than the alkaline or neutral condition.
Table 7-Chemical content of tea drink mixed with extract and citric acid.
Treatment pH Tea control 5.42±0.01a 13.66±0.27e 1,608.81±375.15e 4,137.78±22.69e Tea with
extract 4.95±0.02 b
17.19±0.08d 14,486±450.20d 4,562.22±1.93d Tea with
extract and 0.06% citric acid
3.58±0.01c 20.02±0.18c 42,470.36±921.02c 4,840.00±39.30c
Tea with extract and 0.1% citric acid
3.12±0.01d 22.51±0.12b 46,443.46±2,206.76b 5,004.44±36.72b
Tea with extract and 0.2% citric acid
2.97±0.01e 25.48±0.38a 57,862.08±1,248.85a 5,681.11±33.39a
Results were expressed as mean±SD
a-e in superscript in column was significantly different
Antioxidant capacity
12
is polyphenol compounds (Tsao 2010). So, when total polyphenol content increased, the antioxidant capacity of tea drink also increased.
Antioxidant capacity by FRAP method was analyzed using ascorbic acid as standard. Standard solution preparation was shown in Appendix 2 and standard curve was shown in Appendix 10. For the FRAP value, the result had similar trend with DPPH assay result. Citric acid had significantly affected to the antioxidant capacity by FRAP value of tea drink (p<0.05). Statistical analysis was shown in Appendix 20. Higher concentration of citric acid, it had higher concentration of antioxidant capacity by FRAP value. Lower pH because of increasing concentration of citric acid can maintain the polyphenol content which is the most of antioxidant compunds. The highest antioxidant capacity by FRAP method is also the tea drink with extract and 0.2% of citric acid.
Table 8-Chemical content of tea drink mixed with extract and citric acid per total phenol
Treatment DPPH
(µmol Trolox/mg GAE)
FRAP
(mM asorbic acid/mg GAE)
Tea control 117.7753 302.9122
Tea with extract 842.6992 265.3997
Tea with extract and
0.06% citric acid 2121.397 241.7582
Tea with extract and
0.1% citric acid 2063.237 222.3207
Tea with extract and
0.2% citric acid 2270.882 222.9635
Results were expressed as mean
Table 8 showed data of chemical content of tea drink with extract and citric acid per total phenol. From the data, it was found that adding mangosteen pericarp extract and citric acid in tea drink highly increase antioxidant capacity by DPPH method comparing with tea control. Antioxidant capacity of tea drink with mangosteen pericarp extract also increase comparing with antioxidant capacity of mangosteen pericarp extract only. From this result, it can be found that polyphenol compound in tea also contibute for increasing antioxidant capacity in tea drink. Citric acid also contribute to prevent antioxidant capacity in tea drink. The highest antioxidant capacity by DPPH method per total phenol in tea drink was tea drink with extract and 0.2 % of citric acid. However, it has different result with antioxidant capacity assay by FRAP method. Antioxidant capacity of tea drink with mangosteen pericarp extract increased comparing with antioxidant capacity of mangosteen pericarp extract only. In other hand, antioxidant capacity by FRAP method decreased after the tea drink was added by citric acid. Citric acid in the tea drink affected and reacted with the FRAP reagent that can decrease antioxidant capacity assay.
Sensory Analysis
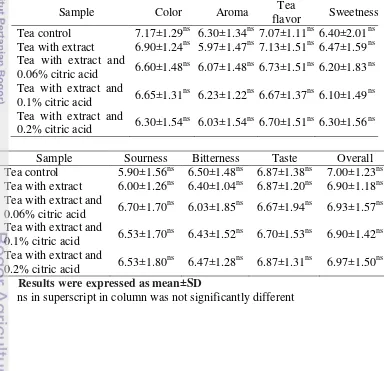
13 Appendix 15. Each panelist tested five samples. Sensory analysis was done to know the acceptance of tea drink product. Table 9 showed result of sensory evaluation of green tea drink with extract and different concentration of citric acid used 30 panelists. All of samples did not had significantly differenced in all atributtes (p<0.05). Statistical analysis was shown in Appendix 21. Color, aroma, tea flavor, sweetness, sourness, bitterness, taste, and overall got around 6 and 7 score from 9-scale. So, green tea drink with extract and different concentration of citric acid can be accepted.
Figure 3. Five formulas of tea drink
Table 9- Sensory analysis tea drink mixed with extract and citric acid.
Sample Color Aroma Tea
flavor Sweetness Tea control 7.17±1.29ns 6.30±1.34ns 7.07±1.11ns 6.40±2.01ns Tea with extract 6.90±1.24ns 5.97±1.47ns 7.13±1.51ns 6.47±1.59ns Tea with extract and
0.06% citric acid 6.60±1.48
ns
6.07±1.48ns 6.73±1.51ns 6.20±1.83ns Tea with extract and
0.1% citric acid 6.65±1.31
ns
6.23±1.22ns 6.67±1.37ns 6.10±1.49ns Tea with extract and
0.2% citric acid 6.30±1.54
ns
6.03±1.54ns 6.70±1.51ns 6.30±1.56ns
Sample Sourness Bitterness Taste Overall
Tea control 5.90±1.56ns 6.50±1.48ns 6.87±1.38ns 7.00±1.23ns Tea with extract 6.00±1.26ns 6.40±1.04ns 6.87±1.20ns 6.90±1.18ns Tea with extract and
0.06% citric acid 6.70±1.70
ns
6.03±1.85ns 6.67±1.94ns 6.93±1.57ns Tea with extract and
0.1% citric acid 6.53±1.70
ns
6.43±1.52ns 6.70±1.53ns 6.90±1.42ns Tea with extract and
0.2% citric acid 6.53±1.80
ns
6.47±1.28ns 6.87±1.31ns 6.97±1.50ns
Results were expressed as mean±SD
14
CONCLUSION AND RECOMENDATION
Conclusion
Mangosteen pericarp extract had high functional properties, such as polyphenol content and antioxidant capacity. Adding higher concentration of mangosteen pericarp extract increased functional properties in the tea drink. Maximum concentration of pericarp extract that can be added in the green tea drink according to sensory evaluation is 0.4%. Different concentration of citric acid was significantly affected to the pH, total phenolic compound, DPPH, and FRAP value. Tea with the highest concentration of citric acid had the lowest pH. Lowest pH of tea drink had the highest total phenolic compound, DPPH, and FRAP (p<0.05). For sensory analysis of tea product, the suggestion of panelist was to reduce the sweetness of this product.
Recommendation
Some recommendations of this study are using another acidulant that can prevent more polyphenol content in green tea drink or delevoping green tea drink product for industry-scale. Futhure research to support this can be done, include study about shelf-life of green tea drink.
REFERENCES
Ananingsih, V. K., Amber, S., Weibiao Z., 2013. Green tea catechins during food processing and storage: A review on stability and detection. J. Food Research International. 50:469–479.
AOAC. 1995. Method of Analysis. Assosiation of Official Analytical Chemistry. Washington D.C.
AOAC. 2002. Method of Moisture Content Analysis. Assosiation of Official Analytical Chemistry. Washington D.C.
Ashurst, Philip R. 2005. Chemistry and Technology of Soft Drink and Fruit Juices. Blackwell Publising, UK.
Benzie I F F, & Szeto Y T. 1999. Total Antioxidant Capacity of Teas by the Ferric Reducing/ Antioxidant Power Assay. J. Agricultural and Food Chemistry. 47:633-636.
Cheng T. O. 2006. Review. All teas are not created equal: The Chinese green tea and cardiovascular health. J. Cardiology. 108:301–308.
Cheok, Choon Y, Chin & Yus A., Yusof & Chung L., Law. 2012. Extraction of Total Phenolic Content from Garcinia mangostana Linn. hull. I. Effects of Solvents and UV–Vis Spectrophotometer Absorbance Method. J. Food Bioprocess Technology. 5:2928–2933
15 FAOSTAT. 2011. Data of Production of Mangosteen in Thailand and Indonesia.
[http://faostat.fao.org/site/339/default.aspx] accessed at June 9th 2013. Hariyadi, P. 2000. Dasar-dasar Teori dan Praktek Proses Termal. Pusat Studi
Pangan dan Gizi, PSPG-IPB. Bogor.
Hicks, Alastair. 2009. Current Status and Future Development of Global Tea Production and Tea Products. Assumption University Journal of Technology. 12(4):251-264.
ISO 14502-1. 2005. Determination of substance characteristic of green tea and black tea - Part 1 : Content of total polyphenols in tea – Calorimetric method using Folin – Ciocalteu reagent.
Ji X, Avula B, Khan IA (2007). Quantitative and qualitative determination of six xanthones in Garcinia mangostana L. by LC-PDA and LC-ESIMS. J. Pharmaceutical and Biomedical Analysis. 43(4):1270-1276.
Judilynn N. S. and Jea Giezl N. S. Preliminary Study on the Possible Use of Garcinia Mangostana L. (Fam. Guttiferae) Hulls as Colorant. J. International Conference on Environment and BioScience. 44:9.
Junita R. Triningsih, T. Elisabeth, W. Surjana, M. Ayu, and P. Haryadi. 2001. Formulasi Minuman Fungsional Traditional dari Rempah-rempah Menggunakan Konsep Optimasi Sinergisme Antioksidan. Di dalam : L. Nuraida dan R. Dewanti-Hariyadi (Eds). Prosiding Seminar Nasional Pangan Tradisional. Jakarta, 14 Agustus.
Kusumaningrum, D. dan M. Arpah. 2008. Pemetaan Karakteristik Komponen Polifenol untuk Mencegah Kerusakannya pada Minuman Teh Ready to Drink (Rtd). Skripsi. ITP-FATETA. IPB Bogor.
Kusumawati, R.P. 2008. Pengaruh Penambahan Asam Sitrat dan Pewarna Alami Kayu Secang terhadap Stabilitas Warna Sari Buah Belimbing Manis. Skripsi. ITP-FATETA. IPB Bogor.
Molyneux P. 2004. The use of the stable free radical diphenylpicrylhydrazyl (DPPH) for estimating antioxidant activity songklanakarin J. Science and Technology 26(2):211-219.
Pedraza-Chaverri, J., Rodríguez, N. C., Orozco-Ibarra, M. J., Pérez-Rojas, M. 2008. Medicinal properties of mangosteen (Garcinia mangostana). J. Food and Chemical Toxicology. 46:3227–3239.
Peters, C. M., Rodney J. G., Elsa M. J., Mario G. F., Formulation with ascorbic acid and sucrose modulates catechin bioavailability from green tea. J. Food Research International. 43:95–102
Siriphanick, J. and V. Luckanatinvong. 1997. Chemical Composition and The Development of Flesh Translucent Disorder in Mangosteen. In Proceeding of The Australian Postharvest Holticulture, University of Western Sydney Hawkesburry, NSW Australia. 410-413.
Suvarnakuta, P., Chanchawee C., Sakamon D. 2010. Effects of drying methods on assay and antioxidant activity of xanthones in mangosteen rind. J. Food Chemistry. 125:240–247
Tsao, Rong. 2010.Chemistry and Biochemistry of Dietary Polyphenols. Review.
J. Nutrient. 2:1231-1246.
16
Zarena, A. and K. U. Sankar. 2009. A Study of Antioxidant Properties from Garcinia Mangostana L. Pericarp Extract. Acta Science Polonorum Technology. 8(1):23-34.
17
APENDICES
Apendix 1. Moisture content of dried powder mangosteen pericarp W can
(g)
W sample (g)
W dried sample + can
(g)
W dried sample
(g)
% MC Mean SD
17.4208 2.0043 19.2757 1.8549 7.45
7.43 0.10 16.8510 2.0167 18.7201 1.8691 7.32
17.2343 2.0165 19.0988 1.8645 7.53
%MC (wet basis) =
x 100
%MC (wet basis) = –
x 100
= 7.45 %
Mean = (7.45 + 7.32 + 7.53) / 3 = 7.43 %
SD = √∑
= 0.01
Apendix 2. Preparation standard solution
Preparation standard solution of total phenolic content assay
Gallic acid was weight 0.0100 gram and dissolved with water in 10 ml volumetric flask. It became standard stock solution. After that, standard stock solution was diluted at several concentration 0 – 100 g/ml.
Preparation standard solution of DPPH assay
Weight 0.0250 gram trolox and dissolved with water in 10 ml volumetric flask. It became standard stock solution. After that, standard stock solution was diluted at several concentration 0 – 1000 g/ml.
Preparation standard solution of FRAP assay
18
Standard Curve TPC
y = 0.0539x - 1.1425
0 200 400 600 800 1000 1200
% Apendix 3. Standard curve for total polyphenol of extract
Concentration
Apendix 4. Standard curve for DPPH of extract
19
Standard Curve TPC
y = 0.0897x - 3.5932
0 200 400 600 800 1000 1200
%
Apendix 5. Standard curve for total polyphenol of green tea drink with extract
Concentration
Apendix 6. Standard curve for DPPH of green tea drink with extract
20
Concentration (µg/ml)
Standard Curve TPC
Apendix 7. Standard curve for FRAP of extract and green tea drink with extract
Concentration
Apendix 8. Standard curve for TPC of green tea mixed with extract and citric acid
21
0 200 400 600 800 1000 1200
%
Apendix 9. Standard curve for DPPH of green tea mixed with extract and citric acid
22
Apendix 11. Result of total polyphenol content
24
Apendix 12. Result of DPPH assay
26
Apendix 13. Result of FRAP assay
28
Apendix 14. Sensory analysis of green tea drink with extract
Panelist Color Tea flavor
29
Panelist Aroma Sweetness
30
Panelist Bitterness Taste
32
Apendix 15. Sensory analysis of green tea mixed with extract and citric acid
Panelist Tea flavor Color
C C+E T1 T2 T3 C C+E T1 T2 T3
1 7 6 7 6 7 7 7 7 5 7
2 8 8 8 8 8 7 8 7 7 7
3 4 5 8 7 6 8 7 5 4 6
4 8 9 7 6 5 9 8 6 7 5
5 6 7 7 6 7 5 6 6 5 5
6 8 8 7 6 5 7 7 8 8 7
7 3 6 6 5 8 6 7 3 6 8
8 7 7 9 7 7 6 6 8 8 8
9 6 6 7 8 7 7 7 8 8 7
10 5 4 3 9 8 5 4 3 9 8
11 9 9 9 6 7 8 8 7 6 6
12 7 8 6 6 5 9 9 8 9 8
13 8 8 8 8 8 6 7 7 7 7
14 8 5 5 6 6 9 6 6 4 4
15 8 6 7 7 8 8 8 8 8 8
16 7 7 6 4 4 7 8 7 7 7
17 9 6 5 8 6 9 9 7 7 6
18 8 6 9 9 9 7 7 4 4 5
19 7 6 7 7 7 5 5 8 8 7
20 5 7 8 7 7 7 8 8 6 7
21 8 9 7 8 9 4 8 9 6 5
22 7 7 6 7 8 8 7 7 6 7
23 9 9 7 6 7 9 8 7 7 7
24 5 6 7 7 8 7 7 8 8 7
25 8 7 6 6 7 7 8 8 7 8
26 8 7 6 6 7 7 7 7 7 7
27 8 7 6 5 7 7 8 8 7 8
28 8 7 3 4 4 6 6 6 7 6
29 8 7 6 5 4 7 6 5 5 5
30 8 7 5 5 3 8 7 6 7 8
Mean 7.2 6.9 6.6 6.5 6.6 7.1 7.1 6.7 6.7 6.7 Stdev 1.5 1.2 1.5 1.3 1.5 1.3 1.1 1.5 1.4 1.1 C = Tea control
C + E = Tea control + extract
33
Panelist Aroma Sweetness
C C+E T1 T2 T3 C C+E T1 T2 T3
1 6 6 6 5 6 6 6 6 6 8
2 8 7 6 8 7 8 8 5 8 8
3 4 8 5 7 4 6 7 8 5 4
4 9 8 7 6 5 5 6 5 7 4
5 7 7 7 6 7 3 7 5 4 4
6 8 8 5 7 4 7 6 5 5 6
7 5 6 5 6 7 3 6 5 6 8
8 7 7 9 7 7 8 8 9 8 8
9 5 5 7 7 7 5 5 7 7 7
10 5 4 3 9 8 9 8 5 4 6
11 9 8 8 6 8 9 9 7 7 7
12 6 6 7 7 7 8 7 8 6 6
13 5 5 6 6 6 8 8 8 8 8
14 5 6 5 5 4 4 3 2 6 5
15 6 6 6 6 6 8 7 8 8 8
16 6 7 5 6 5 8 8 5 4 5
17 5 5 6 5 5 3 3 6 6 6
18 5 5 6 5 6 9 4 9 7 7
19 5 5 7 8 8 3 3 5 5 5
20 6 7 7 6 7 6 6 8 7 8
21 7 7 8 8 7 3 5 6 8 4
22 6 6 7 6 6 8 7 6 5 6
23 7 8 7 8 9 6 8 9 9 9
24 6 6 6 6 6 5 6 7 7 7
25 8 7 6 6 7 8 7 6 6 7
26 8 7 6 6 6 8 7 6 6 7
27 8 7 5 5 6 8 7 4 4 7
28 6 6 4 5 4 7 7 6 5 6
29 5 6 8 6 4 6 7 8 6 5
30 6 8 2 3 2 7 8 2 3 3
Mean 6.3 6.5 6.1 6.2 6 6.4 6.5 6.2 6.1 6.3 Stdev 1.3 1.1 1.5 1.2 1.5 2 1.6 1.8 1.5 1.6 C = Tea control
C + E = Tea control + extract
34
Panelist Sourness Bitterness
C C+E T1 T2 T3 C C+E T1 T2 T3
1 6 6 7 6 8 7 7 7 6 8
2 8 8 7 8 8 8 7 4 8 6
3 5 6 7 8 4 4 7 5 4 8
4 3 4 9 7 8 3 4 9 7 8
5 4 5 7 5 6 7 5 6 3 5
6 6 7 4 4 4 7 7 5 4 4
7 3 6 4 7 8 4 6 6 7 7
8 7 8 9 8 8 6 8 9 8 8
9 6 6 7 7 7 6 6 7 7 5
10 9 8 5 4 7 9 8 5 4 7
11 7 7 9 8 8 7 7 7 7 7
12 6 6 8 8 8 7 8 7 7 7
13 5 5 7 8 9 8 8 8 8 8
14 5 4 5 7 6 7 6 5 8 7
15 8 7 7 8 8 8 7 8 8 7
16 6 6 8 4 7 6 4 2 4 7
17 5 5 8 7 7 5 6 6 7 6
18 5 4 9 7 6 9 6 9 8 4
19 5 5 8 8 7 7 6 7 6 6
20 5 6 9 7 7 6 7 8 7 7
21 4 3 5 7 3 6 6 4 8 4
22 7 6 5 6 6 6 6 6 7 7
23 5 7 8 9 9 5 6 8 8 7
24 6 6 7 7 8 5 6 6 7 7
25 8 7 6 6 6 8 7 6 6 7
26 8 7 6 6 6 7 6 6 6 7
27 8 7 6 6 7 8 7 4 4 7
28 6 7 3 2 2 6 7 3 5 4
29 4 5 7 8 4 8 6 5 7 5
30 7 6 4 3 4 5 5 3 7 7
Mean 5.9 6 6.7 6.5 6.5 6.5 6.4 6 6.4 6.5 Stdev 1.6 1.3 1.7 1.7 1.8 1.5 1 1.8 1.5 1.3
C = Tea control
C + E = Tea control + extract
35
Panelist Taste All
C C+E T1 T2 T3 C C+E T1 T2 T3
1 7 7 7 6 8 7 7 6 6 8
2 8 9 7 9 8 9 8 7 9 8
3 5 8 9 6 7 5 9 8 6 7
4 7 6 9 5 6 7 6 9 4 3
5 6 5 7 6 5 7 6 7 6 7
6 8 8 5 4 4 8 8 4 4 4
7 5 6 4 5 8 5 6 4 5 8
8 7 8 9 8 8 7 8 9 8 8
9 7 7 8 8 6 7 7 8 8 8
10 5 4 3 9 8 5 4 3 9 8
11 9 9 9 8 8 9 9 9 8 8
12 7 8 8 7 7 8 8 7 7 7
13 8 8 8 8 8 8 8 8 8 8
14 4 6 3 7 7 6 7 8 8 8
15 8 7 8 8 8 8 7 8 8 8
16 7 7 5 4 7 7 7 6 7 7
17 4 6 6 6 7 5 7 7 8 6
18 9 6 9 7 6 6 5 9 7 8
19 6 6 7 8 8 6 5 7 8 8
20 6 7 8 7 8 6 7 8 7 8
21 5 4 6 9 5 6 5 7 9 5
22 8 7 7 7 7 8 7 7 6 7
23 7 7 8 9 8 7 8 8 8 8
24 6 7 7 7 8 5 6 6 7 8
25 8 7 6 6 7 8 7 6 6 7
26 8 7 6 6 7 8 7 6 6 7
27 8 7 4 4 7 8 7 5 5 7
28 8 8 3 5 4 8 7 6 5 5
29 8 7 9 7 4 8 6 9 8 7
30 7 7 5 5 7 8 8 6 6 3
Mean 6.9 6.9 6.7 6.7 6.9 7 6.9 6.9 6.9 7 Stdev 1.4 1.2 1.9 1.5 1.3 1.2 1.2 1.6 1.4 1.5 C = Tea control
C + E = Tea control + extract
36
Apendix 16. Score sheet sensory analysis green tea with extract
9 – Point Hedonic scale
Product : Tea drink with mangosteen pericarp extract No...
Name... Date...
Instruction : Please evaluate samples from left to the right hand how much you like or dislike sample. Please fill appropriate score. Please do not compare each samples.
9 = Like extremely 8 = Like very much 7 = Like moderately
6 = Like slightly 5 = Neither like nor dislike 4 = Dislike slightly
3 = Dislike moderately 2 = Dislike very much 1 = Dislike extremely
Atributes Sample codes
624 409 900 955 809 856 935 925
Color
Aroma
Tea flavor
Sweetness
Bitterness
Taste
Overall
Suggestion... ...
...
...
37 Apendix 17. Score sheet sensory analysis green tea mixed with extract and citric
acid
9 – Point Hedonic scale
Product : Tea drink with mangosteen pericarp extract No...
Name... Date...
Instruction : Please evaluate samples from left to the right hand how much you like or dislike sample. Please fill appropriate score. Please do not compare each samples.
9 = Like extremely 8 = Like very much 7 = Like moderately
6 = Like slightly 5 = Neither like nor dislike 4 = Dislike slightly
3 = Dislike moderately 2 = Dislike very much 1 = Dislike extremely
Atributes Sample codes
265 344 826 647 748
Color
Aroma
Tea flavor
Sweetness
Bitterness
Taste
Overall
Suggestion... ...
...
...
38
Apendix 18. Statistical analysis of chemical analysis tea with extract Tests of Between-Subjects Effects
39
Error 2451168.000 16 153198.000
Total 7.709E9 24
a. R Squared = 1.000 (Adjusted R Squared = 1.000)
DPPH
The error term is Mean Square(Error) = 153198.000.
40
Tests of Between-Subjects Effects
Dependent Variable:FRAP
Source
Type III Sum of
Squares df Mean Square F Sig.
Model 1.053E9 8 1.317E8 20442.539 .000
sample 1.053E9 8 1.317E8 20442.539 .000
Error 103050.637 16 6440.665
Total 1.053E9 24
a. R Squared = 1.000 (Adjusted R Squared = 1.000)
FRAP
Duncana,,b
sample N
Subset
1 2 3 4 5 6 7 8
Tea Control 3 5188
Tea + 0.1 % Ext 3 5595
Tea + 0.2 % Ext 3 5800
Tea + 0.3 % Ext 3 5984
Tea + 0.4 % Ext 3 6788
Tea + 0.5 % Ext 3 7075
Tea + 0.6 % Ext 3 7388
Tea + 0.7 % Ext 3 8524.4
467
Sig. 1.000 1.000 1.000 1.000 1.000 1.000 1.000 1.000
Means for groups in homogeneous subsets are displayed. Based on observed means.
41 Apendix 19. Statistical analysis of sensory analysis tea with extract
Color
Tests of Between-Subjects Effects
Dependent Variable:color
Source
Type III Sum of
Squares df Mean Square F Sig.
Model 10015.000a 8 1251.875 1235.894 .000
sample 10015.000 8 1251.875 1235.894 .083
Error 235.000 232 1.013
Total 10250.000 240
a. R Squared = .977 (Adjusted R Squared = .976)
Sweetness
Tests of Between-Subjects Effects
Dependent Variable:sweetness
Source
Type III Sum of
Squares df Mean Square F Sig.
Model 9846.100a 8 1230.762 1304.417 .000
sample 9846.100 8 1230.763 1304.417 .137
Error 218.900 232 .944
Total 10065.000 240
42
Tests of Between-Subjects Effects
Dependent Variable:teaflavor
Source
Type III Sum of
Squares df Mean Square F Sig.
Model 9499.167a 8 1187.396 1241.814 .000
sample 9499.167 8 1187.396 1241.814 .000
Error 221.833 232 .956
Total 9721.000 240
a. R Squared = .977 (Adjusted R Squared = .976)
teaflavor
Duncana,,b
sample N
Subset
1 2
Tea + 0.6 % Ext 30 5.97
Tea + 0.5 % Ext 30 6.03 6.03
Tea + 0.7 % Ext 30 6.10 6.10
Tea + 0.3 % Ext 30 6.33 6.33
Tea + 0.4 % Ext 30 6.33 6.33
Tea Control 30 6.40 6.40
Tea + 0.2 % Ext 30 6.53 6.53
Tea + 0.1 % Ext 30 6.60
Sig. .052 .052
Means for groups in homogeneous subsets are displayed.
Based on observed means.
The error term is Mean Square(Error) = .956. a. Uses Harmonic Mean Sample Size = 30.000.
43
Tests of Between-Subjects Effects
Dependent Variable:aroma
Source
Type III Sum of
Squares df Mean Square F Sig.
Model 8432.500a 8 1054.062 1603.557 .000
sample 8432.500 8 1054.063 1603.557 .000
Error 152.500 232 .657
Total 8585.000 240
a. R Squared = .982 (Adjusted R Squared = .982)
aroma
Duncana,,b
sample N
Subset
1 2 3 4
Tea + 0.7 % Ext 30 4.93
Tea + 0.6 % Ext 30 5.47
Tea + 0.5 % Ext 30 5.47
Tea + 0.4 % Ext 30 6.07
Tea + 0.2 % Ext 30 6.10
Tea + 0.3 % Ext 30 6.27 6.27
Tea + 0.1 % Ext 30 6.30 6.30
Tea Control 30 6.63
Sig. 1.000 1.000 .317 .099
Means for groups in homogeneous subsets are displayed. Based on observed means.
44
Tests of Between-Subjects Effects
Dependent Variable:bitterness
Source
Type III Sum of
Squares df Mean Square F Sig.
Model 8336.133a 8 1042.017 1390.421 .000
sample 8336.133 8 1042.017 1390.421 .000
Error 173.867 232 .749
Total 8510.000 240
a. R Squared = .980 (Adjusted R Squared = .979)
bitterness
Duncana,,b
sample N
Subset
1 2 3
Tea + 0.7 % Ext 30 5.03
Tea + 0.6 % Ext 30 5.37 5.37
Tea + 0.5 % Ext 30 5.50
Tea + 0.4 % Ext 30 6.07
Tea Control 30 6.17
Tea + 0.2 % Ext 30 6.27
Tea + 0.3 % Ext 30 6.27
Tea + 0.1 % Ext 30 6.33
Sig. .137 .551 .297
Means for groups in homogeneous subsets are displayed. Based on observed means.
45
Tests of Between-Subjects Effects
Dependent Variable:taste
Source
Type III Sum of
Squares df Mean Square F Sig.
Model 8404.233a 8 1050.529 1479.199 .000
sample 8404.233 8 1050.529 1479.199 .000
Error 164.767 232 .710
Total 8569.000 240
a. R Squared = .981 (Adjusted R Squared = .980)
taste
Duncana,,b
sample N
Subset
1 2 3
Tea + 0.7 % Ext 30 5.07
Tea + 0.5 % Ext 30 5.33
Tea + 0.6 % Ext 30 5.47
Tea + 0.2 % Ext 30 6.07
Tea + 0.4 % Ext 30 6.10
Tea + 0.1 % Ext 30 6.23 6.23
Tea + 0.3 % Ext 30 6.27 6.27
Tea Control 30 6.63
Sig. .083 .410 .083
Means for groups in homogeneous subsets are displayed. Based on observed means.
46
Tests of Between-Subjects Effects
Dependent Variable:overall
Source
Type III Sum of
Squares df Mean Square F Sig.
Model 8336.900a 8 1042.113 1548.816 .000
sample 8336.900 8 1042.113 1548.816 .000
Error 156.100 232 .673
Total 8493.000 240
a. R Squared = .982 (Adjusted R Squared = .981)
overall
Duncana,,b
sample N
Subset
1 2 3 4
Tea + 0.7 % Ext 30 4.97
Tea + 0.5 % Ext 30 5.37 5.37
Tea + 0.6 % Ext 30 5.43
Tea + 0.2 % Ext 30 6.03
Tea + 0.4 % Ext 30 6.03
Tea + 0.3 % Ext 30 6.23 6.23
Tea + 0.1 % Ext 30 6.30 6.30
Tea Control 30 6.60
Sig. .060 .753 .257 .103
Means for groups in homogeneous subsets are displayed. Based on observed means.
47
Apendix 20. Statistical analysis of chemical analysis tea with extract and citric acid
Tests of Between-Subjects Effects
Dependent Variable:pH
Source
Type III Sum of
Squares df Mean Square F Sig.
Model 252.651a 5 50.530 445854.471 .000
sample 252.651 5 50.530 445854.471 .000
Error .001 10 .000
Total 252.652 15
a. R Squared = 1.000 (Adjusted R Squared = 1.000)
pH
Duncana,,b
sample N
Subset
1 2 3 4 5
Tea + Ext = 0.2 CA 3 2.7900
Tea + Ext + 0.1 CA 3 3.1200
Tea + Ext + 0.06 CA 3 3.5800
Tea + Ext 3 4.9467
Tea Control 3 5.4233
Sig. 1.000 1.000 1.000 1.000 1.000
Means for groups in homogeneous subsets are displayed. Based on observed means.
48
Tests of Between-Subjects Effects
Dependent Variable:TPC
Source
Type III Sum of
Squares df Mean Square F Sig.
Model 6115.155a 5 1223.031 22356.160 .000
sample 6115.155 5 1223.031 22356.160 .000
Error .547 10 .055
Total 6115.702 15
a. R Squared = 1.000 (Adjusted R Squared = 1.000)
TPC
Duncana,,b
sample N
Subset
1 2 3 4 5
Tea Control 3 13.6600
Tea + Ext 3 17.1867
Tea + Ext + 0.06 CA 3 20.0167
Tea + Ext + 0.1 CA 3 22.5133
Tea + Ext = 0.2 CA 3 25.4733
Sig. 1.000 1.000 1.000 1.000 1.000
Means for groups in homogeneous subsets are displayed. Based on observed means.
49 Tests of Between-Subjects Effects
Dependent Variable:DPPH
Source
Type III Sum of
Squares df Mean Square F Sig.
Model 2.256E10 5 4.512E9 2966.132 .000
sample 2.256E10 5 4.512E9 2966.132 .000
Error 1.521E7 10 1521298.067
Total 2.258E10 15
a. R Squared = .999 (Adjusted R Squared = .999)
DPPH
Duncana,,b
sample N
Subset
1 2 3 4 5
Tea Control 3 1608.67
Tea + Ext 3 14465.00
Tea + Ext + 0.06 CA 3 42470.33
Tea + Ext + 0.1 CA 3 46443.67
Tea + Ext = 0.2 CA 3 57862.33
Sig. 1.000 1.000 1.000 1.000 1.000
Means for groups in homogeneous subsets are displayed. Based on observed means.
50
Tests of Between-Subjects Effects
Dependent Variable:FRAP
Source
Type III Sum of
Squares df Mean Square F Sig.
Model 3.560E8 5 7.121E7 78678.975 .000
sample 3.560E8 5 7.121E7 78678.975 .000
Error 9050.459 10 905.046
Total 3.560E8 15
a. R Squared = 1.000 (Adjusted R Squared = 1.000)
FRAP
Duncana,,b
sample N
Subset
1 2 3 4 5
Tea Control 3 4137.7767
Tea + Ext 3 4562.2200
Tea + Ext + 0.06 CA
3 4840.0000
Tea + Ext + 0.1 CA 3 5004.4467
Tea + Ext = 0.2 CA 3 5681.1100
Sig. 1.000 1.000 1.000 1.000 1.000
Means for groups in homogeneous subsets are displayed. Based on observed means.
51 Apendix 21. Statistical analysis of sensory analysis tea with extract and citric acid
Tests of Between-Subjects Effects
Dependent Variable:color
Source
Type III Sum of
Squares df Mean Square F Sig.
Model 6863.467a 5 1372.693 685.087 .000
sample 6863.467 5 1372.693 685.087 .107
Error 290.533 145 2.004
Total 7154.000 150
a. R Squared = .959 (Adjusted R Squared = .958)
Tests of Between-Subjects Effects
Dependent Variable:teaflavor
Source
Type III Sum of
Squares df Mean Square F Sig.
Model 7064.833a 5 1412.967 839.100 .000
sample 7064.833 5 1412.967 839.100 .222
Error 244.167 145 1.684
Total 7309.000 150
a. R Squared = .967 (Adjusted R Squared = .965)
Tests of Between-Subjects Effects
Dependent Variable:aroma
Source
Type III Sum of
Squares df Mean Square F Sig.
Model 5807.033a 5 1161.407 637.974 .000
sample 5807.033 5 1161.407 637.974 .276
Error 263.967 145 1.820
Total 6071.000 150
52
Tests of Between-Subjects Effects
Dependent Variable:sweetness
Source
Type III Sum of
Squares df Mean Square F Sig.
Model 5943.533a 5 1188.707 407.991 .000
sample 5943.533 5 1188.707 407.991 .469
Error 422.467 145 2.914
Total 6366.000 150
a. R Squared = .934 (Adjusted R Squared = .931)
Tests of Between-Subjects Effects
Dependent Variable:sourness
Source
Type III Sum of
Squares df Mean Square F Sig.
Model 6032.067a 5 1206.413 462.859 .000
sample 6032.067 5 1206.413 462.859 .089
Error 377.933 145 2.606
Total 6410.000 150
a. R Squared = .941 (Adjusted R Squared = .939)
Tests of Between-Subjects Effects
Dependent Variable:bitterness
Source
Type III Sum of
Squares df Mean Square F Sig.
Model 6084.500a 5 1216.900 571.963 .000
sample 6084.500 5 1216.900 571.963 .278
Error 308.500 145 2.128
Total 6393.000 150
53
Tests of Between-Subjects Effects
Dependent Variable:taste
Source
Type III Sum of
Squares df Mean Square F Sig.
Model 6923.633a 5 1384.727 620.922 .000
sample 6923.633 5 1384.727 620.922 .652
Error 323.367 145 2.230
Total 7247.000 150
a. R Squared = .955 (Adjusted R Squared = .954)
Tests of Between-Subjects Effects
Dependent Variable:overall
Source
Type III Sum of
Squares df Mean Square F Sig.
Model 7224.767a 5 1444.953 747.656 .000
sample 7224.767 5 1444.953 747.656 .809
Error 280.233 145 1.933
Total 7505.000 150
54
AUTHOR BIOGRAPHY
Rufnia Ayu Afifah was born on 2nd July 1991 in Bogor, West Java, Indonesia. She is the first child with one brother from Mr. Muhammad Rufron M. B.E. and Mrs. Wartini, S.Pd. She studied her elementary school in SDN Lawanggitung 01 (1997-2000), SDN Merdeka 1 (2000-2003), junior high school in SMPN 4 Bogor (2003-2006), and senior high school in SMAN 5 Bogor (2006-2009). In 2009, she continued her further study in Bogor Agricultural University with Undangan Seleksi Masuk IPB (USMI) and she was accepted as Food Science and Technology student in the Faculty Agricultural Engineering and Technology. During her study, she joined some organization such as HIMITEPA (Himpunan Mahasiswa Ilmu dan Teknologi Pangan) and she was active in some activities such as LCTIP XVIII (2010), Baur (2011), HACCP IX (2009), ACCESS (2011), LCTIP XIX (2011), and IFOODEX (2012). She also was actived as laboratory assistant in Basic Chemistry and Sensory Evaluation Practice.
Gratefully, she got schoolarship during her study at Bogor Agricultural University. She was selected to be the Indonesian delegates for Credit Transfer AIMS (Asean International Mobility for Student) Exchange Program in Mae Fah Luang University, Chiang Rai, Thailand. She did her undergraduated research