Simposium NasionalTeknologi Terapan (SNTT)2 2014 ISSN:2339-028X
M-99
EXPERIMENTAL AND NUMERICAL ANALYSIS OF DUMMY NECK FOR CRASHWORTHINESS ASSESSMENT
Rakhmad A. Siregar1andShah F. Khan2 1
Mechanical Engineering Dept., UniversitasMuhammadiyah Sumatera Utara, Indonesia 2Mechanical Engineering Programme, University Malaysia Perlis, Malaysia
Email : [email protected]
Abstrak
This paper presents experimentaland numerical analysis of dummy neck forcrashworthiness assessment. The dummy neck was developed using flexible material, silicone rubber and rigid body material, mild steel. The design of the dummy neck is based on the measurement data on neck length and neck circumference that has been taken from Asia child and statistical analysis has been done to obtain the desired measurement. The dummy neck is connected with load cell at the upper and lower neck to simulate the force acting on child neck at C0 and C7 bone. Comparison has been made between the experimental and numerical simulation analysis for static load condition on dummy neck. Results from numerical simulation and experimental showed a good agreement.
Key words: neck injury, dummy neck design, static load test, hybrid III dummy neck model
1. Introduction
Approximately 500 000 people are killed and 20 million injured in vehicle crashes in the world every year. Among that numbers, 291 000 injuries were involved children between the ages 0 to 14 and 7810 were fatal crashes [1]. Neck injuries were one of the leading cause for most of the injuries in vehicles crashes throughout the world. A study led on real world frontal impacts show that the neck is the most currently injured anatomical segment other than head.
In a rear-end crash, even at low speed the head of the occupants of the struck vehicle normally suffers a motion related to the torso that produces sudden distortion of the neck. Although in the most severe cases this movement can produce the fracture of cervical vertebrae, the commonest related lesions are only classified as minor injuries. Nevertheless, these lesions, known as whiplash associated disorder (WAD) or simply whiplash, produce painful and often long term or even chronic symptoms.
During the last few years a certain number of experimental procedures have appeared trying to evaluate and understand neck injuries mechanism [2-4]. Even though several theories have been proposed, it is still difficult to accurately estimate and evaluate neck injuries. During time, many neck injury evaluations have appeared trying to evaluate many types of neck injury criteria and there’s still doubt which criteria should be used. As for this study, a static load experiment was performed in order to evaluate the stress, displacement and load acting on the neck during crash condition.
2. Design of Child Dummy Neck.
Simposium NasionalTeknologi Terapan (SNTT)2 2014 ISSN:2339-028X
M-100
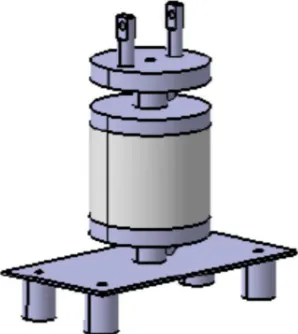
Figure 1, Assembly design of biofidelicdummy neck.
In the experimental part, biofidelic dummy neck is made as a silicone rubber column with the upper and lower end is attached with discs. The load cell is used to convert force applied to it into electrical signal and it placed at two places, on the upper neck and on the lower neck to measure the compression and tension load. At the center of the column there is as steel wire as reinforcement for the molded silicone rubber. Steel wire is used to retract back the biofidelic dummy neck during movement. At the top, mounting blocks were installed to attach the dummy neck and the head. Figure 2 shows the silicone rubber mold, rubber puck disc, mounting block and load cell used in developing biofidelic dummy neck.
Figure 2, Parts of biofidelic dummy neck (a) silicone rubber mold, (b) rubber puck disk, (c) steel wire, (d) load cell and (e) mounting block.
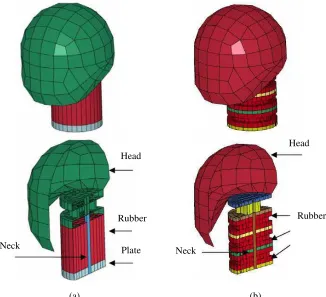
In the numerical analysis, the assembly drawing was converted as mesh with solid and shell elements. Two necks models were developed, single layer rubber neck (biofidelic) and multiple layer rubber neck (hybrid III). For hybrid III dummy neck, the rubber was stacked with steel and center of the neck, as for the single layer rubber neck, it consists of a single rubber. Most of the parts were meshed using solid except for the head. The head was assumed as a rigid material and meshed using shell element with 2mm of thickness. For biofidelic neck, it consists 282 of shell elements and 1350 of solid elements. As for the hybrid III neck, it consists 282 of shell elements and 1285 of solid elements. Both neck models use viscoelastic material properties for the silicon rubber. The mechanical properties of each component for both models are presented in Table 1.
(a) (b)
(c)
Simposium NasionalTeknologi Terapan (SNTT)2 2014 ISSN:2339-028X
M-101
Figure 3Finite element models of dummy neck, (a) biofidelic model, (b) hybrid III model.
3. Static Load Test
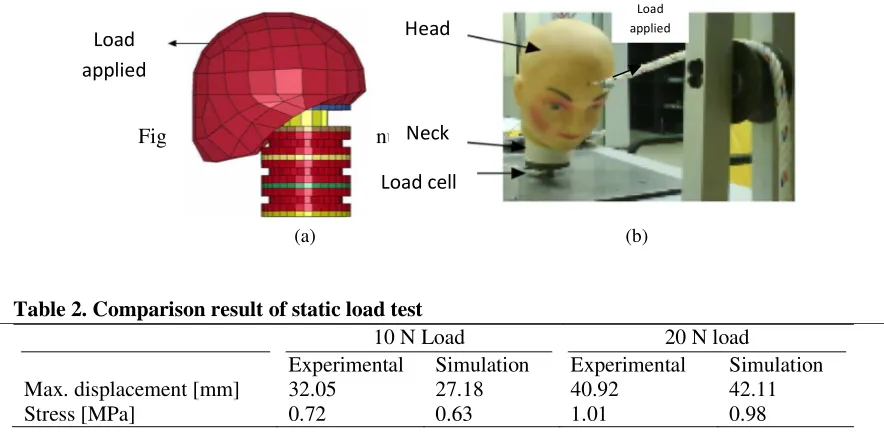
In static load test, a vertical load is applied at the forehead of the biofidelic dummy neck. Two different loads that have been used in this experiment which is 10 N and 20 N. The load will be release at 10 mm height to create a shock condition to the neck. By using LMS SCADAS Mobile as the DAQ, the tension and compression load during the experiment has been obtained.
The magnitude of tension load is measured from the upper neck load cell while themagnitude of compression load is measured from the lower neck load cell. In numerical simulation, the same condition is applied to verify the experimental result. The photograph of experiment setup and numerical simulation on static load condition is shown in Fig. 4.
Table 1 Mechanical properties of dummy neck for each component
Component E [GPa] Mass density [kg/mm3] Poisson’s ratio
Head 210 7.85x10⁻⁶ 0.3
Rubber 0.01 1.22x10⁻⁶ 0.48
Plate 210 7.85x10⁻⁶ 0.3
Neck center 0.01 1.22x10⁻⁶ 0.48
Rubber
Neck Neck
Head Head
Rubber
Plate
Simposium NasionalTeknologi Terapan (SNTT)2 2014 ISSN:2339-028X
M-102
Figure 4Static load test, (a) numerical model, (b) experimental setup.
Table 2. Comparison result of static load test
10 N Load 20 N load
Experimental Simulation Experimental Simulation Max. displacement [mm] 32.05 27.18 40.92 42.11
Stress [MPa] 0.72 0.63 1.01 0.98
4. Result and Discussion
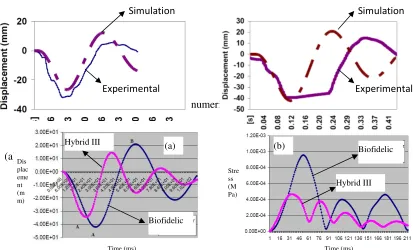
For biofidelic dummy neck, the summary of comparison result of experimental and numerical tests is shown in Table 2. The load cell response in the experimental test for 10 N and 20 N loads are shown in Fig. 5. The simulation and experimental data shows minimal variation value in maximum flexion and extension of the neck. The only variation is the time during transition from flexion to extension. These occur due to many factors in experimental setup such as the friction of the pulley, load sensor readings and other. Other than that, error from the simulation may also occur and the most common is the contact definition and the material properties inserted. A slight differ in these value can cause variation compared to the experimental result. In order to minimize all this error, every detail was inserted carefully in the simulation scheme and for the experimental setup, it was performed several times to confirm the result.
The numerical simulation is extended to observe the advantage of multiple layers in hybrid III neck model. The comparison of neck displacement between the hybrid III neck and biofidelic dummy neck for 20N applied load is presented in Fig. 6. Figure 6(a) shows that biofidelicneck gives more displacement which is 42.11 mm compared to the Hybrid III neck which gives 35 mm displacement. However, Hybrid III neck model oscillate morecompared to biofidelic neck. Peak A was the maximum flexion and peak B was the maximum extension of the neck. Stress occurred at the center of both neck
Head
Neck
Load cell Load
applied
Load applied
Simposium NasionalTeknologi Terapan (SNTT)2 2014 ISSN:2339-028X
M-103 was shown on Fig. 6(b).
Figure 5Static load test, (a) numerical model, (b) experimental setup.
Figure 6 Comparison between Biofidelic and Hybrid III model.
6. Conclusion
Biofidelic Dummy neck wassuccessfully developed and validated with two types of finite element neck models. In the experiment during static load the neck has givenoutput for maximum compression 142.1 N whilefor tension 10.8 N. The maximum tension isvery low it might be because of the design needto be revised. For the analysis both the experimental andnumerical displacements has beencompared. The result shows a good correlation between experimentaland numerical where the maximum displacementat each analysis closes to each other.
References
[1] George A. Peters and Barbara J. Peters, 2002, Automotive Vehicle Safety.
[2] Kathleen DeSantis, Roger A. Saul, GastonAuguste, Stanley Backaitis, MichealKleinberger 1996. Techniques ForDeveloping Child Dummy ProtectionReference Value.
[3] Rangarajan N, et al. 2002. design ofBiofidelic Instrumented 2.5kg InfantDummy.
[4] Y. Wang N., Rangarajan T Shams, GesacInc. United States, T. Fukuda, T. Yamada,Apprica Kansai Inc, Jenny BrownUniversity United States. Design ofBiofidelic Instrumented 3.4kg InfantDummy. [5] David Roylance, Finite Element Analysis, Department of Materials Science and Engineering,
Massachusetts Institute of Technology, Cambridge.
[6] Tso Liang Teng,Hung Wen Lan and Shu Ming Yang.Comparative study of finite element model of frontal impact dummy, Department of Mechanical and Automotive Engineering, Da Yeh University, Taiwan.
Experimental
(a) 10 N load (b) 20 N load
Simulation
Experimental Simulation
Biofidelic
Time (ms) Stre
ss (M Pa)
Time (ms) Dis
plac eme nt (m m)
(a) (b)
Hybrid III
Biofidelic