PROCEEDINGS OF
MALAYSIAN TECHNICAL
UNIVERSITIES INTERNATIONAL
CONFERENCE ON
834
Malaysian Technical Universities International Conference on Engineering & Technology (MUiCET 2011)
Finite Element Analysis of Plate Structure Excited
by Patches of Piezoelectric Actuators
Mohd Najib Ali Mokhtar1,, Fairul Azni Jafar1
1
Faculty of Manufacturing, UTEM
Email: [email protected]
Abstract
Active damping using piezoelectric element is one of the effective technique to counter vibration problems. A 3D finite element model is developed as part of investigation for active damping control. The piezoelectric are surface bonded with quadrilateral thin plate and supported with spring damper elements. This simulation project focuses on analysis of the piezoelectric actuators to achieve active damping on plate structure at low frequency spectrum. By numerical simulation the effect of the system in actuator mode at appropriate electric excitation from piezoelectric actuator are investigated. The force induced by piezoelectric actuator under certain applied voltage fields is used as load. Natural frequency of the system and corresponding mode shape are presented and the double symmetric mode shapes are examined. The result can be used as reference or validation of optimal locations and configuration of the piezoelectric patches for active damping control system.
Keywords:Finite Element, Active damping, Plate structure, Piezoelectric transducer.
1. INTRODUCTION
In many machinery and vehicle applications, vibration is unwanted and it can be controlled by creating a design that able to absorb structural vibration energy. Controlling vibration through passive absorbers is a continuous effort but it is usually designed for specific behavior and do not allow flexible adjustment of the parameter in order to achieve comfort and stability of operating conditions [1]. The conception of active vibration control systems was proposed over half a century ago but recent advantages in computer technology made it a practical solution to develop and analyze a system with the help of finite element software before full scale system of vibration control system is developed [2][3][4].
This study presents finite element analysis for thin plate structure excited by patch of piezoelectric transducer. FEM model is created to get the necessary knowledge of optimal location and configuration of piezoelectric actuators in the system at different frequencies. This is first step to develop active damping controlled system using offline approach.
2. FEMSYSTEMSIMULATION
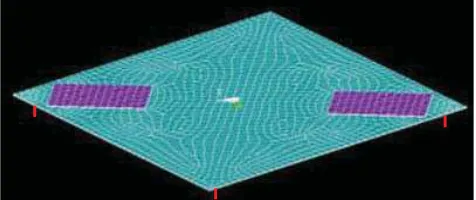
Simulation model consists of 200 mm x 200 mm rectangular steel plate of 0.5 mm thickness supported by polymer structure mounted on rectangular steel base plate. There are two piezoelectric patches of
thickness 0. 4 mm bonded on the top side of the plate with a 0.2 mm of adhesive layer.
Fig 1: Simulation Model using ANSYS 12.1
[Fig. 1] shows 3D simulation model built in ANSYS
12.1. In the simulation, a 3-D element ‘SOLED45’
with 3 degree of freedom and 8 nodes is used for modeling the plate structure and bonding layer. A
3-dimensional coupled field element ‘SOLED5’ with 8
nodes is used for modeling piezoelectric actuators. This element allows coupled DOF of displacement and voltage. The mass of mounting parts of the vibration motor and the sensors are considered as constant value acting at one node and it is represented by structural
point mass element ‘MASS 21’ with 3 degree of
freedom (Ux,Uy,Uz). The supports of the plate are
modeled by combination element ‘COMBIN14’ with a
Malaysian Technical Universities International Conference on Engineering & Technology (MUiCET 2011)
In this study, a quarter model is built for the analysis which means only the symmetry excitation are considered. Examples of symmetry excitation are the force excitation applied in the middle of the plate and voltage excitation applied on the piezo patch which is plane symmetry.
The analysis involved coupled electric-structural problem. The structural problem takes into account the vibration caused by energy transmitted from the piezoelectic patches. The electrical problem is caused by strong coupling effect between mechanical and
electrical quantities. For the analysis, DOF’s
displacement (Ux,Uy,Uz) for structural problem and volt(V) for electrical problem are used.
The behaviors of piezoelectric patches are studied by performing static analysis. The natural frequencies and the mode shapes of the plate structure are identified using modal analysis. Mode shape determines shape of vibration at particular natural frequencies. The overall vibration shape of a structure at finite frequency predominantly determine by it nearest natural
frequency of a mode. Therefore modal analysis can be used to validate the selected piezoelement
configuration. If all deflection shape is in the domain of influence of piezoelement, then the positions of piezoelements are validated. The area of influence of piezoelements on the structure can be identified using static analysis.
3. MATERIAL DATAANDEQUATION
The following equation describes the behavior of coupled electromechanical problem in the analysis. The value of stress and electric displacement depends on the stress and the electric field quantity in the system.
ሼሽ ൌElectric displacement vector (x, y, z)
ሼሽ ൌElectric field vector (three components x, y, z)
ሾሿ ൌStiffness matrix evaluated at constant electric
field
ሾሿ ൌPiezoelectric matrix related to stress over electric field.
ሾሿ୲= Piezoelectric matrix relating stress/electric field
(transposed).
ሾɂୱሿ ൌDielectric matrix evaluated at constant strain,
For piezoelectric element there are four important parameters describing the physical behavior which are
given by manufacturer’s data. There are density,
relative permittivity, piezoelectric matrix and stiffness matrix.
The piezoelement used for experiment and simulation is PIC252. The material coefficients for PIC252 are the same with PIC255. From
manufacturer’s supplied data, the coefficient given
need to be converted because ANSYS only accepted a certain form of input [5]. Only certain coefficient from
the manufacturer’s data will be used. The manufacturer’s data and the needed data for ANSYS
are presented below [6].
In ANSYS input form for stiffness matrix is:
Stiffness Matrix c
ሾሿ
Manufacturer’s data for stiffness matrix are :
ͳͳ ൌ ͳʹ͵ǤͲͲ
The symbol ‘E’ simply means the stiffness matrix was
measured under constant electric field.
ANSYS input form for permittivity matrix:
ǣ ൭ͻ͵ͲͲ ͻ͵ͲͲ ͲͲ
Ͳ Ͳ ͺͷ൱
Manufacturer’s data for permittivity matrix are:
ɂͳͳ ൌ ͻ͵Ͳ ɂ͵͵ ൌ ͺͷ
Symbol ‘Sr’ means permittivity is measured at constant strain.
836
Malaysian Technical Universities International Conference on Engineering & Technology (MUiCET 2011)
ǡ ୲ቂେ
Manufacturer’s data for piezoelectric matrix are:
͵ͳ ൌ െǤͳͷȀ ͵͵ ൌ ͳ͵ǤȀ ͳͷ ൌ ͳͳǤͻȀ
Unit [N/Vm] can be converted to [C/m²] and it will not affect the magnitude.
The density from manufacturer’s data needs no
conversion. Piezo ceramics density s given as
ɏ ൌ ͺͲͲȀͿ.
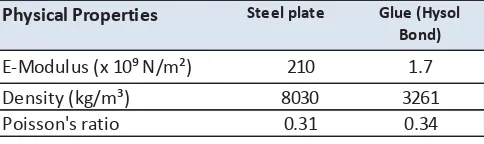
Table 3-1: Material properties for Steel Material and Hysol Bond
For a linear elastic calculation in ANSYS, E-modulus,
density and Poisson’s ratio of the steel plate and glue
are needed. The data are presented in Table 3-1.
4. RESULTS
Results of static analysis and modal analysis are presented. The static analysis is used to study behavior of system when voltage is applied as load on the piezoelectric elements.
The results from modal analysis represent all possible mode shape and natural frequencies of the structure. For validation of modal analysis in simulation, experimental analysis using sand was conducted. The sand is put on the plate and excited at different frequencies.
4.1 Static Analysis
To know the general behavior of piezoelectric element and how it will affect the system, static analysis is used. The static analysis is used to calculate the value of maximum deformation of the plate at different voltage excitations. The following figure shows the result of the static analysis at voltage excitation of 50 volts. At first 50 volts is applied at upper layer and the lower layer of piezoelement is set
to 0 volts. For the second analysis, upper layer is set to -50 volts.
At positive voltage [Fig 2: The left figure], the piezoelectric expands laterally. Since patch is bonded to the plate, it produced extension at the upper plate and compression at lower plate. The application of an electric field along the polarization direction make the patch expand in the perpendicular direction, thus producing a local strain on the patch and bend the plate upwards. Local maximum occur at area where the piezoelectric patch are bonded with the plate. It occurred at around the centre of the patch actuator at node 21416 and node 21417.
At negative voltage [Fig.2: The right figure], there is contraction at piezoelectric actuator and it worked vice versa. The application of electric field opposite to the polarization direction make the piezo actuator contract in the direction perpendicular to the electric field and bend the plate downward.
4.2 Natural Frequency and mode shapes
The method of extraction of the mode shape using ANSYS is modal analysis. The analysis will investigate natural frequencies and mode shapes of all possible excitations. For the analysis, frequency spectrum from zero to 500 Hertz is selected and the analysis results are presented. The mode shapes are then compared with experimental results. The experiments are conducted using sand which is placed on the vibration plate. The system is then excited at particular frequency and the shape of the sand after certain time is captured using camera.
The five first natural frequencies and its corresponding mode shapes are found and Fig.3-Fig.7 illustrated the natural frequencies of the system and the corresponding mode shapes during simulation and experimental results used to validate the results.
Physical Properties Steel plate Glue (Hysol Bond)
E-Modulus (x 10⁹ N/m²) 210 1.7
Density (kg/m³) 8030 3261
Poisson's ratio 0.31 0.34
Malaysian Technical Universities International Conference on Engineering & Technology (MUiCET 2011)
Fig 3: First mode shape from simulation and experiment
The system is excited using piezo patch with voltage excitation of 50V. The colours represent the magnitude in term of displacement. Red colour represents maximum position, blue colour represents minimum position and the green colour is the neutral position which is equivalent to no displacement. [Fig. 3] on the left side shows the first mode shape from both the simulation and experimental analysis. The right figure shows the shape of the sand recorded at 30Hz and 40Hz. At 37 Hz natural frequency occur and the corresponding figure shows that the centre of the plate moves downward whereas the four edges are in phase and move upward. As one can see, the green line has the shape with the sand form on the plate.
Fig 4: Mode shape at second natural frequency
[Fig. 4] illustrates the mode shape resulting from the force excitation from the vibration motor.
At second natural frequency, the centre plate moves to maximum point. All four side edges near tend to deform in upwards direction in phase. From simulation the second natural frequency of the system is found at 130Hz. The neutral line is a circle touching the upper side of the piezo patch. The sand form which are excited at frequency 132Hz also have the similar shape and therefore validate the mode shape.
Fig 5: Third natural frequency of the system
The third natural frequency is found when the piezo patch is supplied with 50V at frequency 165Hz. The sand form in [Fig. 5] which are excited at frequency 160Hz and 180Hz have similar shape with resulting neutral line from simulation analysis. The mode shape shows that edges at piezo patch side move to minimum point whereas the other two sides move to maximum points. No displacement line which is illustrated by green colour and sand form has a cross shape.
Fig 6: Forth natural frequency of the system
[Fig. 6] shows the forth natural frequency is found when the piezo patch is supplied with 50V at frequency 357Hz. On the right figure shows similar shape resulted from the experiment at exciting frequency of 350Hz. The mode shape shows that there are neutral line existed at sides of the plate and at the centre where the sensor are placed.
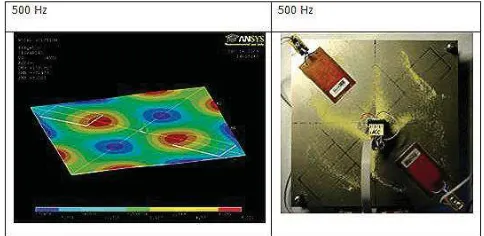
Fig 7: Mode shape at frequency of 500 Hz
838
Malaysian Technical Universities International Conference on Engineering & Technology (MUiCET 2011)
form resulted from the experiments validate the mode shape from simulation.
6. CONCLUSION
The results of static analysis reveal a general behavior of piezoelectric system when electrical excitation is applied. It is useful to understand the shape when load is applied and calculate the deformation of system regardless of frequency of excitation.
In the second analysis, the system operational frequencies are considered and using finite element software, modal analysis is conducted and results of all possible mode shape and natural frequencies of the structure at low frequency range are presented. The results which presented at Figure 3-7 show that the neutral displacement line was in the region of selected
position of piezoelectric membrane and therefore
verify the effective position to suppress the vibration at lower frequency range.
From the results it shows that experimental approach to determine mode shape at selected frequency agreed with results from simulation and therefore can be used for future study of offline identification approach in order to determine the transfer function of system, and hence development of classical PID controller for the system can be done. The controller can be used in active damping to control the noise vibration of the system.
ACKNOWLEDGMENT
The simulation and experiments was part of engineering project during study in Aachen University, Germany. The authors thank for the financial support from University Technical Malaysia Malacca throughout the study. Special gratitude to my supervisor Prof. Dr. Klaus-Peter Kämper and Prof.Dr.-Ing.Hans-Jürgen Raatchen. I am also very thankful to Oliver Pütsch, Mr.Ashkan Davanlao and Faisyal Sarifuddin.
REFERENCES
[1] Teixera,R.L., Lepore Neto, “Modeling and
experimental investigation of an active damper”,
Shock and Vibration, ISSN 1070-926/06-IOS Press, 2005.
[2] H. Karagülle,L Malgaca,H F Öktem, “Analysis of
active vibration control in smart structures by
ANSYS”, Institute of Physics, 2004.
[3] Mohammed W. Al Hazmi,“Finite Element
Analysis of cantilever structure excited by patches
of piezoelectric actuators”, IEEE, 2008.
[4] M.S. Kozien, B. Koltowski,”Comparison of active
and passive damping of plate vibration by
piezoelectric actuators-FEM Simulaton”, Acoustic
and Biomedical Engineering, Vol. 119 , 2011.
[5] ANSYS software manual, ANSYS 12.0, ANSYS
inc.
[6] Piezoceramic material data PIC 255, Physik