GOING PUBLIC IN INDONESIA STOCK EXCHANGE
ANALISIS KINERJA PERUSAHAAN SEBELUM DAN SESUDAH GO PUBLIC DI BURSA EFEK INDONESIA
THESIS
By:
Indri Puspa Linggarini 090810201046
MANAGEMENT DEPARTMENT FACULTY OF ECONOMICS
i
COMPANY PERFORMANCE ANALYSIS BEFORE AND
AFTER GOING PUBLIC IN INDONESIA STOCK
EXCHANGE
ANALISIS KINERJA PERUSAHAAN SEBELUM DAN SESUDAH GO PUBLIC DI BURSA EFEK INDONESIA
THESIS
A Thesis submitted in Partial Fulfillment of the Requirement for the Award of Economics Bachelor (Management)
By:
Indri Puspa Linggarini 090810201046
MANAGEMENT DEPARTMENT FACULTY OF ECONOMICS
ii Name : Indri Puspa Linggarini Identification Number : 090810201046
Department : Management
Program : Finance Management
Thesis Title : Company Performance Analysis before and after Going Public in Indonesia Stock Exchange.
Certify that this thesis does not incorporate, without acknowledgment, any material previously submitted for a diploma in any institution of higher education and that, to the best of my knowledge and belief, it does not contain any material previously published or written by another person except where due reference is made in the text. I am aware of the potential consequences of any breach of the procedures and guidelines, e.g. cancellation of my academic award.
Jember, June 2013
iii Name : Indri Puspa Linggarini Identification Number : 090810201046
Department : Management
Program : Finance Management Approval Date : 19 June 2013
Supervisor II Supervisor I
Dr. Elok Sri Utami, M.Si. Prof. Tatang A.G., M.Buss.Acc., Ph.D.
NIP 19641228 19900 2 001 NIP 19661125 199103 1 002
Ascertain,
Head of Management Department
iv This thesis is prepared and compiled by:
Name : Indri Puspa Linggarini Identification Number : 090810201046
Department : Management
It has been retained by the Examination Committe on the date: 27 June 2013
and declared to fulfill completeness requirements to be accepted as graduated at the Faculty of Economics, Jember University.
Team of Examiner:
1. The Chairperson : Dr. Nurhayati, M.M. : (...) NIP. 19610607 198702 2 001
2. The Secretary : Dr. Elok Sri Utami, M.Si. : (...) NIP. 19641228 199002 2 001
3. The Member : Prof. Tatang A.G., M.Buss.Acc., Ph.D. : (...) NIP. 19661125 199103 1 002
Ascertain, Jember University The Faculty of Economics
The Dean
v continued support.
2. My Sisters: Windy Era Pangesti, Stella Amalia and Roesya Rizkyanantha; for their presence and support.
3. Prof. Tatang A. Gumanti, M.Buss, Acc, Ph.D and Dr. Elok Sri Utami, M.Si for their courage, guidance, and advice in their capacity as supervisor.
vi
the time you have to spend, whether it’s at work or with your family. Every minute should be enjoyed and savored.
vii
Indri Puspa Linggarini
Management Department, Faculty of Economics, Jember University
ABSTRACT
This study aims to analyze the financial performances surrounding Initial Public Offerings/IPOs in Indonesia capital market. Empirical evidence seems to agree that most IPO firms are unable to improve financial performance after the IPO. A sample of 33 firms making IPO from 2007-2010 is examined. Market adjusted return instead of actual return is used to test for underpricing. This study employs the approach used in Jain and Kini (1994) in testing the performance of firms’ financial performance surrounding IPO year. Similar to previous studies, it is found that on average IPO firms are underpriced as much as 6.3 percent on the day of the issue. The figures are fluctuating for day 2 to day 5. Examination of firms’ financial performances, this study finds that all four proxies for financial performance measures tend to decrease after the IPO suggesting that the firms are unable to use the funds generated from the IPO for productive activities or it may take more years for the use of funds to take effect.
viii
Stock Exchange: Indri Puspa Linggarini, 090810201046; 2013; 38 pages; Management Department Faculty of Economics Jember University
There is significant information asymmetry between issuers and investor at the Initial Public Offerings (IPO). Some researchers stated that there was no news about issuing firms in the media until in the year of the issue. In the case of IPO’s, usually there is little information about the private firm that is available to the public. Investors have to rely primarily on the financial statements in the offering prospects, which gives the issuers and the underwriters could be incentive to report favorable accounting numbers. This leads to the thought that issuing firms gain improvements in profitability after the offering. Therefore, it is necessary to analyze the stock performance and the company’s operating performance before and after going public in order to know whether going public is an interesting issue to investors and whether going public could increase the company’s operating performance.
The study uses secondary data from financial report and the offering price of the company making IPO for the period 2007-2010. Stock perfomance of the firms making IPO can be calculated by abnormal returns. Abnormal return is measured as the difference between actual return and expected return. Expected return is measured using market return on the corresponding day. Operating performance is measured using four variables, namely operating return on assets, operating cash flow to total assets, sales growth and total assets turnover. The results show that all of the abnormal returns have positive value on the days surrounding the IPO. It can be concluded that the investors have positive response to IPO firms in Indonesia Stock Exchange. Relatively similar patterns are found for actual return. The lowest average actual return is found in day one of trading. The highest is recorded in day five of trading. Overall, the abnormal return is different from zero. It shows that H0 is rejected; it means there are significant
abnormal returns on the IPO dates. Thus, the first alternative hypothesis (Ha1) that
ix
for all of his gift so I can finish my thesis entitled “Company Performance Analysis before and after Going Public in Indonesia Stock Exchange”.
I would like to express my deepest appreciation and sincerest thanks to the following people:
1. The Dean of the Faculty of Economics, Jember University, 2. The Chairperson of the Management Department,
3. My first consultant, Prof. Tatang A. Gumanti, M.Buss, Acc, Ph.D and my second consultant, Dr. Elok Sri Utami, M.Si for the guidance and valuable suggestions that helped me compile and finish my thesis.
4. The examination committee.
5. The lecturers who have taught and given me a lot of knowledge.
6. My family, and all my friends in boarding house and in International Class, thank you for your support.
Finally, I hope this thesis will provide some advantages to the readers. Any criticism, suggestions, and input will be appreciated to make this thesis better.
Jember, June 2013
x
TITLE PAGE... i
STATEMENT OF THESIS AUTHENTICITY... ii
CONSULTANT’S APPROVAL ... iii
APPROVAL OF THE EXAMINATION COMMITTE... iv
DEDICATION ... v
MOTTO ... vi
ABSTRACT ... vii
SUMMARY... viii
ACKNOWLEDGMENT... ix
TABLE OF CONTENTS ... x
LIST OF TABLES ... xiii
LIST OF FIGURES ... xiv
LIST OF APPENDICES ... xv
CHAPTER I. INTRODUCTION ... 1
1.1 Background of the Problems ... 1
1.2 Formulation of the Problems... 4
1.3 Research Objectives ... 4
1.4 Research Benefits ... 5
CHAPTER II. LITERATURE REVIEW ... 6
2.1 Theorotical Stances ... 6
2.1.1 Initial Public Offerings ... 6
2.1.2 Abnormal Return... 7
xi
2.1.4 The Relationship between Initial Public Offerings and Operating
Performance... 9
2.2 Previous Research... 9
2.3 Conceptual Framework ... 11
2.4 Hypotheses... 12
2.4.1 Abnormal Return of IPO Firms ... 12
2.4.2 Operating Performance of IPO Firms ... 13
CHAPTER III. RESEARCH METHODS ... 16
3.1 Research Design ... 16
3.2 Population adn Sample ... 16
3.3 Types and Sources of Data... 16
3.4 Operational Definition of Variables ... 16
3.4.1 Abnormal Return... 16
3.4.2 Operating Performance... 17
3.5 Data Analysis Methods ... 18
3.5.1 Data Normality Test ... 18
3.5.2 Hypotheses Test ... 19
3.6 Framework for Problem Solving... 21
CHAPTER IV. FINDINGS AND DISCUSSIONS... 23
4.1 Description of Sample ... 23
4.2 Results of Data Analysis ... 24
4.2.1 Descriptive Statistics of Abnormal Return... 24
4.2.2 Descriptive Statistics of Operating Performance Ratios ... 25
xii
4.2.4 Abnormal Return Test ... 29
4.2.5 Operating Performance Ratios Test ... 30
4.3 Discussions... 32
CHAPTER V. CONCLUSIONS AND SUGGESTIONS... 37
5.1 Conclusions ... 37
5.2 Suggestions ... 37
REFFERENCE
xiii
Table 4.1 Sample selection process ... 23
Table 4.2 Distribution of sample firm based on years sector... 24
Table 4.3 Descriptive statistics of abnormal return and actual return ... 25
Table 4.4 Descriptive statistics of operating performance ratios ... 26
Table 4.5 Data normality test results of Abnormal return and actual return... 27
Table 4.6 Normality test results of operating performance ratios ... 28
Table 4.7 Mean and median test of abnormal return and actual return ... 29
Table 4.8 Distribution data at each time of testing... 30
xiv
xv
Appendix 2 Research samples of firms making IPO in period 2007-2010 Appendix 3 Data normality test of abnormal return
Appendix 4 Wilcoxon one sample test results of abnormal return Appendix 5 Data normality test of actual return
Appendix 6 Wilcoxon one sample test results of actual return Appendix 7 data normality test of operating performance ratios Appendix 8 Paired sample t-test of operating performance ratios
1
A company is to become a public company when the company has made the process of an initial public offering (IPO). The definition of a public company is a company that sells some of its shares to the public, to be owned by the public. The process of becoming a public company is usually preceded by the activities of offering shares to the public / community for the first time via the stock exchange or mostly called IPO (Ang, 1997).
The main reason of a company to become a public company by selling shares in the stock market is that there is a need of capital used to support the operational activities. In individual companies, usually the owners of capital consist only for some few investors / owners. Additional funding by new investors will not necessarily increase the liquidity holdings directly. In its development, when the companies become larger and increasingly require additional capital to meet its operational improvement, then selling shares is one option (Gumanti, 2002). But the decision to go public is a complex as it will bring up the loss and the new cost (Gumanti, 2002; Midiastuti and Elias, 2004), so it will certainly affect the financial performance of the company.
issuer to the investor during the time set by the issuer before the share are trade in the secondary market. Stock prices in the first offer market is determined by the underwriters and the IPO firms in company fundamental analysis. In the first offers market, the company will obtain the necessary of funds. The Company may use the proceeds from the issuance to develop and expand the capital goods to produce goods and services.
Going public company usually causes of significant changes in the ownership structure of the company. Decrease level of management ownership is one of the results for going public likely to lead the agency problem described by Jensen and Meckling (1976). Therefore, there will be need management change initiatives in companies that have a different or new shareholder.
Performance appraisal is very important, because with the right knowledge about the performance of a company, public company, investors and interested parties will be able to suppress the possibility of errors in decision-making. Performance assessment is important for variants parties, such as management of the company, shareholders, regulators, because it involves the distribution of wealth between them. While operating performance reflects the company's ability to generate profits in the short term that can be measured using the company fundamental data, i.e. data derived from the financial statements of the company.
Researchers investigated the changes in the company's operating performance as they make the transition from closed to open for ownership of the company through an IPO. Although some recent studies investigating the performance of the company's IPO, while generally focuses on the performance of the post-issue share price. Researchers found that the company's IPO shows its post-issue operating performance, as measured by operating return on assets and net operating cash flow to assets, relative to their pre-IPO levels, both before and after adjustment of the industry.
Jain and Kini (1994) examine 682 companies doing IPO’s in the period from 1976 to 1988 at the New York Stock Exchange. This research finds that IPO firms exhibit a decline in post-issue operating performance, as measured by the operating return on asset and operating cash flows deflated by assets, relative to their pre-IPO levels, both before and after industry adjustment. Thus, the declining operating performance of IPO firms can not be attributed to a lack of sales growth opportunities or cutbacks in post-IPO capital expenditure. Furthermore, they examine that the declining operating performance is the effect from the management efforts to show the better financial performance in the period before IPO. The implication of that statement can be interpreted as an earnings management. Earnings management is defined as companies that use the accounting policies to raise profit in order to impress investors that companies have good financial performance.
1.2Formulation of the Problems
There is a significant information asymmetry between issuers and investor at the IPO. Rao (1993) stated that there was no news about issuing firms in the media until one year before the issue date. In the case of IPO’s, usually there is little information about the private firm that is available to the public. Investor has to rely primarily on the financial statements in the prospectus, which it gives the issuers and the underwriters can incentive to report favorable accounting numbers. This leads to the IPO firms have to improve in profitability after the offering. Therefore, it is necessary to analyze the stock performance and the company’s operating performance before and after going public in order to know whether going public is an interest issue to investors and whether going public could increase the company’s operating performance. Results of these comparisons can evaluate the success of the company after going public.
Based on the description above, the research problems are: a. Is there any abnormal return after going public?
b. Are operating performance ratios covering operating return on assets, operating cash flow on total assets, sales growth, and company total asset turnover improving after going public?
1.3 Research Objectives
Based on the formulation of the problem, the objectives of this research are:
a. To examine whether there is abnormal return after going public.
1.4 Research Benefits
Research on company performance analysis before and after going public in Indonesia stock exchange is expected to provide some benefits to some parties, namely the next researcher and investor.
a. For the investor
This study is expected to be an input and information to investor in order to build a strategy and investment decisions by the company making IPO. b. For the next researcher
6 CHAPTER II
LITERATURE REVIEW
2.1 Theoretical Stances
2.1.1 Initial Public Offerings
IPO’s can be done after the company obtaining permission from the Indonesia Capital Market Regulatory Agency (BAPEPAM-LK) to give regulation procedures to the company when the securities are not traded yet on stock exchange (Hartono and Ali, 2002). Before the issuers conduct a public offering, the companies have to publish a prospectus. Prospectus is a document of the company that will do the IPO containing accounting measures in the form of financial statements that have been audited which will be a main source of information for investors (Hartono and Ali, 2002). Prospectus also provides information about the condition of the company for investors. With that information, investors can know the future prospects of the company, so it is possible interested for buying securities published by issuers (Ang, 1997; Hartanto and Ediningsih, 2004).
There has been mounting evidence asserting that on average IPO is underpriced (Ibbotson et al. 1988; Ibbotson and Ritter 1994; Ritter 1998). Underpricing is said to be one of three anomalies in the IPO market. The level of underpricing varies between countries where it is relatively higher in emerging markets but lower among developed markets.
2.1.2 Abnormal Return
Gumanti (2011:157) explained that the abnormal return is the difference between the actual return and expected return. Abnormal return will be positive if the returns obtained by investors are greater than the expected returns. On the other hand, if the returns obtained by investors are less than the expected returns, the abnormal returns will be negative. Abnormal return is used to test the stock market reaction to an event that occurred. IPO firm can be seen from the significant abnormal return around the IPO date.
If an event has the information, the stock market will react and indicated by the change in stock prices. Stock returns is sum of the income plus capital gain or capital loss on the investment of investors obtained by assets or securities (Gumanti, 2011:54). Then, market returns is the rate of profit market which is a reflection of the market’s gain in the form of changes to market index. Market index used is the stock price index expressed as a percentage and calculated daily by the ratio scale (Gumanti, 2011:56). Furthermore, there some models that can be used to calculate the expected return, such as single index model and the capital asset pricing model.
2.1.3 Operating Performance
According to the theory of modern financial, management decisions intend to increase shareholder wealth and enhance the value of the company’s performance (Sudarsanam, 1999:246). In this case, the companies’ first stock offering is part of the management decisions that need to be proven success in achieving that goal.
a. Operating Return On Assets
The rate of return on operating assets is the ratio of operating income to total assets. The rate of return on assets is defined as operating income results reflect the operations of the investment rate of return of the total investment in the company (Sutrisno, 2012).
Operating profit is the difference between the net sales and cost of goods sold plus expenses before depreciation or amortization. Operating profit is derived from the income statement. Total assets are the sum of an item or property owned by a company that has a money value reflected in the balance sheet of the firms. The greater rate return on assets can indicate that the company is able to demonstrate an increase in the efficiency of the company's assets. It can be also used to generate an operating profit that can diminish the ability of the company to manage the assets.
b. Operating Cash Flow to Total Assets
The cash flow to total assets measures the cash flows generated by the firm’s assets. A healthy firm would be expected to generate positive cash flow. To calculate operating cash flow to total assets, divide the firms cash flow from operations by its total assets. If the firms have a high cash flow, the firm are generating a higher return on your assets than similar sized companies. If the firms have a low cash flow, the firms generating a lower return on its assets than other firms that indicating inefficiencies in the firms operations.
c. Sales Growth
d. Total Assets Turnover
This is a financial ratio that measures the efficiency of company’s use of its assets in generating sales income to the company. If the total assets turnover is high compared to other firms. It can be indicate that you are using not too many assets to generate sales. Yet, if the firms have a low total assets turnover. It indicate that capital is invested in too many assets in relation to what they need.
2.1.4 The Relationship between Initial Public Offerings and Operating Performance
Operating performance ratios can determine the operating performance of the company after the IPO. Basically, IPO is conducted to get additional funds from the public. Going public typically leads to a significant change in the company’s ownership structure. The reduction in management ownership level is a result of going public likely to lead to the agency problem described by Jensen and Meckling (1976). Jain and Kini (1994) suggest that firm tend to use opportunity as well as the market timing hypotheses making firm performance tend to explain decline after the offering.
2.2 Previous Research
management company use accounting policies to increase earning reported as an effort to demonstrate to investor that the company has good financial performance.
Kurtaran and Er (2008) investigate 205 firms went public in the period 1999-2000 in Istanbul Stock Exchange. The findings for the operating performances in this research were tested with respect to both the post-issue management ownership and the underpricing level. They use six variables as measures of operating performance, such as operating return on assets, operating profit deflated by total assets at the end of fiscal year, profit margin, equity capital turnover, asset turnover and operating cash flow to total assets. Using a number of operating performance measures, they compared the performances for three years after the IPO relative to pre-IPO year. They found some significant declines in the post-issue operating performances. Overall, they come up with a result that the Turkish IPO firms did not sustain their pre-IPO performances. There are some increases in sales numbers and capital expenditures number after the IPO year in comparison to pre-IPO level while there are some decreases in profitability level after the IPO. However, investors appear to value firms going public based on their pre-IPO performance level. While in fact, the pre-IPO performance levels can not formed expectations to investor.
Gumanti and Alkaf (2011) investigate 85 firms making IPO and SEO in the period 1990-2006 in Indonesia Stock Exchange. This objective research is to test the signaling theory, whether underpricing can give signal on the company making SEO. The measures of this research are using two standards, such as raw initial return and market adjusted initial return. In consistently, the results showed that on average of IPO firms is underpricing as big as 22.35%, while at SEO, the level of underpricing is 13.35%. The underpricing level during IPO and SEO are not statistically different. The company with the underpricing higher level during IPO will lower as much as the company during SEO. Overall, the results support the signaling theory has not been successful in the IPO.
other generally found that there is a declining in the operating performance in the period after the company’s IPO. The company’s inability to maintain the operating performance achieved in the period before the IPO is likely caused by the actions that lead to improved profitability.
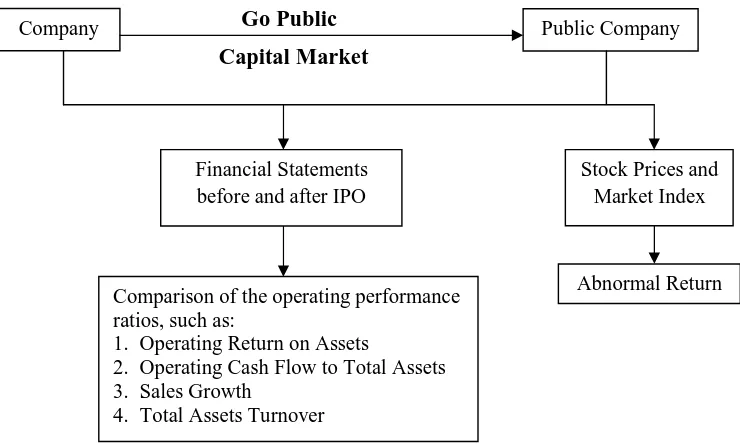
2.3 Conceptual Framework
Based on the theoretical study shown previously, it can be described in the conceptual framework of this study is as follows.
Go Public
Capital Market
Figure 2.1 Conceptual Framework
In conducting business, the company will need funds. One alternative that can be selected by the company to meet the needs of their funds is by going public or making an initial public offering through the stock market. This needs to be done to get conclusions about the condition of the company before and after going public.
Operating performance would indicate that the company's market performance can be measured by reviewing the company's stock price in the capital market. Through the stock price and the market index can be calculated abnormal return when the company is going public. Operating performance of the company after going public is expected to be better than the operating
Comparison of the operating performance ratios, such as:
1. Operating Return on Assets
2. Operating Cash Flow to Total Assets 3. Sales Growth
performance when the company do the first offering because the company has secured additional capital from IPO activity.
To analyze the operating performance, this study uses operating performance ratios covering operating return on assets, operating cash flow over total assets, sales growth, and total asset turnover. From these ratios it can be compared the performance to determine if there are differences between the company's operating performance before and after the IPO/go public. Then it can be concluded whether the operating performance is steady, improving or decreasing.
The results of the company's operating performance comparisons before and after going public would be very important information for the capital market. It can be used as one of considerations in determining the strategy of investing in the stocks of IPO firms.
2.4 Hypotheses
2.4.1 Abnormal Return of IPO Firms
This offering price of shares in the primary market is the result of an agreement between the issuer to underwriter. After the initial offering, the stock traded in the secondary market where stock prices are determined by the strength of supply and demand of shares. The percentage difference between the stock prices on the secondary market compared to the price of the stock at the initial offering to the size of the initial return. If the stock price in the secondary market on the first day of stock trading is significantly higher than the offering stock price in the primary market is suffered by underpricing (Helen Sulistio, 2005)
time, with the expectation that a liquid market will developed. This means that on average investors who bought the shares in the initial/primary market will be received positive return. This evidence is found in all capital markets in the world including Indonesia.
Based on the literature review, the hypothesis proposed in this study is: Ha1 : There is positive abnormal return on IPO date.
2.4.2 Operating Performance of IPO Firms
Firms making IPO will generate substantial funds and use that for various purposes such as long-term capital, company expansion and pay off debts. Jain and Kini (1994) argue that private firm that goes public results in the dilution of entrepreneur’s ownership interest. They use operating performance ratios to measure the post-IPO performance. They found that operating return on assets and operating cash flow to total assets after IPO decreasing. However, sales growth and capital expenditure after the company making IPO have increasing relatively.
Operating performance ratios can determine the operating performance of the company after the IPO. Basically, IPO is conducted to get additional funds from the public. Going public typically leads to a significant change in the company’s ownership structure. The reduction in management ownership level is a result of going public likely to lead to the agency problem described by Jensen and Meckling (1976). Jain and Kini (1994) suggest that firm tend to use windows of opportunity as well as the market timing hypotheses making firm performance tend to explain decline after the offering.
in the period before the IPO. They suspect that the practice of earnings management in the period before the IPO is one cause of the inability of the company to maintain operating performance after the IPO. It means the management company use accounting policies to increase earning reported as an effort to demonstrate to investor that the company has good financial performance.
Mikkelson et al. (1997) examine firms going public during the years 1980 to 1983, and found that the post-IPO decline in operating performance is unrelated to managerial ownership. Instead, they find that the variation in operating performance after going public is explained mostly by the size and age of the firms. In other word, funds generated from IPO shall be used to productive positive activity.
Other studies seem to agree that IPO firms are unable to improve or even maintain their financial performances after the issue. Evidence in other emerging countries support this contention. For example, in China (Wang 2005), in Malaysia (Ahmad 2011), in Turkey (Kurtaran and Er 2008), all report the IPO firms’ inability in maintaining their financial performance. Exception of previous study is Zuobao et al. (2003) who document improvement of financial performance among privatized firms in China.
Operating performance would indicate that the company's market performance can be measured by reviewing the company's stock price in the capital market. Through the stock price and the market index can be calculated abnormal return when the company is going public. Operating performance of the company after going public is expected to be better than the operating performance when the company do the first offering because the company has secured additional capital from IPO activity.
fund to be used for various purposes with intention to improve their financial performances. Investors would not believe that they will be fooled by mangement where the money from IPO is not used for productive activities in order to strengthen and enlarge the firm.
Based on the literature review, the hypotheses proposed in this study are: Ha2 : The operating return on assets of the company after going public is higher
than before going public.
Ha3 : The operating cash flow to total assets after going public is higher than
before going public.
Ha4 : Sales Growth of the company after going public is higher than before
going public.
Ha5 : Total asset Turnover Company after going public is higher than before
16
This study examines the operating performance before and after going public in Indonesia Stock Exchange (IDX) for the period 2007-2010 and this is a research-based hypothesis testing. This study uses secondary data from the IDX.
3.2 Population and Sample
The population in this study will be all companies making IPO at IDX for the period 2007-2010. Sampling technique is the purposive sampling with the following criteria:
a. The firm must be listed on stock exchange to make sure the availability of prospectus and financial report for the purpose of analysis.
b. The Financial reports have to show in Rupiahs. It makes easier to calculate operating performance ratios of the IPO firms.
c. The firm that listing on Stock Exchange not do the right issue and relisting. d. Availability the sector stock price index on IPO firms.
e. The firms are not in financial sectors.
3.3 Types and Sources of Data
The study uses secondary data from financial report of the period 2007-2012 and the offering price of the company making IPO for the period 2007-2010. The data are obtained from the IDX website like www.idx.co.id. Company’s stock price movement of data sample and stock price index (IHSS) are obtained through the site www.finance.yahoo.com.
3.4 Operational Definition of Variables
3.4.1 Abnormal Return
the expected return of the investors. Given no data on previous trading of shares, in this study market return is used as proxy for expected return. The steps used in calculating abnormal return are as follows.
a. Abnormal Return (ARit)
ARit = Rit – Rmt
Where;
ARit = abnormal return of stock i at period t
Rit = Stock return i at period t
Rmt = market return of stock i at period t
b. Stock Return (Rit)
Rit =
Where;
Rit = Stock return i at period t
Pt = Stock price i at period t
Pt-1 = Stock price i at period t-1
c. Market Return (Rmt)
Rmt =
Where;
Rmt = Market return at period t
IHSSt = Sectoral Stock price index at period t
IHSSt-1 = Sectoral Stock price index at period t-1
3.4.2 Operating Performance
a. Operating Return on Assets Operating return on assets = Where;
Operating incomeit = operating income of stock i at period t
Total assetit =total asset of stock i at period t
b. Operating Cash Flow to Total Assets Operating Cash Flow to Total Assets = Where;
Operating cash flowit = operating cash flow of stock i at period t
Total assetit =Total asset of stock i at period t
c. Sales Growth Sales growth
=
Where;Sit = net sales i at period t
Sit-1 =net sales i at period t-1
d. Total Assets Turnover Total asset turnover
=
Where;
Net Salesit = net sales of stock i at period t
Total Assetit =total asset of stock i at period t
3.5 Data Analysis Methods
3.5.1 Data Normality Test
a. Formulate Hypotheses
H0 : the data are normally distributed
Ha : the data are not normally distributed
b. Determine level of significance (α)
The significance levels used in this study are 1%, 5%, and 10%. c. Testing Criteria
H0 will be accepted if p-value > α
H0 will be rejected if p-value < α
d. Draw Conclusion.
If p-value > α, the distribution of data is normal. If p-value < α, the distribution of data is not normal. 3.5.2 Hypotheses Tests
The test of hypotheses are organized as follows. a. Abnormal Return Test
1) One Sample T-test and One Sample Wilcoxon Test
One sample T-test is used when the distribution of the data is normal, while one sample Wilcoxon Test is used when the distribution of the data is not normal. The steps for the test are as follows:
a) Formulate Hypotheses
H01 : ARit = 0, there is no abnormal return on IPO date
Ha1 : ARit ≠ 0, there is abnormal return on IPO date.
b) Determine Level of Significance
The significance level used in this study is 1%, 5%, and 10%. c) Testing Criteria
Hypothesis test is using one tailed test. The criteria are: H0 will be accepted if p-value > α
H0 will be rejected if p-value < α
d) Draw Conclusion
2) Paired Samples Wilcoxon Test and Paired samples T-test.
Paired samples T-test is used when the distribution of the data is normal, while paired samples Wilcoxon Test is used when the distribution of the data is not normal. The steps to test as follows:
a) Formulate Hypotheses
H02 : The operating return on assets after going public is lower or equal
than before going public.
Ha2 : The operating return on assets after going public is higher than
before going public.
H03 : The operating cash flow to total assets after going public is lower or
equal than before going public.
Ha3 : The operating cash flow to total assets after going public is higher
than before going public.
H04 : Sales Growth after going public is lower or equal than before going
public.
Ha4 : Sales Growth after going public is higher than before going public.
H05 : Total assets turnover after going public is lower or equal than before
going public.
Ha5 : Total asset turnover after going public is higher than before going
public.
b) Determine Level of Significance
The significance level used in this study is 5% (α=5%). c) Testing Criteria
Hypothesis test is using one tailed test. The criteria are: H0 will be accepted if p-value > α
H0 will be rejected if p-value < α
d) Draw Conclusion
(2)If p-value < α, the operating return on assets, the operating cash flow to total assets, sales growth, and total assets turnover after going public is higher than before going public.
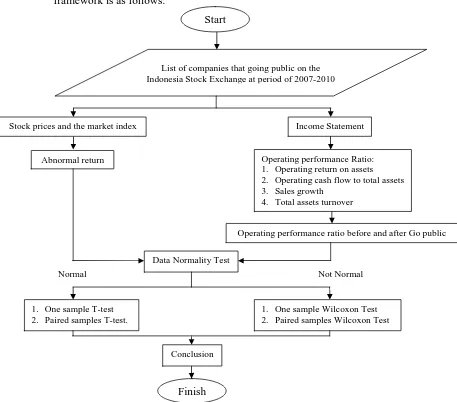
3.6 Framework for Problem Solving
Based on the data analysis methods and data analysis, the problem solving framework is as follows:
Figure 3.1 Frameworks for Problem Solving Start
List of companies that going public on the Indonesia Stock Exchange at period of 2007-2010
Income Statement
Operating performance Ratio: 1. Operating return on assets 2. Operating cash flow to total assets 3. Sales growth
4. Total assets turnover
Operating performance ratio before and after Go public
Conclusion
1. One sample Wilcoxon Test 2. Paired samples Wilcoxon Test 1. One sample T-test
2. Paired samples T-test.
Data Normality Test Abnormal return
Finish
Stock prices and the market index
Based on research methods and data analysis, the descriptions of framework for problem solving that can be presented are;
1. Start.
2. The study will begin by collecting data of the company that conducted an IPO in 2007-2010 in Indonesia Stock Exchange.
3. The next data will needed is the price offered at the time of initial public offering and the next few days in Indonesia Stock Exchange, as well as the company's financial report before and after the IPO in the period 2007-2012. The data will get from Prospectus.
4. Stock price data is needed to calculate the stock return, and then the stock price index gained to calculate market return. From that calculation, we can calculate and getting the expected return E (Rit) and abnormal return (ARit).
Furthermore, financial report will be separated by the time before and after IPO, and then calculated using the operating performance ratios in accordance with the formula described earlier.
5. Financial statement data are obtained first separated according the period before going public financial statements and financial statement after go public later financial ratios calculated using operating performance in accordance with the formula described earlier.
6. There will be known abnormal stock returns and operating performance ratios before and after going public.
7. After all, researcher will test the data whether the data is normally distributed or not. Abnormal return and operating performance ratios will be tested using Shapiro-Wilk. If the abnormal returns are normally distributed, the research hypothesis test will use one-sample t-test and paired samples t-test. But if the abnormal returns are not normally distributed, the hypotheses tests will use one-sample Wilcoxon test and paired samples Wilcoxon test.
8. Based on the result, it can be drawn the conclusion and solve the problem.
23
The population of this study is all firms making IPO in Indonesian Stock Exchange for period 2007-2010. There are 77 firms, of which 22 firms making IPO in 2007, 19 firms in 2008, 13 firms in 2009 and 23 firms making IPO in 2010. Data on population of study are shown in Appendix 1.
The sample of this study is determined using purposive sampling methods. Table 4.1 shows the process of sample selection of which the final and usable sample consists of 33 firms representing about 45 percent of population. This study is unable to obtain prospectuses of the firm as they are not available in the IDX website.
Table 4.1 Sample Selection Process
No. Description Number of
Firms
1 The number of IPO firms in Indonesia Stock Exchange at period 2007-2010
77 2 The firms are unable for prospectus and financial report data 26 3 The firm is doing Right Issue 1
4 The firm is relisting 1
5 The firms have financial report in Dollars 6 6 The firms have incomplete stock price data 4 7 The firms are in financial sectors 6
8 Final Sample 33
excluded, namely financial sector as it different characteristics in terms of assessment based on accounting numbers.
Table 4.2 Distribution of Sample Firm Based on Years Sector (n=33)
Panel A : Based on IPO years
Year Population Samples %
2007 22 14 64
2008 19 12 63
2009 13 3 23
2010 23 4 17
2007-2010 77 33 43
Panel B : Based on Sector
Sector Population Sample %
Agriculture 4 4 100
Mining 11 2 18
Basic Industry and Chemicals 8 4 50 Miscellaneous Industry 1 1 100 Consumer Goods Industry 2 1 50 Property, Real Estate and Building Construction 15 11 73 Infrastructure, Utilities & Transportation 10 4 40
Finance 9 - -
Trade, Services & Investment 17 6 35
Total 77 33 43
4.2 Results of Data Analysis
4.2.1 Descriptive Statistics of Abnormal Return
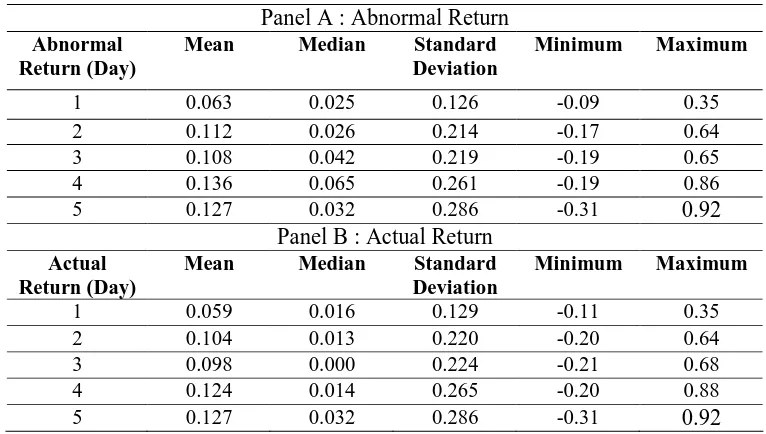
Table 4.3 Descriptive Statistics of Abnormal Return and Actual Return
Panel A : Abnormal Return Abnormal
Return (Day)
Mean Median Standard
Deviation
Mean Median Standard
Deviation Source: Appendix 3 and 4
Table 4.3 indicates that the highest mean of abnormal return is 13.6% on the 4th trading day. The mean abnormal return on IPO date is lower than the other days after IPO. The mean abnormal return of first trading day is 6.3%. The all median of abnormal return have positive value. The highest median value is recorded in day 4(6.5%), whilst the lowest is recorded in day one of being a public corporation.
On average, all of the abnormal returns have positive value on the days surrounding the IPO. It can be concluded that the investors have positive response to IPO firms in Indonesia Stock Exchange.
Relatively similar patterns are found for actual return. The lowest average actual return is found in day one of trading. The highest mean of actual return is recorded in day five of trading. The median value patterns are little bit different but the picture is relatively the same. These findings indicate that the use of abnormal return and actual return in an IPO setting tend to generate similar results.
4.2.2 Descriptive Statistics of Operating Performance Ratios
performance ratios, namely operating return on assets, operating cash flow to total assets, sales growth, and total assets turnover. The first analysis performed in relation to operating performance is the descriptive statistics of each operating performance proxy.
The value of each proxy is differentiated based on year of analysis. Table 4.4 shows descriptive statistics of operating performance ratios before and after IPO.
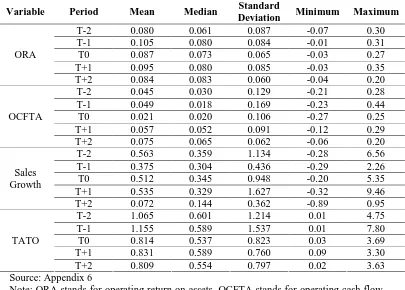
Table 4.4 Descriptive Statistics of Operating Performance Ratios
Variable Period Mean Median Standard
Deviation Minimum Maximum
T-2 0.080 0.061 0.087 -0.07 0.30
Note: ORA stands for operating return on assets, OCFTA stands for operating cash flow on total assets, TATO stands for total assets turn over.
ORA are negative. The highest maximum value occurred in the period of one year after IPO.
The mean value of operating cash flow to total assets (OCFTA) is tending to fluctuate in the years before the offering but it increases after the IPO date. The highest standard deviation of OCFTA occurred in period before IPO. In similar fashion with ORA, the minimum value of OCFTA is negative.
The mean and median values of sales growth tend increase immediately after the offering. It seems that the sample firms are unable to increase their sales in the period two years after the issue. The median values tend to follow the behavior of mean values.
Furthermore, the average of total assets turnover (TATO) tends to decrease after the IPO date. It increases in the period one year after the issue but it loss the momentum in period two year after the offering. The patterns of median of TATO are relatively similar to the behavior of mean values.
4.2.3 Data Normality Test
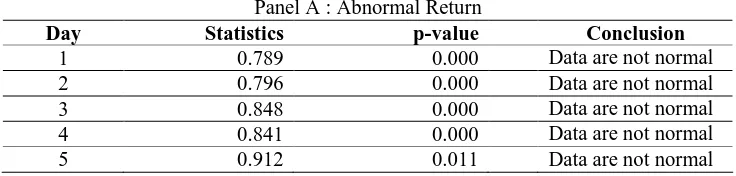
Data normality test is used to examine whether the data have normal distribution or not. This research uses Shapiro-Wilk test to detect whether the distribution of data is normal or not. The Shapiro-Wilk test is conducted because the numbers of data are less than 50. The first normality test is abnormal return. The level of significance is 5%. The results of normality test of abnormal return and actual return are shown in the Table 4.5.
Table 4.5 Data Normality Test Results of Abnormal Return
Panel A : Abnormal Return
Day Statistics p-value Conclusion
Panel B : Actual Return
Day Statistics p-value Conclusion
1 0.808 0.000 Data are not normal
Table 4.5 shows all the data are not normally distributed either in terms of abnormal return or actual return. The probability values are not greater than the level of significance which means null hypothesis is rejected. Therefore, to test the first hypothesis this study relies on non-parametric test of Wilcoxon one sample.
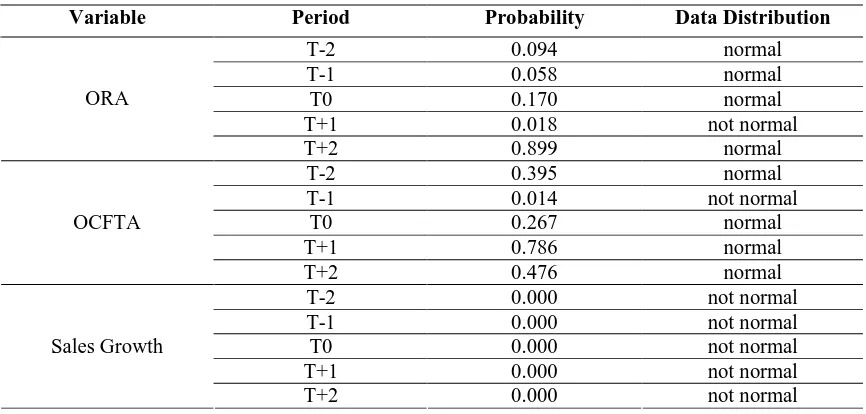
The second normality test is operating performance ratios, namely operating return on assets, operating cash flow to total assets, sales growth, and total assets turnover. The level of significance is 5%. Normality test results of proxies for operating performance are presented in Table 4.6.
Table 4.6 Normality Test Results of Operating Performance Ratios
Variable Period Probability Data Distribution
Variable Period Probability Data Distribution
Note: ORA stands for operating return on assets, OCFTA stands for operating cash flow on total assets, TATO stands for total assets turn over.
Table 4.6 shows the data with normal distribution are found for ORA (t-2),
ORA (t-1), ORA (t0), ORA (t+2), OCFTA (t-2), OCFTA (t0), OCFTA (t+1) and
OCFTA (t+2). However, most of the data are not normally distributed, which are
found for ORA (t+1), OCFTA (t-1), SG (t-2), SG (t-1), SG (t0), SG (t+1), SG (t+2),
TATO (t-2), TATO (t-1), TATO (t0), TATO (t+1) and TATO (t+2). Given the data
with non-normal distribution are larger than data with normal distribution, this study will use non-parametric test of Wilcoxon pair test in testing the proposed hypotheses. For the completeness reason, the analysis based on parametric tests of t-test for pair sample is also presented.
4.2.4 Abnormal Return Test
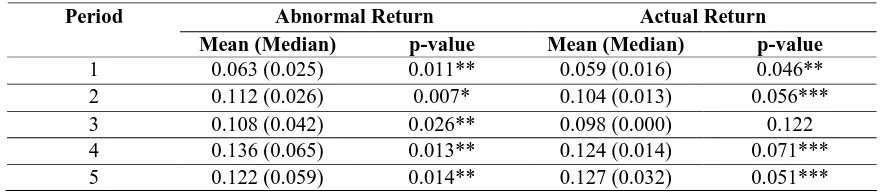
The first objective of this research is to examine whether any abnormal return after going public. This test uses one sample t-test and Wilcoxon one sample as there are data with normal and non-normal distribution. The results of one sample t-test and Wilcoxon one sample of abnormal return are present in Table 4.7.
Table 4.7 Mean and Median Test of Abnormal Return and Actual Return
Abnormal Return Actual Return
Period
Mean (Median) p-value Mean (Median) p-value
1 0.063 (0.025) 0.011** 0.059 (0.016) 0.046** 2 0.112 (0.026) 0.007* 0.104 (0.013) 0.056*** 3 0.108 (0.042) 0.026** 0.098 (0.000) 0.122 4 0.136 (0.065) 0.013** 0.124 (0.014) 0.071*** 5 0.122 (0.059) 0.014** 0.127 (0.032) 0.051*** *significant at 1%; **significant at 5%; ***significant at 10%; using one-tailed test.
Source: Appendix 3 and 5
analysis. However the actual return is significant at 5% level only on the first trading day. Days 2, 4 and 5 are significant at 10% level but day 3 is insignificant.
Overall, the abnormal return is different from zero. It shows that H0 is
rejected; it means there are significant abnormal returns on the IPO dates. Thus, the first alternative hypothesis (Ha1) that there is abnormal return on IPO date in
Indonesia Stock Exchange is accepted. 4.2.5 Operating Performance Ratios Test
The second objective of this research is to examine whether the operating performance ratios are improving after going public. Table 4.8 indicates that the results of test on data distribution of ORA, OCFTA, Sales Growth and TATO are not normal. This suggests that the hypothesis will be analyzed using Wilcoxon Paired Samples.
Table 4.8 Distribution Data at each Time of Testing
Current Year of the Initial Public Offerings Variable
from -2 to -1 from -1 to 0 from -1 to +1 from -1 to +2
ORA not normal not normal not normal not normal OCFTA not normal not normal not normal not normal Sales Growth not normal not normal not normal not normal TATO not normal not normal not normal not normal Source: Appendix 7
Note: ORA stands for operating return on assets, OCFTA stands for operating cash flows on total assets, TATO stands for total assets turn over.
Given the distribution of data is not normal, the tests for operating performance of firms making IPO will be the paired samples Wilcoxon test. The results of hypotheses testing on operating performance ratios are shown in Table 4.9.
4.9 The Different Test of Operating Performance Companies making IPO (n=33)
Year Relative to Completion of IPO
from -2 to -1 from -1 to 0 from -1 to +1 from -1 to +2
Measure of Operating Performance
Panel A : Operating Return on Assets (ROA)
Year Relative to Completion of IPO
from -2 to -1 from -1 to 0 from -1 to +1 from -1 to +2
Measure of Operating Performance
Panel B : Operating Cash Flow to Total assets
Median (%) 0.030 0.018 0.018 0.020 0.018 0.052 0.018 0.065
Panel D : Total Assets Turnover
Median (%) 0.601 0.589 0.589 0.537 0.589 0.589 0.589 0.554
*significant at 1%; **significant at 5%;
Source: In appendix 8 and 9
Note: ORA stands for operating return on assets, OCFTA stands for operating cash flows on total assets, TATO stands for total assets turn over.
Based on the results shown in Table 4.9, the following conclusions can be generated. The changes in operating performance of issuing firms are measured relative to year t-1. Panel A presents the median difference in operating return on
assets are 0.019%, -0.007%, 0% and 0.003% for years t-2, t0, t+1 and t+2 relative to
year t-1, respectively. The median difference for the IPO firms decline over time
period. Year t-2 is significant at 1% then t+2 are significant at 5% level. These
findings are shown by the null hypothesis is rejected exclude on year t-1 to t+1.
0.0025, 0.034% and 0.047% for years t-2, t0, t+1 and t+2 relative to year t-1,
respectively. Yet, the changes are all insignificant.
In Panel C, the median difference increases in sales measured relative to year t-1 are -0.051%, 0.041% and 0.025% for year’s t-2, t0 and t+1 respectively.
But, the median decrease drastically on year t+2 at -0.160%. From that, only one
year significantly at the 1% level, that is year from t-1 to t+2. Moreover, it can be
seen that the IPO firms exhibit inferior post-IPO operating performance relative to the year prior to going public.
In Panel D, the median difference in total assets turnover is reported. The median difference decreases by -0.035% over three-year from t-1 to t+2. One of
year is insignificantly, and other years are significant at the 1% level for year’s t0,
t+1 and t+2 relative to year t-1. Despite the high sales growth, the decline in total
assets turnover is indicative of the fact that IPO firms increase their assets faster than their sales.
4.3Discussions
Initial public offering is one of the corporate actions, which can be use as information for the investor making investment decisions in the stock market. The objectives of this research are to analyze the existence of abnormal return on IPO date in Indonesia Stock Exchange. Another objective is to analyze operating performance covering operating return on assets, operating cash flow to total assets, sales growth, and total assets turnover improving after going public. 4.3.1 Abnormal Return on IPO Date
Several researchers, such as Ibbotson, et al and Sakir (2003) found evidence that abnormal return is not significant after the IPO date. These findings indicate that the IPO event does not contain the information that resulted by the market react.
The first alternative hypothesis is accepted which this research proves that investor have various reacts to the announcement of firms going public. It can be seen from the abnormal return are positive on the IPO date. Based on the results of testing the first hypothesis, investors should consider IPO firms as reference in investment in stock market.
4.3.2 The Differences of Operating Performance Before and After IPO
Panel A describe the difference of ORA ratio tends to decrease significantly. Thus, operating return on assets after go public is not greater than before go public. This fact shows that the averages of firms are not able to improve the assets management used to get operating profit in the period before going public.
The firms should be able to improve assets management to get better operating profit in the period after going public. This is necessary because the firm also has a responsibility to its shareholders to increase its profit. Investors should be careful to fluctuations in the value of the ORA ratio and the funding allocation as an impact on the operating performance of the firms making IPO.
The result is in line with Jain and Kini (1994) who found that operating return on assets has declined significantly after the IPO. ORA ratio after go public is not better than before go public. This condition is very likely caused by effort of the firms to use most of funds for investment of debt payment making ORA to decline.
other words, this finding here indicates that on average firms are not able to improve asset utilization to increase operating cash flow.
This analysis result implies that the firms should be increase the efficiency assets utilization to maintain the operating cash flow especially after going public, because the firms are expect to improve its performance after obtaining additional funds from the shareholders. The investors should be looking at the amount of cash receipts from customers and cash payments to suppliers and employees as it may affect the cash flow from operating activities of firms making IPO.
Results of this research do not support Jain and Kini (1994) which concluded that there is a difference of operating cash flow to total assets before and after go public. Operating cash flow to total assets is decreasing significantly after the firms going public.
Panel C shows the average difference of sales growth from the second year to the first year before go public are increasing on the IPO date then increases again on the first year after the IPO (p<0.05). However, this research is unable to state that the proposed hypothesis stating that sales growth after going public is higher than beforerence.
Sales growth ratio after the IPO is not greater or equal than before the IPO caused by the firms on average increase sales after going public but the increasing is lower than in the period before going public. The firms should be able to optimize the assets utilization in maintain sales, as sales increase may affect the firms increasing sales growth. Investors should be looking in increasing firms sales at any time due to an increase in sales growth also depends on the size of firm’s capital. If there are funds or money coming into the firms in large numbers and its funds are use to improve the firm’s performance, the production capacity consequently will increase the firms’ sales.
This makes the hypothesis that total assets turnover after going public has higher than before is rejected. This finding indicates that on average the firm’s are unable to improve assets utilization to increase sales.
Based on analysis before, it can be summarized that the firms operating performance after going public is not better than before going public covering operating return on assets, operating cash flow to total assets, sales growth and total assets turnover. This finding tends to decline the firms operating performance after going public; it can attribute to firm’s effort to maintain the financial performance before going public.
Some interpretations could be raised dealing with the findings of worsening financial performances after the IPOs. Firstly, we might argue that the pre-IPO financial performances have subtlety been managed so they are not reflecting the real performance of the firm. Previous studies have documented that in the case of IPO, earnings performances have been managed in the period prior to the offering, for example Teoh et al. (1998) or Friedlan (1993) in the US, Kamel (2009) in Egypt, or Gumanti (2001) in Indonesia. Nevertheless, some studies also suggest that this is not always the case, for example Ball and Shivakumar (2008) in US or Warganegara and Indriastari (2009) in Indonesia. Thus, it might be premature to assert that earnings management is common practice in IPO market.
Secondly, the other possible cause for lower performance of IPO firm is that the firm is unable to manage the funds for productive use in the short run or the benefit of fund management is not in effect over short period. It may take some years before the firm is able to earn economic benefits from the use of funds. This implies that the examination of after IPO financial performance shall be extended in longer period.
financial performance ratios in the case of privatization in China. Thus, further elaboration is required to find out more evidence on the financial performances of IPO firms after the issue.
There some contains that need to put forward in related to the findings as follows.
a. This research time period is only 4 years from 2007 to 2010, which of 33 firms samples, while the previous studies used a sample around 100 firms. Therefore, it had been unable to reflect a longer stretch of time, and consequently the results obtained not reflect the varying conditions.
b. Investors tend to pay less attention to the information that goes into market so that stock prices formed in stock market can influenced by other factors, such as the global financial crisis in the form of sub-prime mortgage crisis. In addition, the global financial crisis in 2007-2010 may significantly on the firm’s performance that going public, thus some of firms after making IPO had been unable to improve its performance significantly.
37
This research is aimed to analyze the abnormal return and the effect of going public on operating performance of IPO firms in Indonesian stock exchange for period 2007-2010. A sample of 33 firms meeting the selection criteria is examined. Based on the results and discussion, the conclusions obtained are as follows.
a. There is abnormal return surrounding the IPO date. It means on average investors obtain positive return when they buy the stocks at the offer price and sell them immediately in the first five day at the secondary market.
b. Firms operating performance after going public tend to decrease but not all of the patters are significantly different between periods. Operating performance tend to increase approaching the offering date but decrease slightly after that. Operating return on assets, operating cash flow to total assets, sales growth and total assets turnover as proxies for operating performance indicate similar patterns both in the periods before and after the offering. This study is unable to conclude that the operating performance of the firms making IPO is different between before and after the offering.
5.2.Suggestions
Based on the results of data analysis, conclusions, and limitations, the suggestions can be presented as follows.
a. For the Investor, the findings of significant abnormal returns on other days after the IPO could be used as trading strategies when dealing with firm making IPO.
REFERENCES
Ahmad, A. 2011. Ownership Structure and the Operating Performance of Malaysia Companies. International Review of Business Research Papers. 7 (6): 1-14.
Ang, Robert. 1997. Buku Pintar Pasar Modal Indonesia. Mediasoft Indonesia. Jakarta.
Ball, R., L. Shivakumar. 2008. Earnings Quality at Initial Public Offerings. Journal of Accounting and Economics. 45: 324–349.
Banz, R. W. 1981. “The Relationship between Return and Market Value of Common Stocks”. Journal of Financial Economics Vol. 9: 3-18.
Brigham, Eugene F. and Houston, Joel F. 2001. Manajemen Keungan II. Jakarta: Salemba Empat.
De Lorenzo, M. and Fabrizio, S. 2001. Assymetric Information and the Role Underwriter, The Prospectus and The Analyst in Underpricing of IPO. The Italian Case.
Fabozzi, F. J. 1999. Manajemen Investasi (buku satu). Jakarta: Salemba Empat. Friedlan, M. L. 1994. Accounting Choices of Issuers of Initial Public Offering.
Contemporary Accounting Research, 11(1), 1-31.
Gumanti, T.A. 2001. Earnings Management Pada Penawaran Pasar Perdana di Bursa Efek Jakarta. Jurnal Riset Akuntansi Indonesia, 4(2), 165-183. Gumanti, T.A. 2002. Underpricing dan Biaya-biaya di sekitar Initial Public
Offering. Wahana. Vol. 5(2): 135-147.
Gumanti, T.A. 2011. Manajemen Investasi Konsep, Teori, dan Aplikasi. Jakarta: Mitra Wacana Media.
Gumanti, T.A. and Alkaf, N. 2011. Underpricing dalam Penawaran Saham Perdana dan Penawaran Saham Susulan. Jurnal akuntansi dan Keuangan Indonesia. Vol. 8(1).
Hartanto, Imanuel B. and Sri I, Ediningsih. 2004. “Kinerja Harga Saham Setelah Penawaran Perdana (IPO) pada Bursa Efek Jakarta”. Usahawan 8: 36-43. Hartono, J. 2010. “Teori Portfolio dan Analisis Investasi. Edisi Ketujuh, BPFE”.
Hartono, J. and Syaiful, Ali. 2002.”Analisis Pengaruh Pemilihan Metode Akuntansi terhadap Pemasukan Penawaran Perdana”. Jurnal Ekonomi dan Bisnis Indonesia. Vol. 17(2): 211-225.
Ibbotson, R. and J. Sindelar., J.R. Ritter. 1988. Initial Public Offerings, Journal of Applied Corporate Finance, 1 (2): 37-45.
Ibbotson, R.G. and J. R. Ritter. 1994. Initial Public Offerings. In Handbook of Operations Research and Management Science, R.A. Jarrow, V. Maksimovic, and W.T. Ziemba (eds), North Holland, Amsterdam. Chapter 30. pp. 993-1016
Jain, B. A. and O. Kini. 1994. The Post-Issue Operating Performance of IPO Firms. The Journal of Finance. Vol. 49(5): 1699-1726.
Jensen, M. and W. Meckling. 1976. Theory of the Firm: Managerial Behavior, Agency Costs and Ownership Structure. Journal of Financial Economics. Vol. 33: 305-360.
Kamel, H. 2012. Earnings Management and Initial Public Offerings: A New Perspective from Egypt. Journal of Accounting in Emerging Economies. 2 (2): 96-118
Kim, K.A., P. Kitsabunnarat. and J.R. Nofsinger. 2004. Ownership and Operating Performance in an Emerging Market: Evidence from Thai IPO Firms. Journal of Corporate Finance. 10: 355– 381.
Kurtaran, A. and Er, B. 2008. The Post-Issue Operating Performance of IPOs in Emerging Market: Evidence from Istanbul Stock Exchange. Investment Manegement and Financil Innovations. Vol. 5(4).
Midiastuti, P. and Fitriwati, I. 2004. Hubungan antara Harga Penawaran IPO, Target Kepemilikan Institusional, Underpricing dan Kinerja Perusahaan : Studi Empiris pada Bursa Efek Jakarta. Ventura. Vol. 7(3): 255-270.
Mikkelson, W., Partch, M. and Shah, K., 1997. Ownership and Operating Performance of Companies that Go Public. Journal of Financial Economics Vol 44: 281-307.
Nasirwan. 2002. Reputasi Penjamin Emisi, Return Awal, Return 15 hari sesudah IPO dan Kinerja Perusahaan 1 tahun sesudah IPO di BEJ. Kumpulan Makalah SNA V: 573-598.
Ritter, J. 1998. Initial Public Offerings. Warren Gorham & Lamont Handbook of Modern Finance. Contemporary Finance Digest Vol. 2(1): 5-30.
Sudarsanam. 1999. “The Essence of Merger dan Akuisis”. Edisi Pertama. ANDI. Yogyakarta.
Sulistio, H. 2005. Pengaruh Informasi Akuntansi dan Non Akuntansi terhadap Initial Return: tudi pada Perusahaan yang melakukan Iitial Public Offering di Bursa Efek Jakarta. SNA VII Solo.
Sutrisno, B. 2012. Kinerja Saham dan Kinerja Operasi Sebelum dan Sesudah Right Issue di Bursa Efek Indonesia. Tidak Dipublikasikan. Skripsi. Jember: Universitas Jember.
Universitas Jember. 2012. Pedoman Penulisan Karya Ilmiah. Jember: Jember University Press.
Teoh, S.H., T.J. Wong., G.R. Rao. 1998. Are Accruals during Initial Public Offerings Opportunistic?. Review of Accounting Studies. 3: 175–208.
Wang, C. 2005. Ownership and Operating Performance of Chinese IPOs. Journal of Banking & Finance. 29 (7): 1835-1856
Warganegara, D.L., I. Indriastari. 2009. Do Indonesian Firms Inflate Their Reported Earnings Prior to IPOs?. Journal of Financial Reporting & Accounting 7 (2): 61-79.
APPENDIX
Appendix 1
Research Population of Firms Making IPO in Period 2007-2010
No Code Company Name IPO Date Sectors*
No Code Company Name IPO Date Sectors*