J.M. Zain et al. (Eds.): ICSECS 2011, Part III, CCIS 181, pp. 557–570, 2011. © Springer-Verlag Berlin Heidelberg 2011
Students in Introductory Programming
Affandy1, Nanna Suryana Herman1, Sazilah Binti Salam1, and Edi Noersasongko2
1
Faculty of Information and Communication Technology, Universiti Teknikal Malaysia - Melaka, Hang Tuah Jaya, 76100 Durian Tunggal, Melaka, Malaysia
2
Faculty of Computer Science, University of Dian Nuswantoro, Nakula I / No.5-11 Semarang 50131, Indonesia
{affandy_ra,nsuryana,sazilah}@utem.edu.my, [email protected]
Abstract. The tasks of programming include complex knowledge and skills that is, from understanding problems to evaluating validity of program. Novice students often face difficulties in learning programming due to various issues and the nature of the subject, which can be vague and invisible. A survey was conducted on 294 students from two universities to study novices’ problems in dealing with tracking the logical flow and writing a simple code. The average score for tracking and writing skills were quite disappointing. Students were only able to master the static part of programming knowledge. They lacked the knowledge in understanding and tracing the dynamic behavior of the program. This research attempts to propose a model to shift the internal working memory load of students through integrated visualization tools that can reveal the dynamic behavior of programs and related concepts that appear in each level of program abstractions.
Keywords: learning, programming, novices, tracing, reading, writing, program visualization, behavior.
1 Introduction
In order to solve these programming education problems, some programming instructors use Software Visualization (SV) tools that are intended to represent information about software in a graphical way. There is a belief among the instructors that SV will give students a better understanding of basic programming because they can visually reveal the program’s process and the inner workings of the algorithm. However, things have happened beyond that belief. Other studies show a downfall of this technology as a learning or teaching aid-tool [5,6]. Previous studies conclude that time and effort required to design, integrate and maintain the visualizations in the class have become the main obstacles for students and instructors to use it as a learning-aid tool [7,8]. Most of them provide exposure to the dynamic or static behavior of an existing program or canned-algorithm to support the understanding of student’s knowledge of the program. Meanwhile, students rely on the program developer tools (e.g. C++, Turbo Pascal, VB) to train their skill in writing a computer program due to the lack of learning-aid tool that can support their skill in constructing a program effectively. Therefore, they understand the higher level of a particular algorithm but it is so hard for them to turn it into a lower level abstraction in a form of program code.
This study attempts to reveal novice students’ performance in understanding the existing code and in writing a simple C++ program by the end of the first semester. This consideration will lead us to answer following questions: currently, what is the students’ level of ability to trace and write the simple C program? Do they have the same level for both these capabilities? Furthermore, the research also attempt to propose a better approach to support students’ program comprehension as a whole and to find a way to know how these needs can be met through a visualization tool for introductory programming courses.
2 Programming and Program Comprehension Process
Mostly conventional introductory programming courses have been delivered with an approach that resembles top-down and bottom-up strategy in separate manners. Instructors usually teach in an order of sequence. The broad conceptual framework of a particular programming, algorithm, problem-solving design and language structure is delivered first to students in a lecture class (top-down model). After that, through their limited knowledge of programming concepts coupled with complexity of highly constraint syntaxes, students struggle in an attempt to build programming code in accordance with designed algorithm (bottom-up model). This is contrary to the experiment shown [11] that elucidates the fact that novices jump from top-bottom model into bottom-up model and jump-back again in to top-bottom model arbitrarily in order to make a model and to correct the program. This cross-referencing work, between higher and lower abstraction of program, has lacks supported by instructors and developer of SV tools as a part of their features.
Currently the structure of introductory programming courses are based on lectures and practical laboratory work, which focus largely on knowledge of the language and building skills needed to generate a program. Instructors rarely teach how to verify the validity of a program in the evaluation phase, the facts that the interrelated tasks in designing algorithm, constructing program, and evaluating among them has been assumed as a sequence relationship rather than interwoven relationship. Many of them believe that the ability to write the code would be followed by the ability to evaluate/debug the code. Meanwhile Robins et.al [12] in their review of learning and teaching state that learning to make a program not only involves learning to develop the model of the problem domain and the desired program but also developing the tracking and debugging skill to model and maintain their hypothesis of their own program.
3 Survey Design and Methodology
In order to get some answers about the level of ability to trace and to write computer programs, students from two neighboring countries, University of Teknikal Malaysia Melaka (T) and Dian Nuswantoro University, Indonesia (D) were tested. First, students were tested on their ability to understand the knowledge inside and to trace the outcome of a short piece of program. Secondly, students were tested on their ability to write a simple C++ program based on specific requirements.
3.1 Participants
A survey was conducted on 294 undergraduates from both universities who took an introductory programming subject in the first semester (nT = 140, nD=154). Some students from the non-IT study programme too, responded to the survey question.
3.2 Material and Task
student’s performance in program comprehension was evaluated by using two measurements, tracing and writing program test. The tracing ability test examined comprehension of following program knowledge: elementary operation (P1),
control-flow (P2), data-flow (P3), program function (P4), and program state (P5), which was developed by Pennington in order to study differences in programmers’ comprehension strategies [13]. Each category consists of a short simple of C++ program followed by three multiple-choice questions related to the program and the maximum score for this section is 15
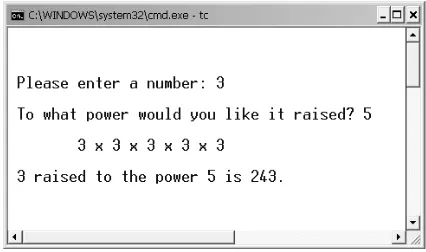
Fig. 1. The expected output display of the writing-code test from case of a math operator for raising an input number to a particular power
The writing-code test was a paper-based test to assess participants in developing a simple C++ code based on specific requirements. The scenario of the problem was students were requested to construct a simple code that raises any number of X to a positive power of N (Xand Nare data-input from keyboard), the output will display the number of X for N times, and the results of power operation, as seen on Fig. 1. The test was developed by adopting fundamental computer process (input, process, and output) into following categories of skills: data definition (S1), input session (S2),
control-flow (S3), and output session (S4). One point will be awarded to the participant for each valid line code referred to each in category, and the maximum score for this section is 14 point.
3.3 Procedure
4 Performance and Data Analysis
This section contains a statistical analysis of the two performance data that are provided by the students from the different universities. Some of the dataset analyzed and presented either as independent or combined dataset.
4.1 Analysis of Tracing Ability Score
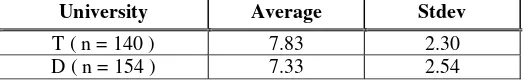
The average score of total tracing/reading ability (P1-P5) for all students, all exercises, at both universities were 7.57 out of 15 (stdev: 2.44). The score for each university is generally similar as in Table 1.
Table 1. Tracing/Reading Ability
University Average Stdev
T ( n = 140 ) 7.83 2.30
D ( n = 154 ) 7.33 2.54
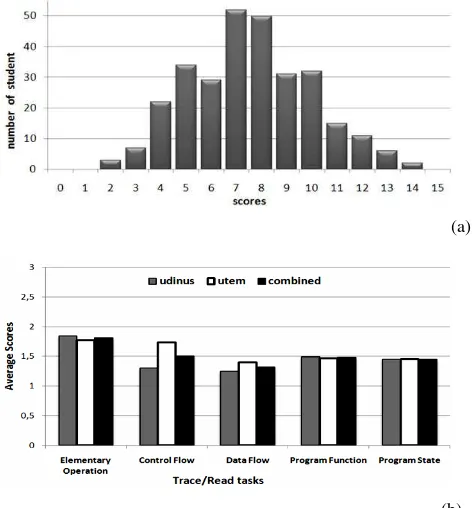
Table 2. Average Score of Trace/Read Code by Trace Tasks
Average (stdev) Trace
task Univ D Univ T Combined
Sig. (2-tailed) p
P1 1.80 (0.96) 1.77 (1.01) 1.81 (0.98) 0.793 P2 1.33 (0.96) 1.73 (0.89) 1.51 (0.94) 0.001 P3 1.26 (0.83) 1.40 (0.75) 1.32 (0.80) 0.15 P4 1.48 (0.71) 1.47 (0.83) 1.48 (0.77) 0.937 P5 1.46 (1.03) 1.45 (0.90) 1.45 (0.96) 0.911
(a)
(b)
Fig. 2. (a) Tracing ability score distribution. (b) Average score of trace tasks
4.2 Analysis of Writing-Code Ability Score
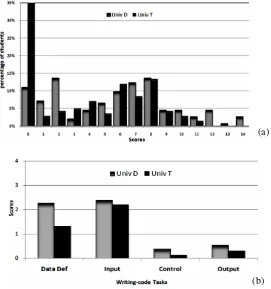
In general, a worse situation occurred also on the test of ability to write a program. Students’ performances in both the universities are very low compared to the maximum score. Based on the fact that most scores of each task differ significantly to each other (p<0.05) then wecannot assume a combined data from both of them (see Table 3). Students did the best in declaring input statement (S2), and next on defining data type (S1). This may be due to the simplicity of the standard input statement and the basic data type at the introductory level. Whereas, students’ skill in the application of control statement is very low, perhaps due to their lack of understanding on control flow (P2) and data flow (P3).
Table 3. Average Score of the Writing-Code Test
Average Writing
tasks (max
score) Univ D Univ T
Sig. (2-tailed) P
Fig. 3(a) shows that the distribution of the writing-test score spreads along the scores axis, while the majority of the students did very poorly, more than 60% of the students got below 7. There are some little “humps” in the distribution, indicating that very few students with somewhat better score, less than 35% of the students scored above 8. Many students at the university T left their answer sheet blank for some reason, e.g. insufficient time, shortage of computers to work on, not knowing what should be written first since not accessible to template of program etc.
(a)
(b)
Fig. 3. (a) Writing-code score distribution (b) Average score of the writing-code tasks
5 Discussion
5.1 Ability to Trace the Lower-Level Abstraction
It seems that during the development of the program model, participants can only possess static elements of the mental model that are micro-structure and macro-structure of the program text [9]. Micro-macro-structure consists of actual program statements and their relationship e.g. variable definition, elementary operations, sequence, loop constructs and conditional constructs. Whereas macro-structure is identified by a label or procedure name that corresponds to control-flow organization of the program text, e.g. program function, program state and module label. Since the static element is related to program text and its structure, it is easier for students to comprehend it, as in figure 2(b) that all these elements can be understood equally. The experience in programming improves the understanding level of text-structure knowledge and store in long-term memory. The role of beacon, a guiding text for gaining a high-level of understanding (e.g. variable name, function name, literal string, etc.) and rule of discourse, conventions of coding,[14] within the trace-code test may also contribute to the comprehension.
5.2 Inability to Construct the Higher-Level Abstraction
Unfortunately, things that occur in the understanding of the program text do not happen with the acquisition of dynamic behaviors of program text as an integrated element of the mental model. Respondents fail in implementing both mechanisms that produce information, chunking and cross-referencing. Chunking means taking several
chunks of lower-level structure to create new higher-level-abstraction structure [15]. For instance, a piece of code may represent a compound if-conditional, this section of code takes a job from received input value, evaluates the value, and then saves the value into a related array variable leading to the higher-level-abstraction of “Categorization Process”.
Based on table 2 and table 3, respondents can answer the given questions related to
if-conditional in the trace code test (mean score was 1.51 out of 3), but they are unable to chunk this knowledge structure to construct the if-conditional within the write code test (mean score in each university is S3 = 0.11 and 0.38 out of 4). In the write code test, micro-structure of if-conditional should be chunking as macro-structure of “Print Evaluator” to evaluate whether the character “x” (as a multiply symbol) will be displayed or not. Moreover, this situation leads to the lack of ability to cross-reference which relates to different levels of abstraction.
5.3 The Need for Multi-representation of Program
Program representation is a very complex multidimensional representation, as Soloway states [14] that there are two audiences of computer program, the computer and human reader. For the human reader, computer program can appear in several level of cognitive representation:
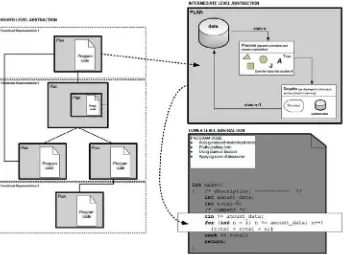
Level 1 corresponds to the lower-level abstraction of the program, which is in the form of highly constraint syntaxes. Level 2 and 3 refer to intermediate-level abstraction, they reflect how it works (mechanism) and what the end result is. Level 4 corresponds to the higher-level abstraction of the code in terms of real world problem. Comprehension process becomes more difficult since students have to maintain all those representations while keeping in their mind all of the cross-referencing between designed algorithm, syntaxes of particular language programming and also its semantic result at the same time. Because of those overloading information to depict program abstraction, the use of software visualization tools are expected to relieve the internal working memory load by making the meaning of the code more apparent and concrete, while making the overall structure of the program easier to grasp. Unfortunately, the involvement of these technologies that are used to assist in comprehension tasks cannot immediately resolve the program comprehension problems. Some visualization tools that were released around 1999 to 2009 such as Alice 3D [16], ALVIS Live! [17], ANIMAL [18], DataStructure Navigator [19], Data Structure Visualization [20], Jeliot 3[21], MatrixPro [22], Raptor [23], The Teaching Machine[24], ViLLE [25], these tools mostly support one or two aspects of the programming representation either algorithm, data structure, or program visualization rather than bridging multi-representation of the program. Results of the survey confirm that students can understand the program code in the form of text-structure and they can clearly understand the problems that are represent in natural language. The biggest challenge for them is the in-between representation, which relates to the lower and higher level of abstraction.
5.4 Proposed of Multi-representation Model
Novices find that it is difficult to map the problem domain into the functional representation and the graphic elements of the visualization to the syntax of the program. However, IT graduates must also realize the importance of abstraction; they must be able to manage the complexity of the programming through the abstraction [26]. These facts lead us to focus our attention on abstraction ability. It is believed that this ability has a contribution to the ability to trace and write a computer program. However, since learnt to think abstractly is very difficult, we propose a model that can help us to construct a learning-aid tool that will reveal or visualize the multi-representation of the program.
of specific programming language. Textual structure is built by applying several formatting techniques to create a programming code that looks like a descriptive document. This also applies conversation standard, which ease the novices to construct their hypothesis while they read program codes. All models are integrated in a learning-aid tool that will be helpful for students to comprehend the program from a higher-level to a lower-level since the process of constructing a certain program can be seen clearly e.g. how the process works, where the data come from, the results and the textual code of the program.
Fig. 4. Integrated Multi-Representation Model
Due to the diversity in the comprehension process, our proposed model is designed by adopting both the top-down and bottom up comprehension as theoretical underpinnings to develop a comprehension support tool [15]. Tool is modeled by following the point of view of the abstraction level of the program. For the top-down approach the abstraction view start from a higher-level model to a lower-level model and vice versa for the bottom-up approach. We distinguish the following three models:
and manage the complexity. Students using some packages of basic plans – stereotypical, canned solutions– provided by system or customized by the user, to develop a functional representation. Plans are symbolized with flowchart-like to reveal its logical flow. Combining some plans to achieve specific functions similar to installing a piece of puzzle to get a more meaningful picture. The environment is designed to foster active learning that engages students to construct their own algorithm using some basic plans in order to support the visual engagement at level 4 (constructing a visualization) [27] rather than providing canned algorithm. 2. The intermediate-level abstraction model, this model is also known as the
explanation model that provides a dynamic representation of data state changes and program behavior. The model takes each plan from previous level as the input, and shows to student how the symbol is executed or evaluated. Plans that are currently under execution are highlighted on the prior model to synchronize user view between high-level and intermediate level abstraction. For instance, when the model executes a piece of plan called TESTING-INPUT-VALIDITY, e.g.
while input_value < limit do, it will dynamically and systematically
show the process, starting from taking the value from variable input_value
and limit then followed by the comparison process between both of them. The
model demonstrates to students how each part of the plan isbeing executed and where all the values shown come from or go to rather than allowing student to guess. As a result, the logical consequences are displayed and the effect of the result, whether FALSE or TRUE, is addressed by the higher-level abstraction model to execute the next corresponding symbol/plan.
3. The lower-level abstraction model provides textual representation in the form of particular programming language. It transforms each plan of the higher-level abstraction model into syntax of the specific language right after the user constructs or edits a plan. The executed plan in intermediate and higher-level model is highlighted to show the mapping process among all levels. A plan can be constructed by one or more related statements that form a block of statement. Model intends to show clearly in terms of logic as to how a code is built line by line by referring to the correspondence of the designed algorithm at a higher-level abstraction. It also emphasizes the application of the beacon and rules of programming in order to gain a higher level of understanding. Beacons act as cues to the presence of certain structures or features that possibly lead to the creation of hypotheses e.g. procedures and variable names. Rules of programming are rules or conventions within programming such as code presentation or naming standards [9]. As well as in terms of formatting, code is presented with beautification in order to make it easier for reading and understanding. Code beautification involves parsing the textual source code into proper code formatting via the use of indentation, positioning of braces, blocking, coloring reserved words, size, and styling.
and student will construct each of sub-solution using provided plans or create their own plans. For example the SimpleType_DataDefinition plan and
SentinelControlled_Looping_DataInput plan will construct a function
of entering the data. Within intermediate model SimpleType_DataDefinition plan will be visualized by dynamic animation of artifacts that show the process of data definition. In the same way to show where all of each data go to and when the iteration will stop, the model will execute and animate the
SentinelControlled_Looping_DataInput plan right ater previous plan.
At the same time textual representation model will generate the corresponded statement automatically for each plan under execution.
It is an integrated and reversible model, so when students try to trace their own designed algorithm, the higher-level model shows the complete logical flow of the algorithm and at the same time, the execution model allows students to evaluate the behavior of their algorithm in relation to changes of data value and flow of program. Meanwhile the lower-level model helps students to map the higher-level abstraction into lines of code. It can be said that the concepts that appear in each model are explicitly related to each other.
6 Conclusion
There exists a mutual and complex dependency between understanding the conceptual framework of algorithm and the ability to construct and to debug a program. The ability to trace a program becomes one of the factors that are related to the ability to solve problems, and the ability of problem-solving contributes to the programming skill. Since program is invisible, learning to make the program requires an effort to make an abstract of each programming element. Integrated program visualization as learning-aid tool is needed to shift the internal working memory load of students to provide more “space” to the essential knowledge of programming. Integrated means that tool should reveal the structure of higher-level abstraction of the program, process, and behavior of the program, and gradually the construction program in a particular syntax of programming language.
Development of learning-aid tool with such complexity can be used to help students who have different learning strategies to understand the essentials of programming. This can be a greater challenge and can be studied in future research. Currently we are in the progress of developing the prototype based on our model which is hoped to shed light on the program understanding of our novices students
Acknowledgments
References
1. Association for Computing Machinery.:Curriculum and guidelines for undergraduate degree programs in information technology. (ACM) - IEEE Computer Society (2008) 2. Paivi, K., Malmi, L.: Why Students Drop Out CS1 Course? In: ICER 2006 - 2nd
International Computing Education Research Workshop, pp. 97–108. ACM, New York (2006)
3. McCracken, M., Almstrum, V., Diaz, D., Thomas, L., Guzdial, M., Utting, I., Hagan, D.: A multi-national, multi-institutional study of assessment of programming skills of first-year CS students A framework for first-year learning objectives. ACM SIGCSE Bulletin 33, 125–180 (2001)
4. Lister, R., Seppälä, O., Simon, B., Thomas, L., Adams, E.S., Fitzgerald, S., Fone, W., Hamer, J., Lindholm, M., McCartney, R., Moström, J.E., Sanders, K.: A multi-national study of reading and tracing skills in novice programmers. ACM SIGCSE Bulletin 36, 119 (2004)
5. Hundhausen, C.D., Douglas, S.A., Stasko, J.T.: A meta-study of algorithm visualization effectiveness. Journal of Visual Languages & Computing 13, 259–290 (2002)
6. Ihantola, P., Karavirta, V., Korhonen, A., Nikander, J.: Taxonomy of effortless creation of algorithm visualizations. In: ICER 2005 - International Workshop on Computing Education Research, pp. 123–133. ACM Press, New York (2005)
7. Levy, R.B.B., Ben-Ari, M.: We work so hard and they don’t use it: acceptance of software tools by teachers. ACM SIGCSE Bulletin 39, 250 (2007)
8. Cliburn, D.C.: Student opinions of Alice in CS1. In: 38th Annual Frontiers in Education Conference, FIE 2008, p. T3B–1. IEEE, New York (2008)
9. Maryhauser, A.V., Vans, A.M.: Program Understanding - A Survey. Technical Report, Colorado State University (1994)
10. Pennington, N.: Stimulus structures and mental representations in expert comprehension of computer programs. Cognitive psychology 19, 295–341 (1987)
11. von Mayrhauser, A., Vans, A.M.: From code understanding needs to reverse engineering tool capabilities. In: Proceedings of 6th International Workshop on Computer-Aided Software Engineering, pp. 230–239. IEEE Comput. Soc. Press, New Jersey (1993)
12. Robins, A., Rountree, J., Rountree, N.: Learning and teaching programming: A review and discussion. Computer Science Education 13, 137–172 (2003)
13. Pennington, N.: Comprehension strategies in programming. Ablex Publishing Corp., New York (1987)
14. Soloway, E.: Learning to program = learning to construct mechanisms and explanations. Communications of the ACM 29, 850–858 (1986)
15. Storey, M.-A.: Theories, tools and research methods in program comprehension: past, present and future. Software Quality Control 14, 187–208 (2006)
16. Cooper, S., Dann, W., Pausch, R.: Alice: a 3-D tool for introductory programming concepts. Journal of Computing Sciences in Colleges 15, 107–116 (2000)
17. Hundhausen, C., Brown, J.: What You See Is What You Code: A ‘live’ algorithm development and visualization environment for novice learners. Journal of Visual Languages & Computing 18, 22–47 (2007)
18. Robling, G., Schuler, M., Freisleben, B.: The ANIMAL Algorithm Animation Tool. In: The 5th Annual SIGCSE/SIGCUE ITiCSE Conference on Innovation and Technology in Computer Science Education, pp. 37–40 (2000)
19. DSN: Data Structure Navigator,
20. Data Structure Visualization,
http://www.cs.usfca.edu/~galles/visualization/
21. Moreno, A., Myller, N., Sutinen, E., Ben-Ari, M.: Visualizing programs with Jeliot 3. In: The Working Conference on Advanced Visual Interfaces - AVI 2004, p. 373. ACM Press, New York (2004)
22. Karavirta, V., Korhonen, A., Malmi, L., Stalnacke, K.: MatrixPro -a tool for demonstrating data structures and algorithms ex tempore. In: International Conference on Advanced Learning Technologies, pp. 892–893. IEEE, Los Alamitos (2004)
23. Carlisle, M.C., Wilson, T.A., Humphries, J.W., Hadfield, S.M.: RAPTOR: A Visual Programming Environment for Teaching Algorithmic Problem Solving. ACM SIGCSE Bulletin 37, 176 (2005)
24. Teaching Machine, http://www.engr.mun.ca/~theo/TM/
25. Rajala, T., Laakso, M.J., Kaila, E., Salakoski. VILLE–A, T.: language-independent program visualization tool. In: The Seventh Baltic Sea Conference on Computing Education Research (Koli Calling 2007), pp. 15–18. Australian Computer Society, Inc. (2007)
26. Interim Review Task Force.: Computer Science Curriculum 2008: An Interim Revision of CS 2001. Report from the Interim Review Task Association for Computing Machinery and IEEE Computer Society (2008)