THE DEVELOPMENT OF DECISION SUPPORT SYSTEM (DSS) FOR MONITORING AND EVALUATING FORESTRY INDUSTRY
LUTHFAN IBRAHIM DJUNAEDI
GRADUATE SCHOOL
THE DEVELOPMENT OF DECISION SUPPORT SYSTEM (DSS) FOR MONITORING AND EVALUATING FORESTRY INDUSTRY
LUTHFAN IBRAHIM DJUNAEDI
A Thesis submitted for the degree of Master of Science Of Bogor Agricultural University
MASTER OF SCIENCE IN INFORMATION TECHNOLOGY FOR NATURAL RESOURCES MANAGEMENT
GRADUATE SCHOOL
ABSTRACT
LUHFAN IBRAHIM DJUNAEDI (2007). The Development of Decision Support System (DSS) for Monitoring and Evaluating Forestry Industry. Under the supervision of KUDANG BORO SEMINAR and I NENGAH SURATI JAYA.
The uncertainty of wood material supply has become a major problem for Indonesia forestry industry. This is due to the imbalance between the diminished sustainable capacity of the forest and forestry industry in raw material.
To overcome industry material problem, Government (Department of Forestry) has established regulation number 34/2002 about forestry industry revitalization. By this regulation, Government attempts to revitalize and to push industry to use material efficiently, to improve wood product value, and to control industry product capacity. In order to achieve there goals, the first revitalization action has been taken by monitoring and evaluating industry i.e.
inventorying forestry industry material requirement, reregistering industry licenses and administration requirements, and perform an evaluation of forestry industry performance.
Within the implemented obligations, there are some problems that need to be identified and overcome. The existing system for monitoring and evaluation is time consuming and costly and introduces discrepancy of decision making among sub directorates on Department of Forestry.
The purpose of this research is to develop decision support system that improves the current system used by Government, for monitoring and evaluating forestry industry.
ACKNOWLEDGMENT
Initially, the author would like to express his gratefulness to Allah SWT for the favors and mercies during the time. He wishes to thank to his supervisor Dr. Ir. Kudang Boro Seminar, M.Sc and his co-supervisor Dr. Ir. I Nengah Surati Jaya, M.Agr; for the guidance, advices, comments, encouragement and also constructive criticism during the supervision of his research, throughout the research period.
He wishes also to thank and give most appreciation to MIT student’s batch 2004 for the togetherness, assistance, and the enlightenment they shared for all this time. Highly appreciation is also extended to the staff of the Master of Science in Information Technology for Natural Resources Management (MIT) Program for the good cooperation and facilitation, special thanks also to MIT lectures for sharing and imparting their knowledge and experiences during the time.
Finally, the author deeply wishes to express his most gratefulness to his beloved fiancée, Rossy Almaida Nasution, S.Hut, for her support, patient and care during his study. Thanks also extended to his Mom, Dad, Brother, and Rahmatsyah family, for their support and caring.
CURRICULUM VITAE
Luthfan Ibrahim Djunaedi was born in Bogor, West Java, Indonesia at August 27, 1978. He spent most of his childhood and school from elementary to SMU at Bogor. He achieved his undergraduate degree from Bogor Agricultural University (IPB), Faculty of Forestry, Bogor in 2003 majoring in Forest Product Technology.
Research Title : The Development of Decision Support System (DSS) for Monitoring and Evaluating Forest Industry
Name : Luthfan Ibrahim Djunaedi Student ID : G.051040071
Study Program : Master of Science in Information Technology for Natural Resources Management
Approved by, Advisory Board
Dr. Ir. Kudang Boro Seminar, M.Sc Dr. Ir. I Nengah Surati Jaya, M.Agr Supervisor Co – Supervisor
Endorsed by,
Program Coordinator Dean of Graduate School
Dr. Ir. Tania June, M.Sc Prof. Dr. Ir. Khairil A. Notodiputro, MS
TABLE OF CONTENTS
2.1. Indonesia’s Forestry Industry Development ... 3
2.2. Performance Assessment of Indonesia Forestry Industry ... 5
V. CONCLUSION AND RECOMMENDATION ... 74
5.1. Conclusion ... 74
5.2. Recommendation ... 75
LIST OF TABLES
LIST OF FIGURES
No. Caption Page
2.1. Conceptual model of DSS ... 9
2.2. The components of information system ... 15
2.3. Traditional information system development cycle ... 17
2.4. Prototyping developmet stages ... 17
4.10. Physical condition of database on information system environment... 51
4.11. Retrieving data using syntax on physical database ... 53
4.12. Main page of the system ... 53
4.13. Displaying company profile of industry ... 54
4.14. DSS tool to assess forestry industry performance ... 55
4.15. Login page of the system ... 56
4.16. List of data input for Forest Product Manufacture Sub Diretorate ... 57
4.17. Testing of system diagram ... 58
4.18. Form to input a new data ... 58
4.19. Plotting the industry location ... 59
4.20. Selecting criteria to view data inputted on the system ... 60
4.21. Finding and zoom in the industry location ... 60
THE DEVELOPMENT OF DECISION SUPPORT SYSTEM (DSS) FOR MONITORING AND EVALUATING FORESTRY INDUSTRY
LUTHFAN IBRAHIM DJUNAEDI
GRADUATE SCHOOL
THE DEVELOPMENT OF DECISION SUPPORT SYSTEM (DSS) FOR MONITORING AND EVALUATING FORESTRY INDUSTRY
LUTHFAN IBRAHIM DJUNAEDI
A Thesis submitted for the degree of Master of Science Of Bogor Agricultural University
MASTER OF SCIENCE IN INFORMATION TECHNOLOGY FOR NATURAL RESOURCES MANAGEMENT
GRADUATE SCHOOL
ABSTRACT
LUHFAN IBRAHIM DJUNAEDI (2007). The Development of Decision Support System (DSS) for Monitoring and Evaluating Forestry Industry. Under the supervision of KUDANG BORO SEMINAR and I NENGAH SURATI JAYA.
The uncertainty of wood material supply has become a major problem for Indonesia forestry industry. This is due to the imbalance between the diminished sustainable capacity of the forest and forestry industry in raw material.
To overcome industry material problem, Government (Department of Forestry) has established regulation number 34/2002 about forestry industry revitalization. By this regulation, Government attempts to revitalize and to push industry to use material efficiently, to improve wood product value, and to control industry product capacity. In order to achieve there goals, the first revitalization action has been taken by monitoring and evaluating industry i.e.
inventorying forestry industry material requirement, reregistering industry licenses and administration requirements, and perform an evaluation of forestry industry performance.
Within the implemented obligations, there are some problems that need to be identified and overcome. The existing system for monitoring and evaluation is time consuming and costly and introduces discrepancy of decision making among sub directorates on Department of Forestry.
The purpose of this research is to develop decision support system that improves the current system used by Government, for monitoring and evaluating forestry industry.
ACKNOWLEDGMENT
Initially, the author would like to express his gratefulness to Allah SWT for the favors and mercies during the time. He wishes to thank to his supervisor Dr. Ir. Kudang Boro Seminar, M.Sc and his co-supervisor Dr. Ir. I Nengah Surati Jaya, M.Agr; for the guidance, advices, comments, encouragement and also constructive criticism during the supervision of his research, throughout the research period.
He wishes also to thank and give most appreciation to MIT student’s batch 2004 for the togetherness, assistance, and the enlightenment they shared for all this time. Highly appreciation is also extended to the staff of the Master of Science in Information Technology for Natural Resources Management (MIT) Program for the good cooperation and facilitation, special thanks also to MIT lectures for sharing and imparting their knowledge and experiences during the time.
Finally, the author deeply wishes to express his most gratefulness to his beloved fiancée, Rossy Almaida Nasution, S.Hut, for her support, patient and care during his study. Thanks also extended to his Mom, Dad, Brother, and Rahmatsyah family, for their support and caring.
CURRICULUM VITAE
Luthfan Ibrahim Djunaedi was born in Bogor, West Java, Indonesia at August 27, 1978. He spent most of his childhood and school from elementary to SMU at Bogor. He achieved his undergraduate degree from Bogor Agricultural University (IPB), Faculty of Forestry, Bogor in 2003 majoring in Forest Product Technology.
Research Title : The Development of Decision Support System (DSS) for Monitoring and Evaluating Forest Industry
Name : Luthfan Ibrahim Djunaedi Student ID : G.051040071
Study Program : Master of Science in Information Technology for Natural Resources Management
Approved by, Advisory Board
Dr. Ir. Kudang Boro Seminar, M.Sc Dr. Ir. I Nengah Surati Jaya, M.Agr Supervisor Co – Supervisor
Endorsed by,
Program Coordinator Dean of Graduate School
Dr. Ir. Tania June, M.Sc Prof. Dr. Ir. Khairil A. Notodiputro, MS
TABLE OF CONTENTS
2.1. Indonesia’s Forestry Industry Development ... 3
2.2. Performance Assessment of Indonesia Forestry Industry ... 5
V. CONCLUSION AND RECOMMENDATION ... 74
5.1. Conclusion ... 74
5.2. Recommendation ... 75
LIST OF TABLES
LIST OF FIGURES
No. Caption Page
2.1. Conceptual model of DSS ... 9
2.2. The components of information system ... 15
2.3. Traditional information system development cycle ... 17
2.4. Prototyping developmet stages ... 17
4.10. Physical condition of database on information system environment... 51
4.11. Retrieving data using syntax on physical database ... 53
4.12. Main page of the system ... 53
4.13. Displaying company profile of industry ... 54
4.14. DSS tool to assess forestry industry performance ... 55
4.15. Login page of the system ... 56
4.16. List of data input for Forest Product Manufacture Sub Diretorate ... 57
4.17. Testing of system diagram ... 58
4.18. Form to input a new data ... 58
4.19. Plotting the industry location ... 59
4.20. Selecting criteria to view data inputted on the system ... 60
4.21. Finding and zoom in the industry location ... 60
4.23. Performance assessment form on DSS ... 62
4.24. Performance assessment test resulted ... 63
4.25. Supplier material planned by industry ... 64
4.26. Identification the supplier on material realization ... 64
4.27. Detecting the exceed material supplied... 66
4.28. Identifying validity license of forest product examiner ... 67
4.29. Detecting production that exceed the product capacity allowance ... 68
4.30. Mapping the material sources distribution ... 69
LIST OF APPENDIX
I.
INTRODUCTION
1.1. Background
The uncertainty of wood material supply has become a major problem for Indonesia’s forestry industry. The large imbalance between the diminished sustainable capacity of the forest and forestry industry for raw material need has known as the reason behind the problem. Factually, this condition has been reported by Department of Forestry based on study in 1998 where the capacity supplies of natural forest was only 19 million m3, conversely, industry raw material demand was exceed 60 million m3.
To overcome industry material problem, Government (Department of Forestry) has established regulation number 34/2002 about forestry industry revitalization. From this regulation, Government attempted to revitalize and create industry which efficient in material used, to improve wood product value, and to control industry product capacity. To achieve those goals, the first revitalization action was taken by monitoring and evaluating industry performance based on criteria and indicators regulated on P.17/2004.
Within the revitalization actions, there were some problems that have been identified. The current industry monitoring and evaluation system, unfortunately, is time consuming and costly and sometimes emerge discrepancy among decision maker within sub-directorate in Ministry of Forestry.
evaluating forestry industry. This research is expected to contribute Government in supporting decision making.
1.2. Objectives
The main objective of this research is to develop a Decision Support System (DSS) tool for monitoring and evaluating forestry industry.
1.3. Scope of Research
II. LITERATURE
REVIEW
2.1. Indonesia’s Forestry Industry Development
From the beginning, the existence of Indonesia forestry industry was expected to cover domestic wood demand, to increase the foreign exchange generation through exports, to create jobs opportunity, and to increase added value in production. These expectations were realized by the development of forestry industry in the early of 1980; started with rapid growth of various secondary industries, sawmill industries, plywood industries, pulp industries and Medium Density Fiberboard (MDF) industries; and achieve the highest increase in 1993 (Kartodihardjo, 2004). It was reported that the number of forestry industries until December 1982 were consisted of 171 units plywood industries and 393 units of sawmill industries (Department of Forestry, 1985).
The increasing number of forestry industry, undoubtedly, was affected by the cheap and abundance of wood material (Kartodihardjo, 2004). Government policies in log export ban, free opened of foreign and domestic investment in forestry effort, and vertical integration in Indonesia forestry micro organization were also stimulated the growth of Indonesia forestry industry (Nugroho, 2001).
1618 units of sawmill industries (Department of Forestry, 2000). However, the numbers was decreased in 2002 into 1540 units; consisted of 327 units of plywood and 1213 unit of sawmill industries (Department of Forestry, 2002).
The uncertainty of wood material supplies has become a major problem for Indonesia forestry industry. The large imbalance between the diminished sustainable capacity of the forest and the seemingly unlimited appetite of forestry industry for raw material necessary has known as the reason behind the problem. Factually, this condition has been reported from study in 1998 where the capacity supplies of forest nature was only 19 million m3, conversely, industry raw material demanded was exceeds 60 million m3 (Ibrahim, 2003).
Moreover, highest decrease of forest covers has also influenced the sustainability material supply of forestry industry. FAO and Department of Forestry (1990) reported that the average of forest degradation reaches 1,298,200 hectare per year or 1,20% in 1982 – 1990 period, and increase 2,804,000 hectares in 2005 (Kompas, 2006). The difficulty situation in material supply, however, pushed industry to operate below their capacity setting and obtained their supply from illegally material (Iskandar, 2004).
performance based on criterion and indicators regulated on P.17/2004 (Greenomics, 2004).
However, the revitalization actions can not be smooth to be carried out due to the disintegrated policy and authority between central government and regional government. This can be realized from different authority in publication license. Regional government through the Governor, has an authority to publish license for sawmill industry which have product capacity less than or equal 2000 m3 or has range product capacity between 2000 and 6000 m3. Regional government also can publish license for veneer, plywood, laminated veneer lumber, and chip wood industries with product capacity less then 6000 m3. Conversely, industry with product capacity more than or equal to 6000 m3 can have the license from Ministry of Forestry. This condition, unfortunately, creates difficulties for central government in monitoring and evaluating forestry industry, especially in data and information exchange (Greenomics, 2004).
2.2. Performance Assessment of Indonesia Forestry Industry
1. License
The criterion is used to assess the appropriateness of industry license with the established regulation; and to assess the correctness location of industry as mentioned as on the license.
2. Material supply
The criterion is used to assess the legality of supplier material and continuity of material supplied.
3. Legality of materials
The criterion is used to assess the legality document of material supplied and regularity material administration.
4. Capacity setting and allowance
The criterion is used to assess if industry capacity setting is equal or exceed their capacity allowance; and suitability industry operation with the allowed production capacity.
5. Efficiency in material used
The criterion is used to assess efficiency in material used and the attained of recovery rate.
6. Financial health
The criterion is used to assess the availability of business plan and the attained industry financial health.
7. Environmental standard quality
the impact of industry operation to environment and the availability of waste treatment unit.
8. Material planning document
The criterion is used to assess the availability of material planning document and the propriety supply of materials planned with realization.
9. Reporting
The criterion is used to assess the availability mutation report of log and product manufacture and the availability industry periodical reporting.
10.Manpower
The criterion is used to assess the availability of forest product examiner and availability agreement of employee and industry.
2.3. Decision Support System (DSS)
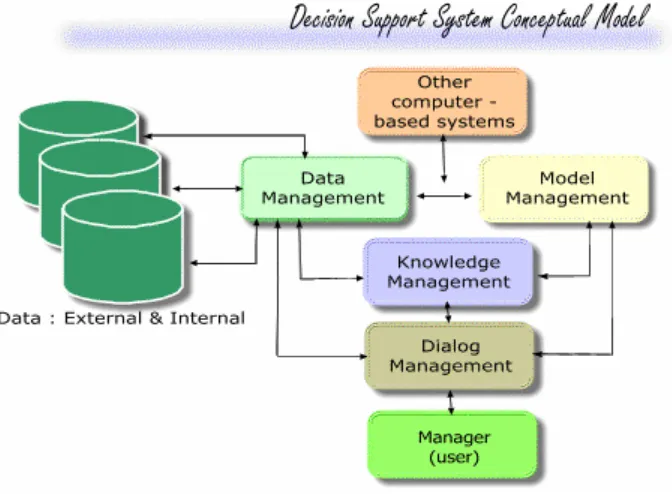
The concept of DSS was first articulated in 1970s by Scott Morton under term management decision systems as “interactive computer – based systems, which help decision makers utilize data and models to solve unstructured problems”. O’Brien (1999) defines decision support system as a major category of management support systems. They are computer-based information systems that provide interactive information support to managers during the decision-making process. A decision support system uses (1) analytical models, (2) specialized databases, (3) a decision maker’s own insights and judgments, and (4) and interactive, computer-based modeling process to support the making of semi structured and unstructured decisions by individual managers.
1. Data management. The data management includes the database, which contains relevant data for the situation and is managed by software called database management systems (DBMS).
2. Model management. A software package that includes financial, statistical, management science or other quantitative models that provides the system’s analytical capabilities, and an appropriate software management.
3. Communication (dialog subsystem). The user can communicate with and command the DSS through this subsystem. It provides the user interface. 4. Knowledge management. This optional subsystem can support any of the
other subsystems or act as an independent component.
These components constitute the software portion of the DSS. They are housed in a computer and could be facilitated by additional hardware and software pieces. Finally, the user is considered to be a part of the system. Researchers assert that some of the unique contributions of DSS are derived from the interaction between the computer and the decision maker. Figure 2.1 described a conceptual model of DSS.
Therefore, DSS are designed to be ad hoc, quick-response system that are initiated and controlled by managerial end users. Decision support systems are thus able to directly support the specific types of decisions and the personal decision-making styles and needs of individual managers.
other graphics displays that support decisions affecting the geographic distribution of people and other resources (O’Brien, 1999).
Figure 2.1. Conceptual model of DSS (Turban,1995)
2.3.1. Multi Criteria Decision Making
Project managers are faced with a complex decision environments and problems in their projects. The elements of the problems are numerous, and inter-relationships among the elements are extremely complicated. Relationships between elements of a problem may be highly nonlinear; changes in the elements may not be related by simple proportionality. Furthermore, human value and judgment systems are integral elements of a project (Al – Harbi, 1999 in Jayarsa, 2005).
criterion in supporting the decision process. The aim of MCDM methods is to help decision makers learn about the problems they face, to learn about organizational values and objectives, and through exploring these in the context of the problem to guide them in identifying a preferred course of action (Al-Harbi, 1999 in Jayarsa, 2005). In other words, MCDM is useful in circumstances which necessitate the consideration of different course of action, which can not be evaluated by the measurement of a simple, single dimension.
The evaluation of forestry industry based on regulation number P.17/2004 is involves of many criterions and indicators. Criterions here are consisting both qualitative and quantitative. It can say that the evaluation of forestry industry is a multiple criteria decision making process.
Commonly used MCDM methods in decision making are ranking and rating. These methods assign the weight for each criterions and use weighted aggregation for the analysis outcomes (Prakash, 2003). The evaluation of forestry industry has been arranged on regulation number P.17/2004. The evaluation is carried out by assessing parameters which are included in each criterion and indicator. The parameters has been weighted and scored based upon a rigorous definition of priorities. Forestry industry performance then will be categorizing based on the aggregate scored of preferred options.
2.4. Database
and keys. Record is a group of related fields that stores data about the subject, called the master record or activity, which is known as the transaction record (Power, 2000). In general, it has five characteristics (United Nations, 1996), i.e.
(1) flexibility of the design; (2) availability of a controlled and standardized approach to data input and updating; validation check in maintaining the integrity and consistency of the data elements; (4) availability of a security level; and 5) capability to minimize redundancy of data.
A Database Managements System (DBMS) is software that defines a database, stores the data, supports a query language, produces reports, and creates data entry screens. A DBMS performs three basic functions; it enables storage of data in the database, retrieval of data from the database, and control of the database.
2.4.1. Storage
DBMS vary the configuration of the stored data. Mainframe systems store many large files, each containing many records, each record containing many data items, and the data items containing many characters. The systems for microcomputer offer more constrained capacities because of limited primary and secondary spaces.
2.4.2. Retrieval
data customize the output (e.d., reports or graphs) in terms of heading and spacing.
2.4.3. Control
Much of the control activity of the DBMS is invisible to users. The users ask for some information and receive it without knowing the process that the DBMS has performed.
There are some capabilities of DBMS in a DSS (Turban, 1995) are : 9 Captures/extract data for inclusion in a DSS database;
9 Quickly updates (adds, deletes, changes) data records and files; 9 Interrelates data from different sources;
9 Quickly retrieves data from a database for queries and reports;
9 Provides comprehensive data security (protection from unauthorized access,
recovery capabilities, etc);
9 Handles personal and unofficial data so that users can experiment with
alternative solutions based on their own judgment;
9 Performs complex retrieval and data manipulation tasks based on queries; 9 Tracks usage of data.
2.4.4. Three – Step in Database Design
Relationship (ER) model is one of the most prevalent of all conceptual design tools (Shekhar and Chawla, 2003). Conceptual modeling deals with the question on how to describe in a declarative and reusable way the domain information of an application, its relevant vocabulary, and how to constrain the use of data, by understanding what can be drawn from it. Entity – Relationship Analysis uses three major abstractions to describe data, these are (Hawryszkiewycz, 1994):
• Entities, object that have independent physical or conceptual existence. • Relationship, which are meaningful interactions between the entities,
and
• Attributes, which are the properties of the entities and relationship.
The second step, also called the logical modeling phase, is related to the actual implementation of the conceptual data model in a commercial DBMS. The logical model is the translation of the software independent conceptual model into a record structure defined in a particular Data Description Language (DDL). Nowadays, non spatial data are usually stored in relational databases and therefore the logical modeling consists of the design of tables in correspondence with the conceptual model. In logical model, data requirements in order to implement the method will be identified (Shekhar and Chawla, 2003).
2.5. Information System
What is a system? A system can be simply defined as a group of interrelated or interacting elements forming a unified whole. A system is a group of interrelated components working together toward a common goal by accepting inputs and producing outputs in an organized transformation process. Such a system (sometimes called dynamic system) has three basic interacting components or functions (O’Brien, 1999) :
• Input involves capturing and assembling elements that enter the system to
be processed. For example, raw materials, energy, data, and human effort must be secured and organized for processing;
• Processing involves transformation processes that convert input into
output. Examples are a manufacturing process, the human breathing process, or mathematical calculations;
• Output involves transferring elements that have been produced by
transformation processed to their ultimate destination. For example, finished products, human services, and management information must be transmitted to their human users.
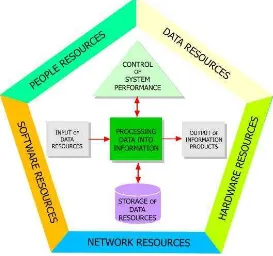
According to O’Brien (1999), an information system depends on the resources of people (end users and IS specialists), hardware (machines and media), software (programs and procedures), data (data and knowledge bases), and networks (communication media and network support) to perform input, processing, output, storage, and control activities that convert data resources into information products. Figure 2.2 illustrated the components of an information system.
Figure 2.2.The components of information system (O’Brien,1999) 2.5.1. Information System Development
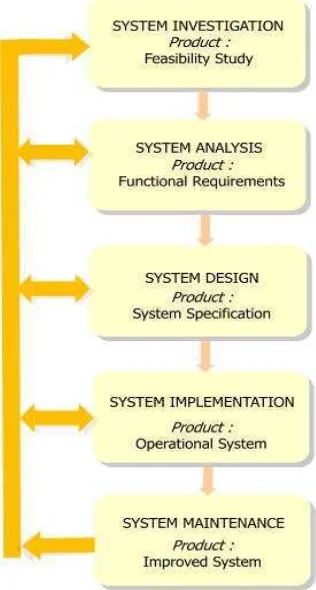
information specialists design information systems based on an analysis of the information requirements of an organization. Thus, a major part of this process is known as systems analysis and design. Using the systems approach to develop information system solutions involves a multi steps process called the information systems development cycle, also known as the systems development life cycle (SDLC). Figure 2.3 illustrates each stage of this process, which includes the steps of (1) investigation, (2) analysis, (3) design, (4) implementation, and (5) maintenance.
In many cases, the traditional SDLC have to be modified because of its limitation, such as costly and time consuming, inflexible and discourage change, and ill-suited to decision making (Hoffer, 2002 in Jayarsa, 2005). One alternative solution is to develop prototyping. According to O’Brien (1999), prototyping is the rapid development and testing of working model, or prototypes, or new application in an interactive, iterative process that can be used by both systems analysts and end user. Prototyping is an interactive process that combines stages of the traditional systems development (Figure 2.4).
Figure 2.3. The traditional information system development cycle (O’Brien,1999)
2.6. Geographic Information System (GIS)
A Geographic Information System (GIS) is a powerful tool for handling spatial data. It is used for storing, retrieving, maintaining, manipulating, analyzing, and producing the digital format of spatial data. Moreover, it could produce a spatial data in a hard – copy format (Aronoff, 1991).
In GIS environment, there are two kinds of common data that should be taken into account, i.e. spatial data and non-spatial data. Spatial data provides information about the feature referred to the geometrical orientation, shape, size and relative position from other features. Non-spatial data (usually called attribute) is information complementary to spatial data which provides some further information (United Nations, 1996).
In today’s natural resource management environment, it is common to see GIS used to assist natural resource managers in making decisions. GIS allows map production processes to be automated and repeated, reducing a lengthy drafting exercise to a few minutes. In addition, GIS allows some process to be accomplished that would normally tax a person’s analytical abilities (Bettinger, 2004).
Figure 2.5. Functional components of a GIS (de By, 2000)
III.
RESEARCH METHODOLOGY
3.1. Time and Location
This research has been conducted on March until July 2006 and takes location on Directorate General of Forest Production Management, Department of Forestry, Jakarta. For the purpose of this research, data was collected on Forest Production Management Directorate General, consists of forestry industry data in 33 Indonesia provinces, i.e. Nanggroe Aceh Darussalam, North Sumatera, West Sumatera, Riau, Riau Islands, Jambi, Bengkulu, Bangka Belitung, South Sumatera, Lampung, Banten, Jakarta, West Java, Central Java, Yogyakarta, East Java, Bali, NTB, NTT, West Kalimantan, East Kalimantan, Central Kalimantan, South Kalimantan, North Sulawesi, Gorontalo, Central Sulawesi, West Sulawesi, South Sulawesi, Maluku, North Maluku, West Irian Jaya, and Papua.
3.2. Data Sources
In general, there are two types of data used on this research : (a) spatial data, and (b) non – spatial data.
3.2.1. Spatial data.
1. Natural and plantation forest concession digital map (vector data); year 2005. The data was obtained from Badan Planologi, Department of Forestry.
2. Indonesia village digital map (vector data); year 1995. The data was obtained from Biro Pusat Statistik (BPS), Jakarta.
3.2.2. Non Spatial Data
Non spatial data was used as a basic design of forestry industry database system. The data was collected from forestry industry data report, available on Forest Production Management Directorate General. There are several sources of non spatial data used on this research, consists of :
1. Forestry industry data report obtained from Balai Sertifikasi Pengusahaan Hasil Hutan (BSPHH) years 2003 and 2004;
2. Material document report (RPBBI ~ Rencana Pemenuhan Bahan Baku Industri);
3. Forestry industry performance assessment (Lembaga Penilai Independen - LPI Mampu) report year 2003 ;
4. Reregistering report (Daftar Ulang Industri – DUI) of forestry industry year 2004.
3.3. Selected Tools
3.3.1. Hardware
The minimum specifications of hardware used to support development process of the system are :
9 Windows XP operating system run on PC Pentium IV class with minimum
1.9 GHz ;
9 RAM 256 MB or more
9 SVGA screen with minimum resolution 1024 x 768 pixels
3.3.2. Software
There are 3 (three) groups of software that used in developing this system, which are :
A. Operating System
Operating Systems (OS0 used in designing this system are Microsoft Windows 2000 Professional or Microsoft Windows XP Professional edition.
B. Developer Software
Microsoft Visual Basic 6.0 and ESRI MapObjects 2.1 were used to develop decision support system and application of information system.
C. Database Software
D. Application Software
ESRI ArcView 3.x is used to process spatial data, such as plotting a location of forest industry, location of supplier, administrative boundary, roads and forest concessions area.
3.4. Methodology
Research methodology was adopting the prototyping stages of system development by the reason of limitation cost and time, inflexible and discourages change, and ill-suited to decision making i.e. analysis, design, and implementation. Stages of the research were illustrated on Figure 3.1.
Figure 3.1. Research stages
3.4.1. Analysis Stage
The identification problems were done by analyzing the disadvantages in current system of forestry industry organization data report and forestry industry performance assessment system. The analyses were focused to the management data report on each sub directorate and technical assessment system of forestry industry performance, especially for the availability of DSS in assessing forestry industry.
User needs identification is one of important steps that must be done in order to implement and to design the system. User needs identification is a systematic look at how the system concept and design can serve the user needs. Some interviews and discussions have been conducted on each sub directorate, i.e.
how the system can be used and facilitating the data exchange between sub directorates, how the GIS can be implemented to show the industry location, how the performance of forestry industry can be automatically assessed, and identify the data that needs to be stored.
3.4.2. Design Stage
Design stage is a continuation of the analysis stage. In general, this stage answers how the system to be developed and accomplishing the requirements on analysis stage that specifies what a system should to do to meet the need of users. The design stage consists of analysis of hardware, software and DSS method required design for user interface, and code used on the system developed.
Identification of software and hardware required was done by analyzing the possibility software and hardware that suitable to be used for developing the system. The software required, however, should be able in constructing the database system, supporting the GIS application and maintaining the system operation. On the other side, the hardware required should be compatible with the software used and able for running the system.
Based on user need identification, the DSS was needed for assessing the performance of forestry industry. The DSS method was determined to use the available assessment method based on regulation number P.17/2004 about Procedure in Assessing Sawmill, Chip wood, Veneer, and Plywood industries. On the available regulation, the evaluation was carried out by assessing parameters which are consisting on each criterion and indicator. The parameters has been weighted and scored based upon a rigorous definition of priorities. The performance of forestry industry then categorized according to the aggregate weighted value of preferred parameters.
3.4.3. Implementations Stage
The implementation stage on this research consists of software and hardware selection, development of database, code construction, and testing the programs. Software and hardware used for developing the system was selected based on the analysis of software and hardware requirement; mentioned on the Analysis Stage. The software and hardware selected shown on sub chapter 3.4. The selection of software and hardware was considered to the scope of research, their availability on Department of Forestry and also the ability of developer in mastering the software.
creating the map application. Selected software has been used for generating the syntaxes used to query data and load the map.
Testing was done by installing and running the system on personal computer. Data inputting and editing has been done in the prototyping testing. The DSS prototyping was tested by assessing forestry industry through involvement of the director of each sub directorate. Training has also been done for the operator computer of the system implemented. Two (2) operators have been located on Production Sub Directorate and Marketing and Industry Assessment Sub Directorate and one (1) operator (administrator) positioned on
IV.
RESULT AND DISCUSSION
This chapter discusses the resulted of each research stage as described on Chapter III (Methodology). Overall, this chapter consists of three major phases, which are the analysis stage, design stage, and implementation stage of the system.
4.1. Analysis Stage
4.1.1. Problems Identification in Current System
The Government efforts on monitoring and evaluating forestry industries have been established to enforce industries to report their annual material requirements known as Rencana Pemenuhan Bahan Baku Industry (RPBBI). This report was used to monitor and to analyze forestry industries material needed and industries product capacity. In order to monitor the industries existence, license, and administration requirements, Government was also obligating industry to reregister their license, profile, product, capacity setting, workers utilization, and machines production of forestry industry.
The uncertainty condition of wood material supply and Government plans in revitalizing forestry industry was pushed Government to evaluate forestry industry performance. From the obligation, Government attempted to revitalize and create industry which efficient in material used, to improve wood product value, and to control industry product capacity.
implementation, Government has been placed LPI Mampu as the independent organization to evaluate and assess the forestry industry actions.
The analysis stage was carried out for identifying problems in current system of monitoring and evaluation of forestry industry. The analyses were focused to the management of forestry industry data report and the technical monitoring and evaluation system of forestry industry performance. In order to overcome the current system problems and to design the system proposed, the user needs identification was done by interviewing the potential users.
The following are several problems identified in current system of monitoring and evaluation of forestry industry :
A. Time and Cost Inefficiency
LPI Mampu is the independent organization that selected by Government for evaluating forestry industry performance. In accomplishing their evaluation, the highest cost and time was needed for surveying and assessing the industry. This fact can be seen from the data described on Table 4.1.
Table 4.1. Time and cost for assessing forestry industry by LPI Mampu
No. LPI Mampu Forest Industry Cost PT. Batasan, West Kalimantan 137 7 experts 36 days PT. Retrindo Nusantara, East
Java 123 7 experts 36 days
PT. Putra Setia Utama Timber,
Jambi 159 7 experts 36 days Source : LPI Mampu, PT. Alam Jabbar Indo Malik, 2003
used to accomplish the evaluation. Data reported that the number of forestry industries that has been surveyed by LPI Mampu until 2006 consists of 98 forestry industries where the numbers of forestry industry that identified has a capacity more than 6000 m3 was achieved 294 (Department of Forestry, 2005). By calculating the remainder of industry that was not surveyed yet, the estimation cost for assessing forestry industry achieves 26,754 billion rupiah.
B. Disintegrated Data Handling
In structural, forestry industry data reported are handled by three (3) sub directorates : (1) Production Sub Directorate, which handles material used and production reports; (2) Marketing and Industry’s Assessment Sub Directorate; focus in market product report; and (3) Forest Product Manufacture Sub Directorate, which handles forestry industry data license, machines used in production, workers and production capacity reports.
The different scope in data handled between sub directorates, however, was caused asymmetric information and may cause some discrepancy in decision making. This situation was occurred because of different authority between sub directorates in evaluating forestry industry. The fact was realized when Forest Product Manufacture Sub Directorate extend the license period of industry, on the contrary, Production Sub Directorate identified the illegally of material used. However, the regulation was set that industry which identified used the illegal material can not lengthens their license.
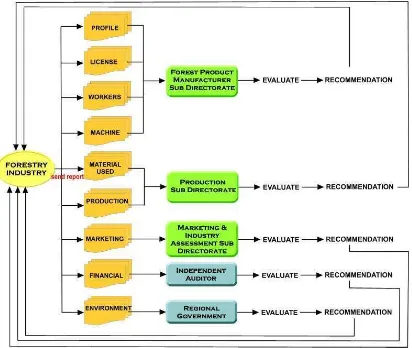
Figure 4.1. Flow of current reporting system
Figure 4.1 describes the flow of current reporting system of forestry industry data. The flow was begun with the report that submitted by forestry industry to each sub directorate and handled based on their scope authority. Problem was arised when sub directorate offering a recommendation to the industry based on data handled without discerning others sub directorates. However, this situation may rise differ decision.
C. The need of DSS in evaluating forestry industry
process was carried out by assessing alternatives or set of options consists on criterion and indicator. Here, the alternatives have been weighted and scored based upon a rigorous definition of priorities. A set of performance ratings has also been determined in order to categorizing the industry performance. By summative the score on the preferred options then the industry performance can be defined.
In the assessment performance implementation, especially for assessing industry which has a capacity more than 6000 m3, LPI Mampu was the selected performer of assessment. LPI Mampu will survey industry based on criterion and indicator of the assessment, assessing the forestry industry performance, and reporting the resulted to Marketing and Industry Assessment Sub Directorate.
Based on process and technique of current system assessment as mentioned above, there are several problems identified in current system assessment consist of :
1. Currently, the assessment performance of forestry industry was still done manually. There was no system available for automatically ranking, scoring and categorizing industry performance.
2. The process of assessment was done based on LPI Mampu survey without involving the functionality of each sub directorate.
This introduces discrepancy of decision making among sub directorates.
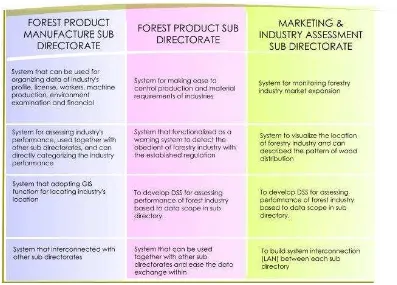
4.1.2. User Needs Identification
user on the system developed. There are three (3) potential user of the system included of : (1) Forest Product Manufacture Sub Directorate; (2) Production Sub Directorate; (3) Marketing and Industry’s Assessment Sub Directorate. The user needs identification resulted can be illustrated on Figure 4.2.
Figure 4.2. Results of user needs identification
Figure 4.2 describes the results user needs identification on each sub directorate. In general, there are four (4) kinds of user needs identified i.e. :
1. To develop database system for organizing forestry industry data based on scope of each sub directorate data handled;
3. To develop a decision support system tool for evaluating forestry industry performance;
4. To develop an interconnection area (e.g., LAN - Local Area Network) for facilitating data exchange between sub directorates.
4.1.3. Data Inventory
There are two (2) sources of data used on this research, consists of spatial and non spatial data as mentioned on Chapter III, sub chapter 3.2. Spatial data was used for plotting the location of forestry industry and forestry industry’s supplier; overlay and display the location of natural and plantation forest concessions; and used to show material distribution pattern of forestry industry. Non spatial data was used as a basic design of forestry industry database system.
Due to different sources of data used on the system developed, especially for non spatial data (tabular data), then standardization and segregation data were done in order to design the database. The standardization and segregation of data was discussed on sub chapter 4.2.1 (Database Design).
4.2. Design Stage
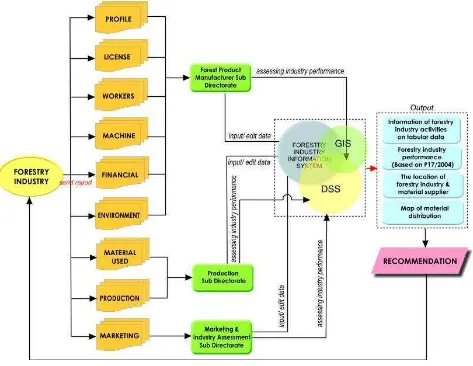
Figure 4.3. Workflow on proposed system
4.2.1. Database Design
Database design is an important part in developing an information system. The information quality resulted is depended on the quality of database management (design). There are several steps that have been done for designing the database of forestry industry :
1. Data Preparation
Data preparation was carried out in order to design the database of forestry industry. Data preparation consists of standardization of spatial data and segregation of non spatial data (tabular data). Standardization data was done to obtain the same format and scale of spatial data. The standard data then used to design map application on system proposed. Segregation of non spatial data was needed for structuring and designing database fields’ format. This step was carried out considering different source of data used. For accommodating the user needs, the field of tabular data used on the system proposed has been inventoried and discussed with the end users. Figure 4.4 described the standardization and segregation data used on the proposed system.
2. Process Modeling
Figure 4.4. Data preparation
and the location of industry; (2) Production Sub Directorate, uses the system to monitor, evaluate, and organize forestry industry data i.e. production, wood material requirements, and the location of industry; (3) Marketing and Industry Assessment Sub Directorate, uses the system to monitor, evaluate, and organize forestry industry data; especially in forestry industry marketing and also the location of industry.
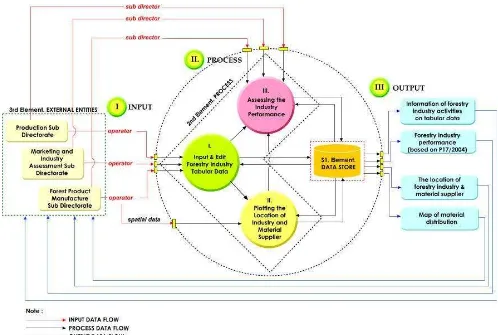
Figure 4.5. Context diagram (level 0) of the developed system
Figure 4.6. Data flow diagram level 1 of the developed system
performance, the external entities (Sub Director of Forest Product Manufacture, Sub Director of Production, and Sub Director of Marketing and Industry Assessment) were used the system and data that have been inputted (as defined on the first and second process). Referring to the overall process, there are several outputs provided, i.e.: (1) Information of forestry industry activities; (2) Forestry industry performance; (3) Location of forestry industry and material supplier; (4) Map of material distribution. All those output were used to monitor and evaluate forestry industry by the external entities.
3. Conceptual Model
A conceptual model used to describes the data content on the system proposed. On conceptual model, the data was drawn into Entity – Relationship (E – R) diagram and use a symbol to illustrate the relationship between data. The E – R diagram consists of entities, relationships between entities, and attribute of entities. The E – R diagram is used to represent the meaning of data.
more participating entity types. The order was expressed as one to one relationship (1:1); one to many relationship (1:M); and many to many relationship (M:M). For the relationship of entity “forestry industry” with “forestry industry product” the order can be categorized as 1 : M relationship. It means that “one industry can have many kinds of product”.
Figure 4.7. Entity – Relationship diagram of developed system
4. Logical Model
basic organization of a database. Table 4.2 described the logical model of the system developed. The table list of all files in the database, the number of records in each file, and the names of each fields.
Table 4.2. Logical data model of system developed
No Category Entity Attributes
U_Alamat_Prsh
U_Jenis_Produk Kode, jenis_produk, kelompok_industri, nomor
BB_jenisBB Kode, jenis_BB
BB_kebutuhan
IPHHK_id, jenis_produk, rendemen, kebutuhan_bb, jenis_bb, nomor
BB_Pemasok_RKT Pemasok_id, tahun, rkt, stock
BB_Pemenuhan
IPHHK_id, tahun, bulan, Jenis_BB, Realisasi, pemasok_id, jenis_kayu, kategori_pemasok, iphhk_prov, kode_bulan, nomor, satuan
BB_Prsh_Pemasok
5. Physical Design
Physical design represented the logical data model in the scheme of the software. Physical design described the data physically where every entity is set according to database software that used in system developed. The physical design of system developed shown on Appendix 1.
4.2.2. User Interface Design
User interface refers to the way a computer program presents and receives information from the users in response to user request. Designing user interface is a process application visualization and interaction between user and the system.
For the purpose of developing forestry industry monitoring and evaluation system, the selected software was utilized to design the user – friendly interface. The user interface has been designed such a way, so that it brings easiness to the user in operating the system.
The interaction between user and the system was facilitated with the easy selection button. User can use the buttons in order to display map and information requested. The analytical tools i.e. zoom in, zoom out, and pan was also provided in order to help the user in analyzing the location of forestry industry. The user interface of the developed system can be seen in Appendix 2.
4.2.3. DSS Design
Sawmill, Chip wood, Veneer, and Plywood industries. There are 10 criteria presented on the regulation, consists of : (1) Industry license; (2) Material requirements; (3) Legality of materials; (4) Capacity setting and product allowance; (5) Efficiency in materials used; (6) Industry financial health; (7) Environment standard quality; (8) RPBBI document; (9) Periodical report availability; (10) Workers used. On establishing regulation, several indicators are available on each criterion where several parameters existing on each indicator. There are 21 indicators and 69 parameters used to assess forestry industry performance.
In the process of performance assessment, Government has been grouped the indicators into three (3) category, consists of :
(1) Precondition indicators, defined as the indicators that must be fulfilled by industry. When industry can not complete one of the indicators, the industry is directly defined on a worse category. There are seven (7) indicators identified as the precondition category, consists of :
a. Propriety of industry license with the regulations;
b. Propriety industry location with the location existed on the license; c. All industry materials supplied is secured with a legal document; d. Industry environment friendly operation;
e. The availability of materials planning document (RPBBI);
f. The availability of Laporan Mutasi Kayu Bulat (LMKB) and Laporan Mutasi Kayu Olahan (LMKO) data report;
(2) Principal indicators, defined as the indicators that should be completed by the industry. When industry can not complete one of the indicators, the industry is not directly defined on a worse category. There are eleven (11) indicators included on this category, consists of :
a. Material is supplied from legal supplier; b. Continuity in supplied materials;
c. Reliability of wood administration;
d. Industry capacity setting is not exceed the allowance capacity; e. Industry operation is proper with allowance capacity product; f. Efficiency in materials used;
g. Industry achieves the recovery rate of production; h. Availability of environment impact assessment report; i. Availability of waste unit treatment;
j. Propriety of material plans and realization; k. Availability of periodical activities report;
(3) Contribute indicators, used to assess industry activities that contribute to the industry effort. There are three (3) indicators included on this category : a. Availability of business plan;
b. Attaining of financial health;
Figure 4.8. Schema on performance assessment procedure
Range of assessment performance value was set into several categories performance, consists of :
A. Very good, if the total weighted value is more than 80 and less and equal 100 and fulfilling the criterion and indicator on precondition and principal indicators category;
B. Good, if the total weighted value is more than 60 and less and equal 80 and fulfilling the criterion and indicator available on precondition and principal indicators category;
D. Bad, if the total weighted value is more than 20 and less and equal 40 and fulfilling the criterion and indicator on precondition indicators category;
E. Worse, if the total weighted value less and equal 20 or not fulfilling one of the criterion and indicator on precondition indicators category. The system has been developed an automatically assessment based on procedure described in Figure 4.8. The rules of performance assessment on developed DSS can be illustrated on Figure 4.9.
The rule of performance assessment was set based on criteria, indicators and parameters established on P.17/2004. The assessment begun when the potential users ((Sub Director of Forest Product Manufacture, Sub Director of Production, and Sub Director of Marketing and Industry Assessment) use and input their assessment through the system. When industry assessed can not complete one of precondition indicators, then the system will automatically defines the industry performance on worst category. In the contrary, the system will directly calculating the weighted value on precondition, principal, and contribute indicators based on preferred parameters. The total weighted value then used to define the industry performance category refer to the classification range of value.
4.2.4. Software and Hardware Requirements
Identification of software and hardware required was done by analyzing the possibility software and hardware that suitable used for developing the system. In development process of the system, software required to construct the database system, to support the GIS application, and to develop the DSS and Information System.
However, each database has unique strengths and weakness that should be considered to be selected.
GIS is the essential system that can provides information about the feature referred to the geometrical orientation, shape, size and relative position from other features. On process development of the system, GIS was used to provide visual information related with forestry industry location. The GIS software required to process forestry industry data spatial i.e plotting the location of forestry industry and organizing non spatial data (attributes) related with the feature of spatial data.
The process development of DSS and Information System used software to construct the programming language and operating the system. Here, the programming language is utilized to create functions for querying or retrieving data from a relational DBMS, to generate a connection function on DBMS, and used to design the user interface.
In order to support the development process and to test the application work properly, the suitable hardware is required. Mainly, hardware selected is related with their capacity and capability specification for storing the data and to hold the program code (RAM – Random Access Memory), capability in interpreting computer programs instructions and processes data (Processor), and specification of the analog computer display standard (VGA – Video Graphic Array). Those specifications were become a reference in selecting the suitable hardware.
4.3. Implementation Stage
4.3.1. Hardware and Software Selected
Based on hardware and software requirement analysis, the hardware and software selected use on development process of the system was described on Sub Chapter 3.4.
Microsoft Access has been selected to be used for developing the database system. The capability of Microsoft Access in visualizing, manipulating tabular data, and querying relational data used as a basic consideration for selecting this software. Microsoft Access uses a database engine that can store data directly and also can mediate storage and retrieval of data using other engines i.e. Microsoft Visual Basic for Applications (VBA) code for creating advanced customizations. The maximum file size of Microsoft Access that achieves 2 gigabytes (minus the space needed for system objects) and 32,768 maximum numbers of objects in a database considered as a suitable selection to build forestry industry database.
ESRI ArcView has been selected to process forestry industry spatial data. The selections were based on the ability of the end users in operating the software and software suitability for developing the system.
software was combined with Microsoft Visual Basic and Microsoft Access using an ActiveX control (OCX) and a set of over twenty ActiveX Automation objects.
4.3.2. Database Implementation
In database implementation, each table on physical design has been translated into physical condition on information system and decision support system environments as seen on Figure 4.10.
4.3.3. Code Constructing A. Information System
In general, the physical database as illustrated in Figure 4.11 created by coding it in a programming language written on Microsoft Visual Basic. The syntax was coded and used to create a connection and functions for storing, retrieving and controlling data.
Simple Code
Set Cnn = New ADODB.Connection Cnn.CursorLocation = adUseClient
strCNString = "Data Source= " & tanda & ""
Cnn.Provider = "Microsoft Jet 4.0 OLE DB Provider" Cnn.ConnectionString = strCNString
Cnn.Properties("Jet OLEDB:Database Password") = "mahoni" Cnn.Open ch.Text = "Allowance Capacity" ch.Width = 1500
ch.Alignment = lvwColumnRight Set ch = lstPrimer.ColumnHeaders.Add() ch.Text = "Unit"
ch.Width = 1000
ch.Alignment = lvwColumnCenter Set ch = lstPrimer.ColumnHeaders.Add() ch.Text = "Rendemen (%)"
ch.Width = 1500
ch.Alignment = lvwColumnRight Set rs = New ADODB.Recordset
rs.CursorLocation = adUseClient rs.CursorType = adOpenStatic rs.LockType = adLockReadOnly Set rs1 = New ADODB.Recordset
rs1.CursorLocation = adUseClient rs1.CursorType = adOpenStatic rs1.LockType = adLockReadOnly
rs.Open "SELECT * FROM U_izin_kapasitas WHERE iphhk_id = '" & CurrentID & "'" _
& "AND kode_produk = '" & kode_prod & "' ", Cnn
Figure 4.11. Retrieving data using syntax on physical database
By referring to Figure 4.3, main page of the system was created by coding and designing in a programming language. This main page is equipped with map to indicate the location forestry industry and forestry industry supplier. Main page allow user to explore the map just like using other map viewer software. User can do zoom in and zoom out to the map and also gathering information from the map by using information tool as described in Figure 4.12.
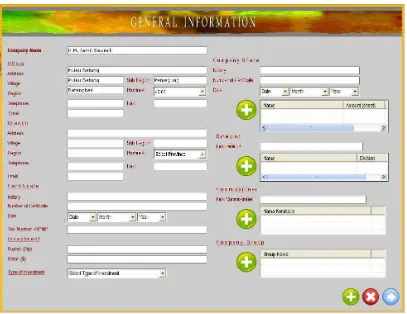
Main page also allow user to find out the information of forestry industry (company profile, licenses, materials, production, machine, labors, financial, environment, reporting, and performance) by selecting to the intended industry and list information as described on Figure 4.13.
Figure 4.13. Displaying company profile of industry
B. Decision Support System Tool Constructing
For constructing DSS tool in order to evaluate forestry industry performance, the capability of Microsoft Visual Basic 6.0 as programming language has been explored. Figure 4.14 shows form of DSS tool for assessing forestry industry performance.
Sub Chapter 4.2.3 (DSS Design). The result can be seen by selecting
Performance on information list presented in main page of the system.
Figure 4.14. DSS tool to assess forestry industry performance
4.3.4. Testing
A. Data Inputting Through the System
Testing was done by running the prototype into one personal computer and inputting data of forestry industry. In order to access into the system, the users will be asking to enter their username and password on login page. Figure 4.15 shows the login page for the user.
based on scope of their data report handled. In order to distinguish access of the users, different username and password has been implemented on the system login.
Figure 4.15 Login page of the system
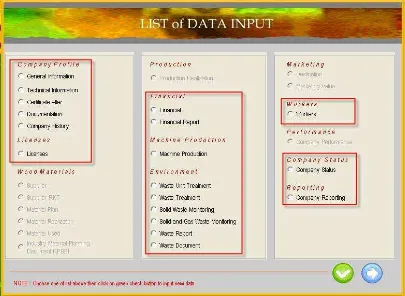
Limitation of data access between sub directorate applied for data input and data edit through the system. For the implementation, list of data input has been set to be active based on the user access. Figure 4.16 describes list of data input that can be access by Forest Product Manufacture Sub Directorate.
Figure 4.16. List of data input for Forest Product Manufacture
Sub Directorate
Figure 4.17. Testing system diagram
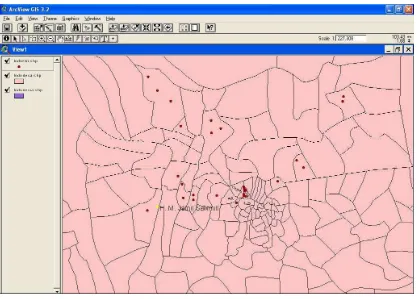
After the general data of forestry industry has been inputted through the system, location of industry then plotted into the villages map area by processing it on ESRI ArcView. Plotting was based on the address of industry i.e. name of village, sub region, and region provided on company profile data. Figure 4.19 describes the process of plotting location of industry.
Figure 4.19. Plotting industry location
Figure 4.20. Selecting criteria to view data inputted on the system
When all criterions have been selected, then the system will find and zoom in automatically to the intended industry location as described on Figure 4.21.
B. Forestry Industry Performance by Using DSS Tool
Testing the DSS tool for assessing industry performance was done by running the prototype into one personal computer on Marketing and Industry’s Assessment Sub Directorate. On structural, this directorate has an authority to assess the industry performance, however, the system was designed to involve others sub directorates on Forest Production Management Directorate General in assessing the performance. Figure 4.22 describes the diagram testing of DSS tool.
Figure 4.22. DSS diagram testing
Figure 4.23. Performance assessment form on DSS
Figure 4.24. Performance assessment test resulted
4.3.5. System Capability
For supporting the decision making of the end users in monitoring and evaluating forestry industry, the system also provide some capabilities, consist of :
1. Detecting the properly of planning and realization material supplier.
suppliers that have been identified on industry material realization as described on Figure 4.26.
Figure 4.25. Supplier material planned by industry
2. Detecting the volume of material supply that exceeds the annual allowable cutting (RKT).
The annual allowable cutting refers to the volume of wood (trees) that permit to be cutting in a year. Mainly, the volume is refers to the amount of industry material supply. This system has been designed to detect the production (wood) material that exceeds the allowable cutting. This system can calculate and detect the total volume of supplied material and the supplier that exceeds the allowable cutting. Figure 4.27 describes how the system works in detecting the volume of material supply that exceeds the annual allowable cutting (RKT).
Figure 4.27. Detecting the exceed material supplied (green rectangle)
3. Detecting the validity license of forest product examiner
Figure 4.28. Identifying validity license of forest product examiner
4. Detecting production that exceed the product capacity allowance
Figure 4.29. Detecting production that exceed the product capacity allowance
5. Mapping the material distribution
In order to support decision making related with trend in wood material distribution, the system has been designed to visualize it by adopting the capability of GIS. Map of material distribution was developed to identify sources of material and supporting analysis to indicate the potential forest supply on each province as seen on Figure 4.30.
(inside) and others provinces (outside). The comparison of source material supplied (inside and outside province) was informed on a form by clicking one of the analytic tools (yellow rectangle).