DOI: 10.12928/TELKOMNIKA.v14i2A.4321 274
Campus Network Management Scheme of Wireless
Network User Data Mining
Tang Xiaokang*1, Jeong Nyeo Kim2 1.
Information construction and management office of Guangdong University of Finance and Economics, Guangzhou Guangdong 510320, China
2.
Raytheon Company, San Diego, USA *Corresponding author, e-mail: [email protected]
Abstract
To improve the coverage rate of wireless sensor network node in the campus and prolong network lifetime, an optimization method for network node coverage based on escape particle swarm algorithm has been proposed on the basis of analyzing defects of basic particle swarm optimization algorithm. Firstly, with network coverage rate as optimization objective, escape particle swarm algorithm is adopted for solving and genetic algorithm crossover mechanism is introduced during the solving process to maintain the diversity of particle swarm and prevent “precocity”. In addition, momentum algorithm is adopted to smooth particle searching path, accelerate convergence rate and finally performance of the algorithm is tested through simulation experiment.
Keywords: Campus network; Wireless sensor network; Coverage optimization; Particle swarm algorithm; Crossover operation
1. Introduction
Campus wireless sensor net works (CWSN) is composed of a lot of inexpensive sensor nodes with limited energy, self-organization, communication capacity, calculation capacity and perception capacity. They are often deployed in battlefields, deserts and other dangerous environment and it is impossible to charge sensor nodes or replace battery. Network coverage optimization is to obtain better network lifetime as far as possible under the condition of obtaining higher coverage, which becomes a basic problem and a challenge [1] in WSN application. Domestic and foreign scholars conducted a lot of researches into WSN coverage optimization and proposed some coverage optimization algorithms [2-6]. Traditional algorithms include graph theory and centralized WSN node coverage optimization algorithm. It is assumed in graph theoretic approach that one sensor node can be found for any point in WSN target area. As sensor nodes are distributed randomly, sometimes this assumption is not necessarily tenable; centralized algorithm is of no expansibility and is only applicable to small-scale WSN. In consideration of “precocity”, local optimum and other defects of particle swarm algorithm, a WSN coverage optimization algorithm for self-adaptive escape particle swarm optimization is proposed. Simulation results show that IPSO has better overcome defects existing in basic particle swarm optimization algorithm to rapidly find the optimal coverage scheme of WSN node, improve CWSN coverage optimization efficiency and prolong network lifetime [6-10].
2. Description of CWSN Coverage Optimization
Suppose to-be-monitored area of WSN is a two-dimensional plane and several nodes are placed in it randomly. All nodes are of the same performance. Then coverage area of node position (xi,yi) can be deemed as a circle with coordinate of sensor node as center and r as radius, namely ci=(xi,yi,r). Where, r perception radius is and set of corresponding WSN nodes is: C={c1,c2,…,cN} [11].
Monitoring area of CWSN can be uniformly divided to m×n pixel points with coordinates expressed with (x,y). Then the distance between node ci and target pixel point is:
2 2
( ,i ) ( i ) ( i )
Suppose ri is the event of (x,y) covered by node and the probability of (x,y) to be covered by ci is
cov
1,
( , )
{ }
( , , )
0
i
i i
if d c p
r
P r
P
x y c
ot her wi se
(2)In consideration of noise and environmental impact, the probability distribution of node is 1 2 1 1 cov 2 2
1
( , )
(
)
( , , )
( , )
0
i e
i i e
if d c p
r r
e
P x y c
if d c p
r
r
ot herwi se
(3)
Where, re is reliability parameter of node measurement, 0<re<r; α1, α2, β1 and β2 are parameters related to node characteristics; λ1 and λ2 are input parameters.
The calculation formula of λ1 and λ2 is:
1
r
er
d c p
( , )
i
(4)2
r
er
d c p
( , )
i
(5)Joint measurement probability of multiple sensor nodes is
ov
cov ov cov
c
(
)
1
(1
( , , ))
i
i c
P
C
P
x y c
(6)Where, Cov is sensor node set.
Regional coverage rate of node set C (Rarea) represents the ratio between coverage area of node set C and total area of monitoring area, then
cov
ovarea
P
C
R
c
m n
(7)3. Self-Adaptive Escape Particle Swarm Optimization Algorithm
PSO is a swarm intelligence optimization algorithm for simulation of foraging behavior of bird flock, which achieves the purpose of swarm optimization through individual cooperation. Each particle in PSO represents a candidate solution for solving problem. Firstly, a particle swarm is initialized and new particle swarm is generated through iteration. During each iteration, the speed and position of particle i are updated with Equations (8) and (9) [12].
1 1
2 2
(
1)
( )
(
( ))
(
( ))
i i i i
g i
v t
w v t
c r
p
x t
c r
p
x t
(8)(
1)
( )
( ))
i i i
x t
x t
v t
(9)Where, n is particle quantity in population; t is number of iterations; c1 and c2 are learning factors; r1 and r2 are random numbers in [0,1]; w is inertia weight.
(
1)
(1
)
( )
( ))
i i i
x t
mc
x t
mc v t
(10)Where, 0≤mc<1.
Equation (5) is actually to smooth the motion curve of particle with low pass filter, namely so-called momentum particle swarm optimization algorithm [13-16].
The smoothness effect of motion curve of particle by low pass filter is shown in Figure 1, where dotted line indicates input and black solid line indicates output. It can be known from Figure 1 that the bigger
mc
is, the better smoothness effect there will be. In the initial stage of PSO, to prevent particle from vibration and maintain diversity of particle in later stage, the particle can conducted refined local searching. Largermc
can be set up in initial stage and smallermc
can be set up in later stage. Generally, the maximum value ofmc
can be set up to be 0.9, with minimum value of 0.4 During iteration,mc
varies linearly with step length from maximum value to minimum value [17, 18].
(a)
mc
0.98
(b)mc
0.9
Figure 1. Smoothness effect of low pass filter
4. Research Method
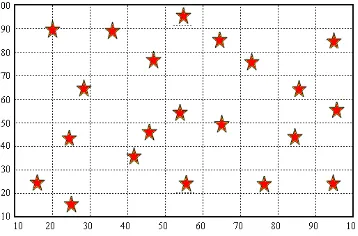
Assuming that the working area of CWSN is a square with size of 100m×100n, specifically as shown in Figure 2, where “★” indicates node position, the design process for CWSN node coverage optimization of IPSO is as follows
(1) As for a pixel point, the coverage rate for all nodes is calculated according to Equation (3)-Equation (5).
(2) As for a pixel point, the joint coverage rate for all nodes is calculated according to Equation (6).
(3) The above procedure is repeated continuously to obtain the joint coverage rate of all pixel points in CWSN working area for all nodes.
(4) The coverage rate of CWSN working area is calculated according to Equation (8) and calculation results are taken as optimized objective function of CWSN coverage optimization.
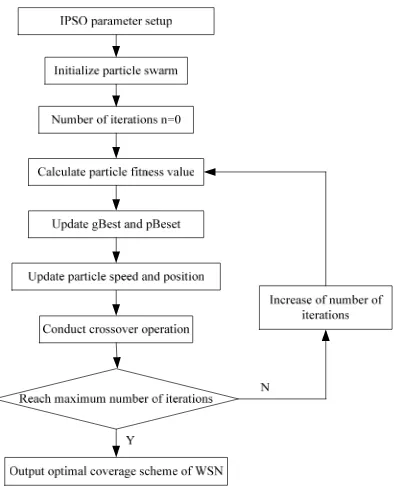
Suppose the particle swarm contains m particles and each particle represents D-dimensional sensing nodes. Different particles are located in different places which correspond to the coverage rate of WSN network. As for particle i, Xi represents its position and Xi=(X1,X2,X3,…,Xd). At the same time, the particle has a speed vector, expressed as Vi=(V1,V2,V3,…,Vd). The historical optimal position of the particle is expressed as Pi=(pi1,pi2,pi3,…,pid); the historical optimal position of the particle swarm is Pg. With Equation (6) as the objective function of CWSN coverage optimization, then the work flow diagram of IPSO algorithm is shown in Figure 3.
Figure 3. Coverage optimization process of WSN node
(1) Initialize particle swarm.
(2) Update speed and position of each particle according to Equations (8) and (10). (3) Calculate fitness value of each particle according to Equation (6) to obtain WSN node coverage rate corresponding to each particle.
(4) Compare the coverage rate of particle and the coverage rate corresponding to historical optimal pBest. If it is superior to pBest, pBest shall be replaced with position of the particle.
(5) Compare the coverage rate of particle and the coverage rate corresponding to historical optimal gBest. If it is superior to gBest, gBest shall be replaced with position of the particle.
(6) Stop optimization if stopping conditions have been met and return to the node coverage rate corresponding to optimal particle of particle swarm as output, or return to Step (2) for further optimization.
5. Simulation Experiment 5.1. Simulation Environment
45 sensor nodes are placed in the 100m×100m square area randomly and the initial position of sensor node is shown in Figure 4. The perception radius of all nodes is r=3m and communication radius is C=2r=6m. The maximum number of iterations of particle swarm is 500, mc=0.4, c1=c2=[2 5], vmax=0.90, η=2.
Figure 4. Node distribution in monitoring area
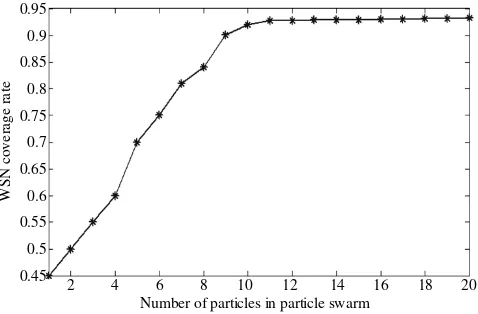
5.2. Selection Size of Particle Swarm
As small size of particle swarm (population number) has enormous effect on algorithm performance, superior number of particle swarm is firstly selected. The variation curve of population size and WSN coverage rate is shown in Figure 5.
0.95 0.9 0.85 0.8 0.75 0.7 0.65 0.6 0.55 0.5 0.45
W
S
N
c
o
ve
ra
ge
r
a
te
2 4 6 8 10 12 14 16 18 20 Number of particles in particle swarm
Figure 5. Variation relationship between number of particle swarm and WSN coverage rate
5.3. Result and Analysis
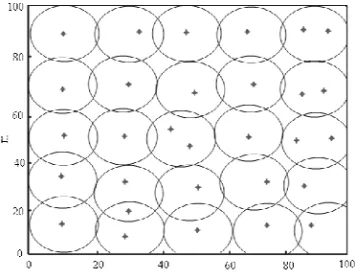
(1) Comparison of Coverage Performance for CWSN Sensor Node Before and After PSO Improvement: Node deployment of optimal coverage scheme of PSO algorithm is shown in Figure 6. It can be known from Figure6 that the node deployment and distribution of PSO is extremely non-uniform with extremely serious node redundancy and many node repetitions. The node utilization rate is only 78% and average coverage rate is 89.7%.
Figure 6. Node deployment for optimal coverage scheme of PSO algorithm
Node deployment for optimal coverage scheme of IPSO algorithm is shown in Figure 7. It can be known from Figure 7 that IPSO sensing node deployment is of low density and relatively uniform almost without redundant node in the research. The node utilization rate is about 82.5% and average coverage rate is 93.7%, increasing by 4% than PSO coverage rate. Comparison results show that IPSO algorithm introduces crossover mechanism to maintain diversity of particle swarm and prevent PSO “precocity”. At the same time, momentum algorithm is introduced to smooth particle searching path, accelerate convergence rate of particle swarm, better solve defects existing in PSO and obtain superior CWSN node coverage scheme.
Figure 7. Node coverage for optimal scheme of IPSO algorithm
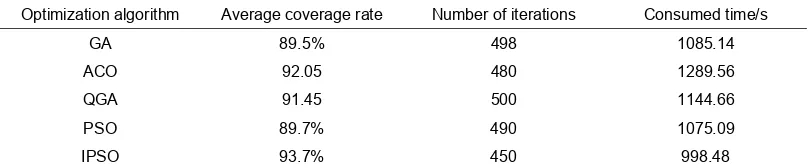
Table 1. Performance comparison of different coverage optimization algorithms
Optimization algorithm Average coverage rate Number of iterations Consumed time/s
GA 89.5% 498 1085.14
ACO 92.05 480 1289.56
QGA 91.45 500 1144.66
PSO 89.7% 490 1075.09
IPSO 93.7% 450 998.48
It can be known from Table 1 that the average coverage rate of IPSO algorithm is higher than comparison algorithm and has more uniform node distribution. It has less number of iterations to obtain optimal WSN node coverage scheme, with the fastest convergence rate, the shortest consumed time and relatively balanced node energy consumption. It can satisfy instantaneity of WSN node coverage optimization, improve network performance and has certain superiority.
6. Conclusion
In consideration of defects of PSO algorithm, to improve coverage rate of CWSN node, network node coverage optimization method based on escape particle swarm algorithm is proposed. Simulation results show that compared with other coverage optimization algorithms, IPSO algorithm reduces network uniformity, improves network coverage rate and can achieve the purpose of obtaining higher coverage performance with limited sensor nodes.
Acknowledgement
The scientific research project supported by Guangdong University of Finance and Economics (No. 14GLL52001).
References
[1] He J, Geng Y, Wan Y, Li S, Pahlavan K. A cyber physical test-bed for virtualization of RF access environment for body sensor network. Sensors Journal, IEEE. 2013; 13(10): 3826-3836.
[2] Jiang D, Xu Z, Lv Z. A multicast delivery approach with minimum energy consumption for wireless multi-hop networks. Telecommunication Systems. 2015: 1-12.
[3] Lin Y, Yang J, Lv Z. A self-assessment stereo capture model applicable to the internet of things. Sensors. 2015; 15(8): 20925-20944.
[4] Ying Liang. Satisfaction with Economic and Social Rights and Quality of Life in a Post-Disaster Zone in China: Evidence from Earthquake-Prone Sichuan. Disaster Medicine and Public Health Preparedness. 2015; 9(2):111-118.
[5] Qishen Zhou, Zuowei Yin, Qiu Ying, Shanhui Wang. Intelligent Data Mining and Decision System for Commercial Decision Making. TELKOMNIKA Indonesian Journal of Electrical Engineering. 2014; 12(1): 792-801.
[6] Ying Liang. Correlations between Health-Related Quality of Life and Interpersonal Trust: Comparisons between Two Generations of Chinese Rural-to-Urban Migrants. Social Indicators Research. 2015; 123(3): 677-700.
[7] Ying Liang, Peiyi Lu. Medical insurance policy organized by Chinese government and the health inequity of the elderly: longitudinal comparison based on effect of New Cooperative Medical Scheme on health of rural elderly in 22 provinces and cities. International Journal for Equity in Health. 2014; 13(1): 1.
[8] Ying Liang, Demi Zhu. Subjective Well-Being of Chinese Landless Peasants in Relatively Developed Regions: Measurement Using PANAS and SWLS. Social Indicators Research. 2015; 123(3): 817-835.
[9] Jinyu Hu and Zhiwei Gao. Distinction immune genes of hepatitis-induced heptatocellular carcinoma. Bioinformatics, 2012, 28(24): 3191-3194.
[10] T Sutikno, M Facta, GRA Markadeh. Progress in Artificial Intelligence Techniques: from Brain to Emotion. TELKOMNIKA Telecommunication Computing Electronics and Control. 2011; 9(2): 201-202.
[12] Jiang D, Ying X, Han Y. Collaborative multi-hop routing in cognitive wireless networks. Wireless Personal Communications. 2015: 1-23.
[13] M Abdar, S.R.N. Kalhori, T. Sutikno, I.M.I Subroto, G. Arji. Comparing Performance of Data Mining Algorithms in Prediction Heart Diseases. International Journal of Electrical and Computer Engineering (IJECE). 2015; 5(6): 1569-1576.
[14] Geng Y, Chen J, Fu R, Bao G, Pahlavan K. Enlighten wearable physiological monitoring systems: On-body rf characteristics based human motion classification using a support vector machine. IEEE transactions on mobile computing. 2016; 15(3): 656-671.
[15] Song X, Geng Y. Distributed Community Detection Optimization Algorithm for Complex Networks. Journal of Networks. 2014; 9(10): 2758-2765.
[16] Pahlavan K, Krishnamurthy P, Geng Y. Localization Challenges for the Emergence of the Smart World. IEEE Access. 2015; 3(1): 1-11.
[17] Ying Liang, Xiukun Wang. Developing a new perspective to study the health of survivors of Sichuan earthquakes in China: a study on the effect of post-earthquake rescue policies on survivors’ health-related quality of life. Health Research Policy and Systems. 2013; 11(1): 1.