Research Article
The Effect of Perforation on the Dynamics of a Flexible Panel
A. Putra, Y. M. Cheah, N. Muhammad, A. Rivai, and C. M. Wai
Centre for Advanced Research on Energy, Universiti Teknikal Malaysia Melaka, Hang Tuah Jaya, 76100 Durian Tunggal, Melaka, MalaysiaCorrespondence should be addressed to A. Putra; [email protected]
Received 22 May 2014; Revised 29 August 2014; Accepted 31 August 2014; Published 17 September 2014
Academic Editor: Akira Ikuta
Copyright © 2014 A. Putra et al. his is an open access article distributed under the Creative Commons Attribution License, which permits unrestricted use, distribution, and reproduction in any medium, provided the original work is properly cited.
Introduction of holes into plate-like structures is commonly found as one of the practical noise control measures to reduce sound radiation. However, perforation also reduces the panel stifness and hence increases its vibration. he discussion on this efect is lacking and hence this paper discusses the dynamics of a perforated panel from the results obtained from Finite Element (FE) model. Diferent hole geometries and arrangement are simulated to investigate their efect on the plate mobility. In general, it is found that increasing the perforation ratio increases the plate mobility. For a ixed perforation ratio, the mobility increases at high frequency (above 1 kHz) for a smaller hole density in the plate. he plate with holes concentrated at the middle shows the largest increase of vibration around the plate centre compared to those uniformly distributed or away from the middle and concentrated at the plate edges. his is because as the hole separation becomes smaller, the reduction of the global stifness around the mid area of the plate becomes greater. his also corresponds to the inding here that the mobility is greater at the vicinity of the hole. Diferent conditions of the plate edges are found to give consistent trend of the efect of perforation.
1. Introduction
he vibration of engineering structures, particularly those consisting of thin plate-like members, can be a signiicant source of noise in many situations. It is common in noise control technique to reduce the sound radiation of such structures directly by constructing them from perforates. his technique is known to be capable of reducing considerable noise radiation and has found many practical applications, including safety guard enclosures over lywheels and produc-ing collection hoppers.
However, the efect of perforation on the plate dynamics is rarely discussed, at least in terms of change in the vibration level due to perforation. he recent models [1,2] to calculate the sound radiation from a perforated panel also ignore this efect. he investigation of the efect of perforation on dynamic properties of plates began in the early 1960s in order to determine an accurate stress analysis of perforated panels used to support the tubes in a heat exchanger [3, 4]. To obtain equivalence with the actual properties corresponding to a solid plate, the efective material properties were deined,
namely, efective Young’s modulus, efective Poisson’s ratio, and efective density.
Soler and Hill [5] later proposed an analytical formula to calculate the bending stifness of a perforated panel as a function of hole geometry. he formula, however, is only valid for small perforation ratio. Forskitt et al. [6] used the Finite Element Method (FEM) to obtain the dynamic properties, namely, Young’s modulus and Poisson’s ratio of a perforation with circular holes. he density is calculated based on the fraction of a solid plate. hese properties are then used to calculate the natural frequencies of the perforated panel.
develop an efective resonant frequency formula from simu-lation data for ive perforated plates using FEM. he formula was a function of the so-called mass remnant ratio (MR), that is, the ratio of surface area of a perforated plate to that of the solid plate for the same dimension. he formula was then expressed as a seventh order polynomial function of MR. However, the formula was applicable only for the irst three modes of vibration.
Recently, Mali and Singru [9] proposed a technique using concentrated negative mass in the Galerkin method to model the natural frequency of a perforated plate. It is shown that the analytical results are in good agreement with those from a FEM model, but only for small size of holes.
As previous works were concerned with only the dynamic properties of the perforation, this paper investigates the change of vibration level due to the introduction of holes into a solid panel. As no established analytical model is available to calculate the mobility of the perforation, the numeri-cal model is therefore implemented using Finite Element Method (FEM). he numerical calculation of mobility of the perforation is then compared against that of the solid plate in one-third octave band frequency.
2. Mobility
2.1. heoretical Model. Mobility is deined as the ratio between the vibration velocityVand the excitation force� given as a function of frequency,�(�) = V(�)/�(�). For a inite rectangular plate with dimensions� × �, the mobility at an arbitrary point(�, �)subjected to a point force�at(��, ��)
where � is the �th mass-normalized mode shape of the structure, �� is the �th natural frequency, and � is the damping loss factor. A case oten considered is that of a rectangular plate with simply supported boundary conditions as this system provides a simple analytical solution. For a simply supported rectangular plate, the mode shape can be represented by sine functions. his and the natural frequency for mode(�, �)are, respectively,
Φ��(�, �) = 2√�sin(���� )sin(���� ) ,
���= √ �� [(��� ) 2
+ (��� )2] ,
(2)
where�is the total mass of the plate,�is the mass per unit area, and� = ��3/12(1 −V2)is the plate bending stifness for� is Young’s modulus,�is the plate thickness, and � is Poisson’s ratio. he next section discusses the FE model used to calculate the mobility of the perforated plate.
x
X =excitation and
response point
Figure 1: Schematic diagram of the panel and the excitation point.
2.2. Finite Element (FE) Model
2.2.1. Validation with heory. he model of the perforated panel is developed here using PATRAN and NASTRAN sotware programs. In order to ensure the FE model used is valid in terms of the element size and setting of the boundary condition, the result is validated against the theoretical mobility as in (1).
A FE model of a solid panel having dimensions of 0.3× 0.2 m and thickness 1 mm is developed with simply supported condition along all the edges. he panels are made of aluminium having Young’s modulus of 70 GPa, density of 2700 kg m−3, and Poisson’s ratio of 0.3. he 2D shell elements are used to model plate structures where a shell structure car-ries loads in all directions and therefore undergoes bending and twisting, as well as in-plane deformation [11].
he mesh element type used in the FE model is the basic two-dimensional triangular element (Tria shape and Paver). he element size is set to be much smaller than half of the structural wavelength corresponding to the maximum fre-quency of analysis to give accurate results at high frequencies. he global edge length of each element is set to be 0.003 m which is suicient to provide accurate result up to 5 kHz. he plate was set to be an ideal simply supported boundary condition, where the displacement is restrained at the plate edges, but the rotation is set to be free. he location of the excitation force and the response are the same for all simulated plates for consistency of plate mobility analysis.
M
o
b
ili
ty (m/N
s)
FE model Theory
Frequency (Hz)
101 102 103
100
10−1
10−2
10−3
(a)
Frequency (Hz)
FE model Theory
−100
−90 −80 −70 −60 −50 −40 −30 −20 −10
101 102 103 104
M
o
b
ili
ty (db
re
1
m/N
s)
(b)
Figure 2: Comparison of mobility of a solid panel from FE model and from analytical calculation: (a) narrow band and (b) one-third octave band.
(a) (b)
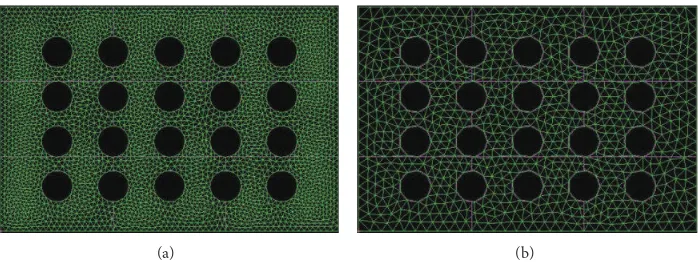
Figure 3: Examples of the Finite Element model of the perforations with diferent mesh size represented by the global edge length (GEL): (a) GEL = 3 mm and (b) GEL = 10 mm.
can be observed, but the average level is almost the same as seen in one-third octave band frequencies inFigure 2(b).
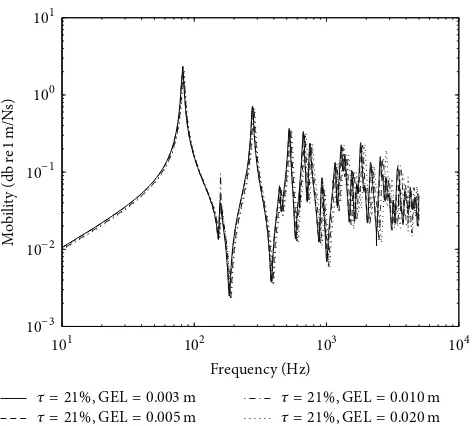
In order to ensure the right meshing is used in this study, the efect of the size of the mesh is also investigated by simulating the mobility of a perforated panel with diferent global edge length (GEL) of the mesh.Figure 3shows two examples of the FE model with diferent meshing size. Figure 4plots the mobility for four diferent GELs. It can be observed that the results for perforated plates with GEL = 3 mm and 5 mm have the same results which collapse together for the corresponding frequency range. For larger GEL, that is, GEL = 10 mm and GEL = 20 mm, the mobility shits to higher frequency. hus, for the rest of the simulation, GEL = 5 mm is used in this study.
2.2.2. FE Model for Perforated Panels. he simulated sam-ples of perforated panels are determined by varying the perforation ratio with ixed diameter or number of holes
Table 1: Parameters of the perforated panel with ixed hole diameter and diferent number of holes and perforation ratio.
Name Number of holes Diameter (mm)
Perforation ratio (%)
P40-10-5 40 10 5
P80-10-5 80 10 10
P160-10-5 160 10 21
Frequency (Hz)
101 102 103 104
100
10−1
10−2
10−3
𝜏 = 21%,GEL= 0.003m
𝜏 = 21%,GEL= 0.005m
𝜏 = 21%,GEL= 0.010m
𝜏 = 21%,GEL= 0.020m
M
o
b
ili
ty (db
re
1
m/N
s)
Figure 4: Mobility of a solid plate with diferent global edge length of the mesh.
Table 2: Parameters of the perforated panel with diferent hole diameter and number of holes and ixed perforation ratios.
Name Number of holes Diameter(mm) Perforation ratio(%)
P20-20-10 20 20 10
P40-14-10 40 14 10
P80-10-10 80 10 10
P20-28-21 20 28 21
P30-23-21 30 23 21
P40-20-21 40 20 21
P20-34-30 20 20 30
P30-28-30 30 34 30
P58-20-30 58 28 30
Table 3: Parameters of the perforated panel with ixed number of holes and diferent hole diameter and perforation ratio.
Name Number of holes Diameter (mm)
Perforation ratio (%)
P40-10-5 40 10 5
P40-14-10 40 14 10
P40-15-12 40 15 12
P40-20-21 40 20 21
the plate, each perforated plate is named according to its parameter, where the irst part of the numbers indicates the number of holes, the second part is the diameter, and the third part is the perforation ratio. he plate parameters are chosen to represent any possibilities of perforation coniguration in practice.Figure 5shows examples of the Finite Element (FE)
Table 4: Parameters of the perforated panel with diferent hole distributions.
Name Number of
holes
Diameter (mm)
Perforation ratio (%)
P40-14-10 40 14 10
P40-14-10-edge 40 14 10
P40-14-10-center 40 14 10
P20-28-21 20 28 21
P20-28-21-edge 20 28 21
P20-28-21-center 20 28 21
Table 5: Parameters of the perforated panel with diferent hole arrays.
Name Number of
holes
Diameter (mm)
Perforation ratio (%)
P40-14-10 40 14 10
P41-14-10-tria 40 14 10
P40-20-21 40 20 21
P41-20-21-tria 40 20 21
model of perforated panels from PATRAN sotware with the mesh condition as described inSection 2.2.1.
(a) (b)
(c) (d)
(e) (f)
(g) (h)
Figure 5: Examples of the Finite Element model of the perforations. Fixed hole diameter: (a) P40-10-5 and (b) P80-10-10; ixed perforation ratio: (c) P20-20-10 and (d) P40-14-10; diferent hole arrangement: (e) P40-20-21 and (f) P41-20-21; diferent hole distribution: (g) P40-14-10-edge and (h) P40-14-10-center.
Accelerometer
Hammer
Analyser
Computer
FE model, solid
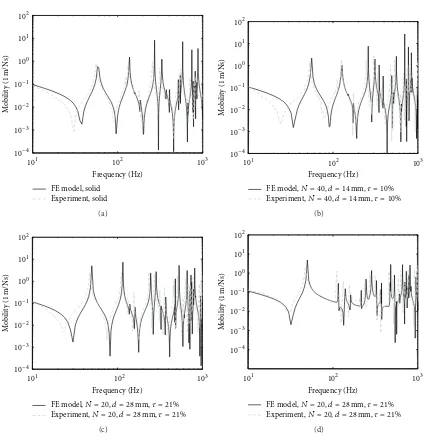
Figure 7: Comparison of the mobility for solid and perforated panels from FE model and experiment: (a) solid and (b)-(c) perforated panels at diferent perforation ratio. (d) Transfer mobility for ixed perforation ratio of 20%.
the plate acceleration. he signal was recorded and processed using Data Physics signal analyzer.Figure 7shows the results from the FE models and the experiment where satisfactory agreement is achieved. Small discrepancies occur which might be due to the nonuniformity of the panel in the experiment which is diferent from the ideal plate deined in the FE model.
3. Simulation Results and Discussion
he numerical results from the FE model are presented in one-third octave bands to observe the “average” level of mobility in a frequency band rather than to deal with details of discrepancies in the narrow band. Also for convenience
of analysis, it is of interest to observe the amount of mobil-ity level which increases due to perforation. his can be expressed with “the efect of perforation” in dB unit by
� = 20 ×log10(��
��) , (3)
where��is the mobility of the perforated plate and��is for the solid plate. he results are presented for both mobilityY and efect of perforationXpositioned side-by-side.
N = 40, d = 14mm, 𝜏 = 10%
Frequency (Hz)
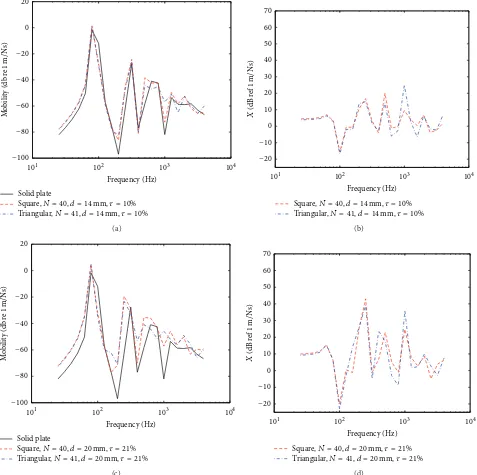
Figure 9: Mobility ((a), (c)) and efect of perforation ((b), (d)) of the perforated panels with ixed hole diameter and ixed number of holes.
he level of increment becomes greater as the perforation ratio increases. However, among the perforated plates with ixed perforation ratio, varying the hole diameter as well as the number of holes does not have signiicant change on the mobility except at high frequencies (above 1 kHz). his can also be seen in the efect of perforation�results. he variation of mobility for diferent hole diameters (with ixed perforation ratio) can be clearly observed as the perforation ratio is increased. he largest hole diameter gives the highest mobility at high frequencies. his indicates that, at high frequencies, the mobility of the perforations depends on the hole density in the panel where large hole density (many holes, but smaller) is preferred to reduce vibration. Larger
hole density has also been shown to produce the greatest noise reduction efect [1,2].
It should be noted here that the high peaks shown in the efect of perforation at low frequencies below 1 kHz, for example, at the fundamental frequency of the plate, that is, 250 Hz, are the efects due to the natural frequency shit because of perforation [7], although the level at the fundamental frequency as seen in Figure 8(e) is also increased by roughly 10 dB compared to the level at the fundamental frequency of the solid plate.
Frequency (Hz)
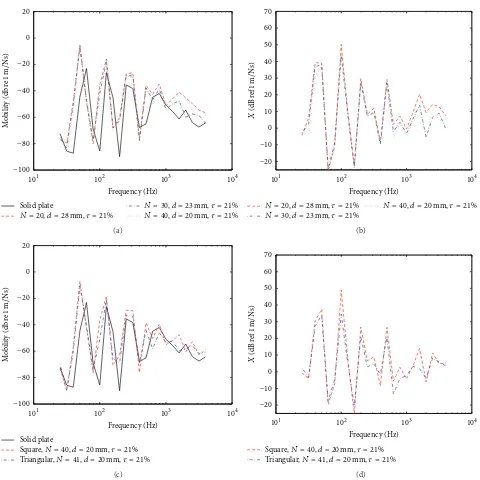
Figure 10: Mobility ((a), (c)) and efect of perforation ((b), (d)) of the perforated panels with diferent hole arrays and at ixed perforation ratio.
ratio, by maintaining the hole diameter and by increasing the number of holes, is plotted inFigure 9where, as already discussed, the mobility increases as the perforation ratio increases.Figure 9(b)shows that, for 20% perforation ratio, the mobility can increase to almost 10 dB.
3.3. Efect of Hole Arrays at Fixed Perforation Ratio. For diferent perforation arrays, that is, square and triangular, at ixed perforation ratio inFigure 10, both perforation arrays also show less signiicant efect on the plate mobility with each other. he mobility again increases as the perforation ratio is
increased (cf. Figures10(b)and10(d)). his again conirms that it is the number of holes per unit area (hole density) which afects the plate mobility, not the hole arrays.
Frequency (Hz)
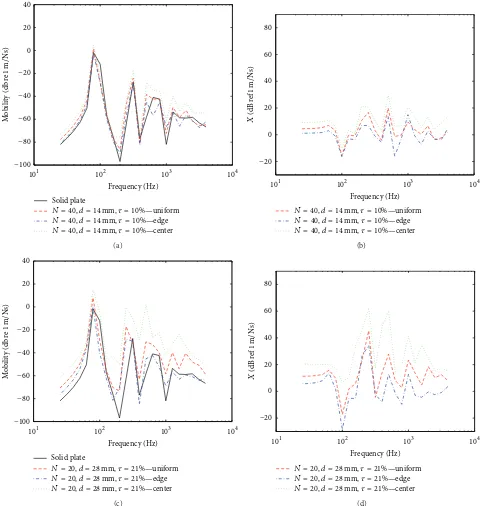
Figure 11: Mobility ((a), (c)) and efect of perforation ((b), (d)) of the perforated panels with diferent hole arrangement.
plate and the holes at the edges of the plate. he holes at the plate edges can be a useful design for a noise control measure where noise can be reduced at a particular frequency range, that is, at the edge mode region [12].
he mobility can be signiicantly increased for higher per-foration ratio for the centralized holes which can obviously be seen in the efect of perforation �in Figures11(b) and 11(d). he stifness of the plate reduces signiicantly when the concentration of the holes is moved towards the center of the
panel, but no efect is obvious from the mobility result when the holes are spread away from the center and concentrated to the plate edges.
Frequency (Hz)
Figure 12: Mobility ((a), (c)) and efect of perforation ((b), (d)) of the perforated panels for free-free edges for (a)-(b) ixed perforation ratio and (c)-(d) diferent arrays of holes at ixed perforation ratio.
to investigate the efect of the boundary conditions on the mobility of the perforated panels. For the former, in the FE model, the displacement (vertical,z-direction; see again Figure 1) and the rotation at the plate edges are allowed and, for the latter, both the displacement and rotation are constrained. hese represent two extreme conditions: the plate with completely free edges and that with completely restrained edges.
he results are shown in Figures12,13,14, and15where all the results have the same trend as those from the plate with simply supported boundary condition; that is, the mobility
increases when the perforation ratio increases, when the plate has smaller hole density, and when the holes are concentrated at the center of the plate.
Frequency (Hz)
Figure 13: Mobility ((a), (c)) and efect of perforation ((b), (d)) of the perforated panels for free-free edges for (a)-(b) ixed hole diameter with increasing perforation ratio and (c)-(d) diferent arrangement of holes at ixed perforation ratio.
separation between holes is large (Figures16(a)and16(b)). his is because the local stifness around the hole is lower compared to the one away from the hole and thus increases the mobility. As the hole separation becomes smaller, the previous “localized” stifness reduction now becomes more “global” across the plate. Hence, for larger perforation ratios, the change of the mobility due to the change of the response location is not too obvious as seen in Figures16(c)-16(d)and 16(e)-16(f).
Solid plate
Figure 14: Mobility ((a), (c)) and efect of perforation ((b), (d)) of the perforated panels for clamped-clamped edges for (a)-(b) ixed perforation ratio and (c)-(d) diferent arrays of holes at ixed perforation ratio.
the level of stress increases and almost all holes have high concentration of stress.
4. Conclusion
he mobility of perforated plates with varying holes geome-tries and perforation patterns has been investigated by using Finite Element Method. It is found that the mobility increases as the perforation ratio increases. For a ixed perforation ratio, however, the small hole density (small number, but large diameter holes) gives the most efect to increase vibration
Frequency (Hz)
Figure 15: Mobility ((a), (c)) and efect of perforation ((b), (d)) of the perforated panels for clamped-clamped edges for (a)-(b) ixed hole diameter with increasing perforation ratio and (c)-(d) diferent arrangement of holes at ixed perforation ratio.
response location at the plate can also give diferent results. For low perforation ratio or low density (low number of holes per unit area), the mobility is more sensitive around the vicinity of the hole and therefore response location around this area gives higher mobility. As the perforation ratio increases, where the holes become much closer together (higher hole density), the location of the response becomes insensitive to the mobility result. his is due to the global stifness reduction throughout the individual area of the
holes and thus throughout the surface of the plate. All these indings can be used as the general guidance in designing vibrating structures with perforated plates.
Conflict of Interests
Frequency (Hz)
101 102 103 104
−100
−80 −60 −40 −20 20
0
Mo
b
il
it
y
(
db
re
1
m
/
Ns
)
N = 40, d = 10mm, 𝜏 = 5%, point 1
N = 40, d = 10mm, 𝜏 = 5%, point 2
(a) (b)
Frequency (Hz)
101 102 103 104
−100
−80 −60 −40 −20 20
0
Mo
b
il
it
y
(
db
re
1
m
/
Ns
)
N = 40, d = 14mm, 𝜏 = 10%, point 1
N = 40, d = 14mm, 𝜏 = 10%, point 2
(c) (d)
Frequency (Hz)
101 102 103 104
−100
−80 −60 −40 −20 20
0
Mo
b
il
it
y
(
db
re
1
m
/
Ns
)
N = 40, d = 20mm, 𝜏 = 21%, point 1
N = 40, d = 20mm, 𝜏 = 21%, point 2
(e) (f)
X Y
Max3.52 + 007@Nd 261
Min1.77 + 006 @Nd 374
3.52 + 007
3.30 + 007 3.07 + 007 2.85 + 007 2.63 + 007 2.41 + 007 2.18 + 007 1.96 + 007 1.74 + 007 1.51 + 007 1.29 + 007 1.07 + 007 8.45 + 006 6.22 + 006 3.99 + 006 1.77 + 006
Default fringe:
(a)
X Y
4.23 + 007
3.96 + 007 3.68 + 007 3.41 + 007 3.13 + 007 2.86 + 007 2.58 + 007 2.31 + 007 2.03 + 007 1.76 + 007 1.48 + 007 1.20 + 007 9.29 + 006 6.54 + 006 3.78 + 006 1.03 + 006
Max4.23 + 007@Nd 517
Min1.03 + 006@Nd 32
Default fringe:
(b)
X Y
4.55 + 007
4.26 + 007 3.96 + 007 3.67 + 007 3.37 + 007 3.08 + 007 2.78 + 007 2.49 + 007 2.19 + 007 1.90 + 007 1.61 + 007 1.31 + 007 1.02 + 007 7.23 + 006 4.29 + 006 1.34 + 006
Max4.55 + 007@Nd 461
Min1.34 + 006@Nd 32
Default fringe:
(c)
he inancial support for this project is provided by the Universiti Teknikal Malaysia Melaka under the Short Term Research Grant no. PJP/2012/FKM (5C)/S01007.
References
[1] A. Putra and D. J. hompson, “Sound radiation from perforated plates,”Journal of Sound and Vibration, vol. 329, no. 20, pp. 4227–4250, 2010.
[2] A. Putra and D. J. hompson, “Radiation eiciency of unbaled and perforated plates near a rigid relecting surface,”Journal of Sound and Vibration, vol. 330, no. 22, pp. 5443–5459, 2011. [3] R. Bailey and R. Hicks, “Behavior of perforated plates under
plane stress,”Journal of Mechanical Engineering Science, vol. 2, pp. 143–161, 1960.
[4] W. J. O’Donnel and B. F. Langer, “Design of perforated plates,” Journal of Manufacturing Science and Engineering, vol. 84, no. 3, pp. 307–319, 1962.
[5] A. I. Soler and W. S. Hill, “Efective bending properties for stress analysis of rectangular tube sheets,”Journal Engineering for Power, vol. 99, no. 3, pp. 365–370, 1977.
[6] M. Forskitt, J. R. Moon, and P. A. Brook, “Elastic properties of plates perforated by cusp-shaped holes,”Applied Mathematical Modelling, vol. 15, no. 4, pp. 191–199, 1991.
[7] K. A. Burgemeister and C. H. Hansen, “Calculating resonance frequencies of perforated panels,”Journal of Sound and Vibra-tion, vol. 196, no. 4, pp. 387–399, 1996.
[8] D. C. Patil, S. S. Gawade, and K. D. Mali, “Dynamic response analysis of rectangular perforated plates with varying sizes of circular perforation holes,” inProceedings of the 2007 Interna-tional Congress on Sound and Vibration, Cairns, Australia, July 2007.
[9] K. D. Mali and P. M. Singru, “Determination of the fundamental frequency of perforated rectangular plates: concentrated nega-tive mass approach for the perforation,”Advances in Acoustics and Vibration, Article ID 972409, 2013.
[10] P. Gardonio and M. J. Brennan, “Mobility and impedance methods in structural dynamics,” inAdvanced Applications in Acoustics, Noise and Vibration, F. J. Fahy and J. G. Walker, Eds., chapter 9, CRC Press, 2004.
[11] S. S. Quek and G. R. Liu,Finite Element Method: A Practical Course, vol. 184, 2003.
Submit your manuscripts at
http://www.hindawi.com
VLSI Design
Hindawi Publishing Corporation
http://www.hindawi.com Volume 2014
Hindawi Publishing Corporation
http://www.hindawi.com Volume 2014
Hindawi Publishing Corporation http://www.hindawi.com
Journal of
Engineering
Volume 2014
Hindawi Publishing Corporation
http://www.hindawi.com Volume 2014 Shock and Vibration
Hindawi Publishing Corporation
http://www.hindawi.com Volume 2014
Mechanical Engineering
Advances in
Hindawi Publishing Corporation
http://www.hindawi.com Volume 2014
Civil Engineering
Advances inAcoustics and Vibration Advances in
Hindawi Publishing Corporation
http://www.hindawi.com Volume 2014
Hindawi Publishing Corporation
http://www.hindawi.com Volume 2014
Electrical and Computer Engineering
Journal of
Hindawi Publishing Corporation
http://www.hindawi.com Volume 2014
Distributed Sensor Networks International Journal of
The Scientiic
World Journal
Hindawi Publishing Corporation
http://www.hindawi.com Volume 2014
Sensors
Journal ofHindawi Publishing Corporation
http://www.hindawi.com Volume 2014
Modelling & Simulation in Engineering
Hindawi Publishing Corporation
http://www.hindawi.com Volume 2014
Hindawi Publishing Corporation
http://www.hindawi.com Volume 2014
Active and Passive Electronic Components Hindawi Publishing Corporation
http://www.hindawi.com Volume 2014
Chemical Engineering International Journal of
Control Science and Engineering Journal of
Hindawi Publishing Corporation
http://www.hindawi.com Volume 2014 Antennas and
Propagation
International Journal of
Hindawi Publishing Corporation
http://www.hindawi.com Volume 2014
Hindawi Publishing Corporation
http://www.hindawi.com Volume 2014
Navigation and Observation
International Journal of
Advances in OptoElectronics
Hindawi Publishing Corporation
http://www.hindawi.com Volume 2014
Robotics
Journal ofHindawi Publishing Corporation