1
A numerical analysis of transient flow past road vehicles subjected to pitching
oscillation
Cheng, S.Y.
a,b, Tsubokura, M.
a,*, Nakashima, T.
c, Nouzawa, T.
dand Okada, Y.
da
Graduate School of Engineering, Hokkaido University, Kita-13, Nishi-8, Kita-ku,
Sapporo, 060-8628, Japan.
b
Faculty of Mechanical Engineering, Universiti Teknikal Malaysia Melaka, Hang Tuah
Jaya, 76100 Durian Tunggal, Melaka, Malaysia.
c
Graduate School of Engineering, Hiroshima University, 1-4-1 Higashi-Hiroshima,
Hiroshima, 739857, Japan.
d
Vehicle Testing & Research Department, Mazda Motor Corporation, Aki Gun,
Hiroshima, 7308670, Japan.
*Corresponding author. Tel. & Fax: + 81 11-706-6723, E-mail:
Abstract
Conventionally, the pitching instability of road vehicles has been controlled mechanically through the application of suspension systems. The present study demonstrates how unsteady aerodynamics can be exploited for such control by properly configuring vehicle body shapes. To discern the effect of unsteady aerodynamics on road vehicle stability, large eddy simulation has been conducted to simulate the flow past simplified vehicle models. Forced-sinusoidal-pitching oscillation was imposed on the models during the simulation to probe their dynamic responses. Numerical results were compared with wind tunnel measurements for validation, and good agreement is attained. Unsteady flow structures above the rear section of the vehicles were found to significantly affect their pitching stability. Depending on the vehicle body shape configurations, the induced aerodynamic force tended to either enhance or restrain the vehicles‟ pitching instability.
Keywords: vehicle; transient aerodynamics; pitching; LES; stability; vortex
1. Introduction
For over a century, the aerodynamic performance of road vehicles has mainly been assessed on the basis of their drag coefficient Cd value, sometimes in conjunction with their lift coefficient Cl value,
which were obtained through steady-state wind tunnel measurements. However, these mean quantities do not adequately reflect vehicle performance with respect to unsteady aspects that are commonly encountered in real-life situations. For instance, when Okada et al. (2009) compared two production vehicles with very close Cd and Cl values (the differences between them were only 6.5 and 22.2 %,
respectively), they reported a distinct difference between the straight-ahead stability of the vehicles during a road test, as indicated by their rear-ride height fluctuation difference and straight-ahead stability sensory ratings. Also, impulsive and extreme values are ideally needed for risk calculations (Baker and Humphreys, 1996), thus the time-averaged Cd and Cl are of no use for such evaluations. Their relevance is
limited to assessing factors pertaining to fuel economy and top speed.
In real life, vehicles are subjected to time-varying forces and moments. Awareness of the important of transient aerodynamics has motivated the advancement in test facilities that expand the capability of conventional wind tunnel measurement technique. For example, Pininfarina Wind Tunnel has installed an active turbulence generation schemes to control the turbulence level of ambient wind for measuring the unsteady aerodynamics (Cogotti, 2004). Other facilities are like the flapping aerofoil employed by Bearman and Mullarkey (1994) to reproduce gusty crosswind environment, and moving test bench used by Noger et al (2005) to simulate overtaking conditions between vehicles. Interested readers may also refer to the work by Baker and Humphreys (1996) regarding the assessment of various wind tunnel techniques for obtaining vehicle aerodynamics data associated to crosswinds effects.
2
Averaged Navier-Stokes (RANS) method, the application of computational fluid dynamics in solving unsteady aerodynamics problems required the use of Large Eddy Simulation (LES) technique. The LES which is more demanding in regard to computer resources as compared to RANS, is becoming more economical due to the recent advancement in computer technology. Like the cases found in experimental (wind tunnel) study, most of the LES investigations used very simplified vehicle models, namely, the Ahmed model (e.g. Krajnovic and Davidson, 2005, Minguez et al, 2008, and Franck et al, 2009), or its variations (e.g. Verzicco et al, 2002). These studies mainly focus on the implementation of LES to capture the transient flow feature around the vehicle model which is difficult to capture by RANS or measure in the wind tunnel. Some of the study has also explored the possibility of improving the aerodynamic performance of the vehicle by changing its body shape. Another aspect of automotive aerodynamics that is still very scarce in the literature is concerning the vehicle‟s pitching characteristics. This may partly due to the difficulty involved in setting the vehicle in pitching motion during measurement. To fill in this gap, we investigated the stability characteristics of road vehicles pertaining pitching.
When a vehicle is running on the road, pitching oscillation is a commonly encountered phenomenon that may be generated either by road surface disturbances or driver operation disturbances (Sawada and Matsumoto, 2009). This is undesirable owing to its negative impact on drive comfort, control, and safety. However, this unpleasant phenomenon has been controlled mechanically through the application of suspension system, and little attention has been paid to the importance of aerodynamics concerning this matter. The present study focused on the latter, which is associated with the unsteady aerodynamic damping of pitching instability.
In principle, aerodynamic forces are a result of interaction between a vehicle‟s body and fluids surrounding it. To date, LES has been implemented successfully to assess aerodynamics performance of road vehicle, as may be evidenced in the literature (e.g., Verzicco et al., 2002; Krajnovic and Davidson, 2005; Kobayashi et al., 2008; Tsubokura et al., 2009a; Nakashima et al., 2009). In the present study, LES was applied to study the flow past simplified vehicle models representing the real passenger cars with different body shape configurations. Validation of the LES technique adopted in the present study was carried out by comparing the numerical results with wind tunnel measurements. In order to probe the dynamic responses of the vehicle models to assess their stability characteristics, sinusoidal-forced-pitching oscillation was imposed on the vehicle models during the LES. Then, the sinusoidal-forced-pitching stability tendencies predicted by the LES is compared to the road test results obtained by Okada et al. (2009) to ensure that the vehicle models successfully reproduced the trends of the real production vehicles. After the validation, the phase-averaged results were being analyzed in order to identify the mechanism of damping of pitching motion by means of unsteady aerodynamic forces.
2. Numerical Methods
2.1 Governing equations and discretization
An in-house CFD code “FrontFlow/red ver. 2.8”, which was originally developed for the “Frontier
Simulation Software for Industrial Science” project and optimized for vehicle aerodynamics simulation by Tsubokura et al. (2009b), was adopted in the present study. The code has been validated successfully in the previous works (Tsubokura et al, 2009a) where good agreement is attained in the comparison between the numerical results and wind tunnel measurements for pressure distribution along the centerline of ASMO model and flow field around a full-scale production vehicle including complicated engine room and under body geometry.
The governing equations being solved in the LES are spatially filtered continuity and Navier-Stokes equations:
(1)
(2)
(3)
where ui, p, ρ, and ν are the i-th velocity component, pressure, density, and inematic viscosity of the fluid. The over-bar indicates the spatially filtered quantity. The strain rate tensor Sij are defined as
3
The subgrid-scale (SGS) eddy viscosity νSGS in equation (2) is modeled by the standard Smagorinsky
model (Smagorinsky, 1963)
(5)
where ∆ = min(ly, V 1/3
), where ly is the distance between control volume (CV) center and the nearest wall,
and V is the volume of the numerical mesh. As for the model coefficient Cs, different optimized values had been proposed depending on the property of the flow field, e.g. Cs = 0.1 for channel flow and Cs = 0.23 for isotropic decay flow. In bluff body flow (notice that our simplified models resemble the shape of a bluff body), a commonly applied value ranges from 0.1 to 0.15. As such, we carried out a verification test for Cs setting by comparing the results produced by Cs = 0.1 and 0.15. The comparisons show no significant different between the centerline pressure distribution, as well as the drag, lift and pitching moment (percentage differences only about 0.6, 1.8, and 2.1%, respectively). Therefore, we adopted a value of Cs = 0.15, considering that the unstructured mesh might have the possibility to impart certain
level of numerical oscillation due to mesh non-orthogonality. Though small, the artificial dissipation introduce by a higher Cs value may counteract the issue. Meanwhile, the Van Driest damping function fd
was used to damp the effect of sub-grid-scale eddy viscosity in the vicinity of solid boundary, which is defined as
(6)
where y+ is the wall distance. The governing equations were discretized by using the vertex-centered unstructured finite volume method. The second-order central differencing scheme was applied for the spatial derivatives and blending of 5 % first-order upwind scheme for the convection term was exploited for numerical stability. For time advancement, Euler implicit scheme was used. Pressure-velocity coupling was preserved by using the SMAC (Simplified Marker and Cell) algorithm.
2.2 Simplified vehicle models
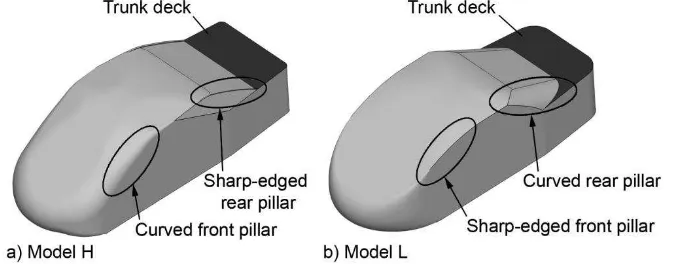
Two 1:20 scale simplified vehicle models representing real production vehicles with different pitching stability characteristics were investigated. The models had similar height H, width W, and length L measurements of 210, 80, and 65 mm, respectively. The main characteristic differences between them were the front and rear pillar shapes. These correspond to the road test results obtained by Okada et al. (2009), in which between the sedan-type vehicles they tested, the one having a sharp-edged front pillar and curved rear pillar configuration experienced relatively larger rear-ride height fluctuation, i.e. lower pitching stability. In contrast, the vehicle that had a curved front pillar and sharp-edge rear pillar configuration experienced little rear-ride height fluctuation. Therefore, the simplified model that represents the sedan car with lower pitching stability is created with sharp-edged front pillar coupled with curved rear pillar, and the opposite configuration is applied for the one represents the higher pitching stability vehicle (see Fig. 1). However, both models had the same slant angles of 30° and 25° for the front and rear pillars, respectively. For convenience in the discussions, the former is designated as “model L”,
and the latter as “model H”, hereafter.
4
2.3 Computational domain and boundary conditions
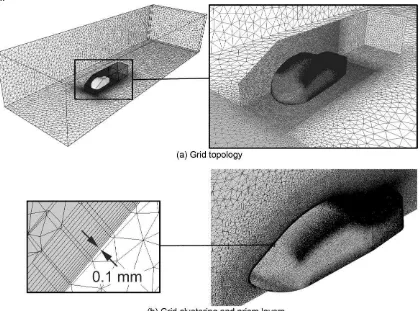
The shape of the computational domain is of a rectangular duct, which covered 1.52L on both sides, and 2.23L for the height. This allowed the blockage ratio to be as small as 1.53%, which is within the typically accepted value of 5% in automotive aerodynamic testing (Hucho and Sovran, 1993). Inlet boundary was located at 3.14L upstream of the model, while outlet boundary was at 6.86L downstream. Unlike the flow past cylinder cases where karman vortex street might form over a given range of Reynolds number, which required longer domain size downstream of the bluff body to properly reproduce the phenomena. In the case of flow past road vehicle, however, the downstream regime is dominated by a pair of longitudinal vortices and absent of the karman vortex street. Ahmed and Baumert (1979), compared the downstream development of these vortices for the fastback, notchback and squareback vehicles. Their results show that the rate of decay of these vortices settles downed before 1.5 vehicle body length behind the rear end. Thus the chosen domain length in our LES is about four and a half times longer than this value to allow the downstream regime to fully developed before reaching the outlet boundary. Meanwhile, finer grid elements are constructed near the vehicle models to capture more detailed flow information around the models, particularly at the pillars and the truck deck regions (see Fig. 2). Fifteen prism mesh layers were generated from the models‟ surface with the first layer‟s thickness being 0.1 mm. Correspondingly, the typical wall distance of the first nearest grid point was less than 150 in the wall unit (y+), which is within the logarithmic layer of the mean velocity profile. Three prism mesh layers were also generated at the outlet boundary while the remaining domain volume comprises tetrahedral cells. Overall, the computational domain encompasses of 16 million elements with 5 million nodes.
Fig. 2. Computational domain and grid topology
5
distribution of instantaneous velocity was imposed. Finally, the ceiling and lateral boundaries of the domain were treated as free-slip wall boundary.
2.4 Grid refinement study
In this work, we conducted a grid independent test to ensure that the grid resolution is adequate. The method is based on the generalized Richardson Extrapolation presented by Roache (1998). This method enables us to quantify the error band of the LES result obtained from our choice of grid resolution. First, the test required three grid schemes created using the same refinement ratio r for evaluating the order of convergence , defined as
(7)
where f1, f2, and f3 are solutions obtained from the finest, medium, and coarsest grid schemes. The r is not
necessary be two (i.e. halving the resolution, since this may result in a solution out of the asymptotic range of convergence), nor an integer number. The number should be a minimum of r 1.1.
Then, Richardson extrapolation is apply to estimate the value at 'zero' grid spacing using the two finest grids results,
(8)
To ensure the validity of extrapolation, the solutions of the three grids have to be within the asymptotic range, which is indicated by grid convergence index GCI. The GCI is a measure of the percentage the computed value is away from the value of the asymptotic numerical value. Thus, it indicates an error band on how far the respective solution of a given grid is from the extrapolated asymptotic value. GCI is defined as
(9)
where Fs is factor of safety. The recommended value of Fs for comparison over three or more grids is 1.25.
Now, we can check whether each grid level yield solutions that are within the asymptotic range of convergence by observing the two GCI values computed over the three grids,
(10)
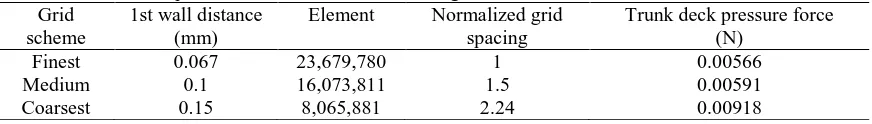
In this study, the major parameter is the trunk deck pressure force. Table 1 summarizes the three values obtained using r = 1.5, and the corresponding grid schemes information. When generating the grid, we first created the medium grid. Then applied the same grid generating parameter on the finest and coarsest grids, i.e. the grid spacing normal to the vehicle surface (by controlling the thickness of the prism cells), and nodal spacing at each zonal interface.
Table 1. Trunk deck pressure force obtained at various grid resolutions Grid
scheme
1st wall distance (mm)
Element Normalized grid spacing
Trunk deck pressure force (N)
Finest 0.067 23,679,780 1 0.00566
Medium 0.1 16,073,811 1.5 0.00591
Coarsest 0.15 8,065,881 2.24 0.00918
6
2.5 Forced pitching oscillation setting
Based on the road test results, Okada et al. (2009) reported that transient aerodynamic forces played an important role in controlling the vehicles‟ pitching motion. However, they were unable to ascertain the aerodynamic damping mechanism due to the limited flow information that they were able to obtain from the road tests. Hence, the present study imposed a forced-sinusoidal-pitching oscillation on the vehicle models during the LES to probe their dynamic responses. Then, the aerodynamic damping mechanism can be identified by analyzing the phase-averaged results. To accomplish this, the Arbitrary Lagrangian-Eulerian (ALE) technique (Hirt et al., 1974) has been employed to rotate the vehicle models about a lateral axis. This axis was fixed at a location corresponding to the front wheel axle of the real vehicle. This is in accordance with the results of Okada et al. (2009) in which during the road tests, fluctuation in the rear-ride height was of greater significance than that in the front-ride height. Hence, the simplified vehicle models were set into pitching motion in a manner that simulating the rear-ride height fluctuation of the real production vehicles during road test. The pitch angle θ is defined as θ = θ0+ θ1sin(2πft). By
setting θ0 and θ1 equal to 2, the vehicle models were forced to oscillate between 0° and 4°. To minimize
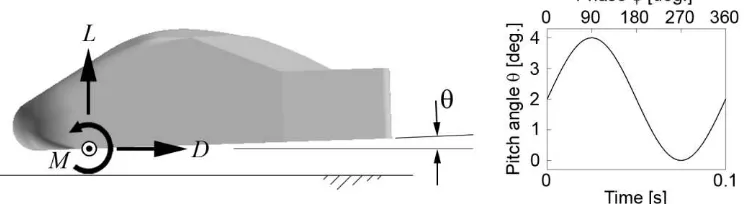
numerical grid distortion, the initial grid was created with the vehicle models inclining at a pitch angle of 2°. Then, ALE technique is employed to rotate the vehicle models at the maximum deviation of 2° in both the positive and negative directions. The frequency f was 10 Hz, which is equivalent to a Strouhal number St of 0.13. This value was chosen considering the road test St of 0.15 obtained by Okada et al. (2009). Hence, in the forced oscillation simulation cases, the vehicle models completed an oscillation cycle every 0.1 sec, as shown at the right of Fig. 3. Phase-averaged results presented in this paper are the averaged of 15 cycles after the LES computation achieved stable periodic conditions. Conventions of aerodynamic forces (i.e., drag D and lift L) and pitch moment M are as shown at the left of Fig. 3. Due to the very high computing resources required in the LES involving the ALE algorithm, high-performance computing technique presented by Tsubokura et al. (2009b) is employed.
Fig. 3. Conventions of aerodynamic forces, pitch moment, and angle
2.6 ALE formulation and solution algorithm
In Lagrangian formulation, the nodes of a computational mesh follow the material particle during motion. This allow easy tracking of fluid-solid interface while having the disadvantage of causing large mesh distortion if it is to track the particles over a long period of time. On the other hand, the Eulerian formulation describes the fluid motion in terms of the spatial coordinates in a fixed bounded domain. This allows large distortions in the fluid motion without affecting the mesh quality, but the application is limited when a moving domain is involved. The ALE formulation was developed to overcome the drawbacks of both Lagrangian and Eulerian formulations. This formulation allows the nodal points of the mesh to move with the fluid in a normal Lagrangian fashion, or to fix at the spatial coordinates as in the Eulerian description, or to move in some arbitrarily specified way to give a continuous rezoning capability. Thus the method can accommodate significant distortions of the computational mesh in flow simulation involving moving boundary.
In the dynamic simulation cases of the present study, motion of the vehicle modal causes the nodal points describing the fluid-solid interface to displace relative to the spatial coordinates (i.e. purely Lagrangian description). To avoid excessive mesh distortion, the surrounding mesh is deformed (in ALE manner), which is calculated using springs analogy method. The result of mesh deformation generates a mass flux in each CV surface, defined as –ρug∆S where ρ and∆S are the fluid density and area of the CV
surface. The negative sign appears in virtue that the flux is generated in the opposite direction to the mesh motion. Whilst, ug is the deformation speed of the CV surface in its normal direction, defined as d
-7
order time difference of its deformed distance during the time step, and CVsurface is the outward unit
normal to that CV surface.
Subsequently, the mass flux is taken into account in the various convection terms in the governing equations. First, the convection term in eq. (2) becomes
(11)
while the pressure-Poisson equation derived by enforcing the continuity constraint eq. (1) through fractional-step method becomes
(12)
Accordingly, in each new time step, the fluid-solid interface points move to the new positions defined by the imposed sinusoidal function, and the whole mesh is displaced in a fashion similar to the deformation of an elastic body. Then, the corresponding velocity for each CV surface is computed and fed in the related convective terms. Finally, solutions to all the governing equations are performed exactly like in the case of a fixed grid simulation.
2.7 Validation
Validation of the numerical method adopted in the present study is performed by comparing the LES results obtained in stationary cases to wind tunnel measurements. The wind tunnel experiment was conducted using the Mazda Wind Tunnel, which has a test section of 6 m x 4 m x 12 m for the height, width, and length measurements. The same Reynolds number and model scale as in the LES were used.
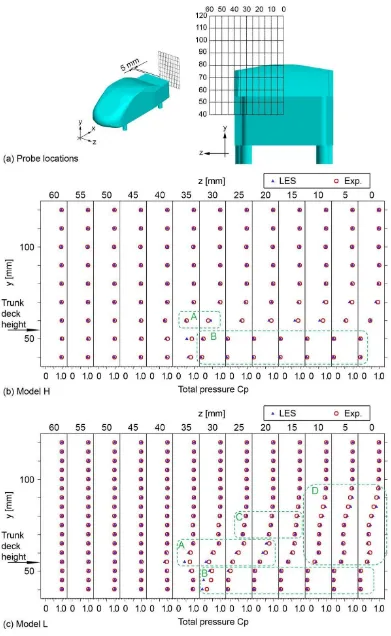
For comparison purposes, Fig. 4 plots the distributions of time-averaged total pressure coefficient Cptot
(normalized by the inlet velocity), defined as Cptot= (½ ρU² + p)/(½ ρU²inlet), where ρ = fluid density, U =
velocity, and p = pressure, as captured by the wind tunnel experiment and LES, at a distance of 5 mm behind the vehicle models. This plane was chosen for validation purposes because it contains most of the predominant flow structures generated around the two models.
8
9
3. Results and Discussion
3.1 Transient aerodynamic effect on pitching stability
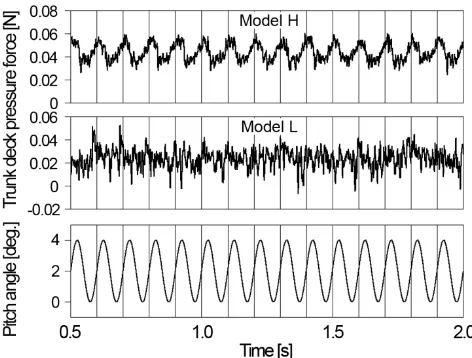
From the road test performed by Okada et al. (2009), they reported that the cross correlation coefficient between the fluctuation in rear-ride height and the surface static pressure of the trunk deck was positive for vehicle having higher pitching stability. In order to verify that the simplified models are reproducing the same trend, time-series of pressure force acting on the trunk deck (values presented are averaged quantities over the entire trunk deck surface) were extracted from the LES results. Then, cross correlation is performed between the time-series of the pitch angle and the trunk deck pressure force of the two models, as shown in Fig. 5. The trunk deck pressure force of models L and H correlate at positive values of 0.09 and 0.38, respectively. The significant positive correlation in model H suggests that the pressure force exerted on the trunk deck increases during tail-up pitching, thus implying a tendency for transient aerodynamic force to restrain the pitching oscillation. Contrary, such effect may be negligible in model L, where the correlation coefficient is nearly zero. Based on these results, it can be concluded that the simplified vehicle models had successfully reproduced the anticipated pitching stability characteristics of the real vehicles. Hence, the mechanism of how the unsteady aerodynamic forces affect the pitching stability characteristics of the real passenger cars can be identified by analyzing the LES results of the simplified models.
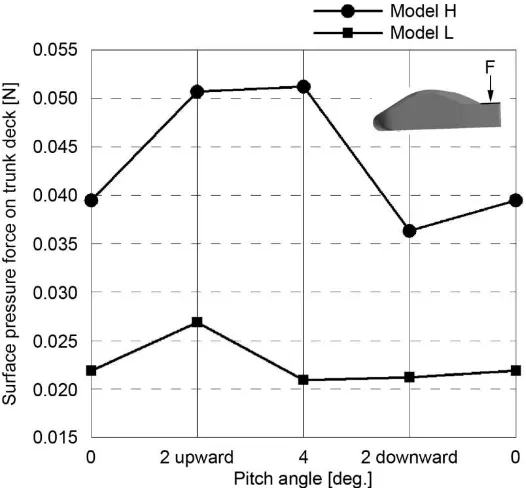
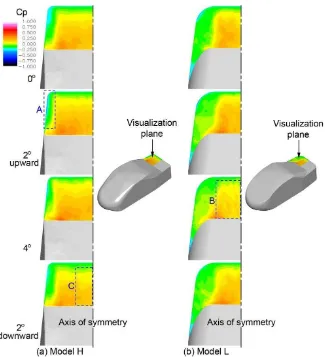
Next, in order to shed light on how these correlation results are produced from the physical point of view, Figs. 6 and 7 respectively show the distribution of surface static pressure Cp on the trunk deck and the corresponding pressure forced at successive pitching stages of 0°, 2° upward, 4°, and 2° downward. The results presented are phase-averaged quantities at each corresponding pitching stage.
Fig. 5. Time history of pitch angle and trunk deck pressure force
During pitching oscillation, the sign of change in the trunk deck pressure force indicates whether the transient aerodynamic effect induces a tendency to restrain or enhance the pitching motion of the models. Therefore, we can evaluate the trend depicted in Fig. 6 to identify the models‟ pitching stability characteristic.
During tail-up pitching from 0° to 2°, the low surface static pressure region at the sides of model H (marked as A in Fig. 7) narrows down. As a result, the overall trunk deck pressure force increases by about 24.8 %, as indicated in Fig. 6. Eventually, this induces a tendency to restrain the tail-up pitching motion of model H. A similar trend is observed in Model L, where the trunk deck surface pressure force increased by about 20.4 %.
However, as tail-up pitching continued from 2° to 4°, the surface pressure of model H increased while that of model L decreased significantly, i.e., by about 24.9 %. In Fig. 7, a substantial drop in static pressure can be clearly seen at the central region (marked as B). Attributed to this, model L has a tendency that enhances the tail-up pitching which making it less stable.
10
and so produced a tendency to restrain tail-down pitching. The corresponding dropped in surface static pressure is depicted in Fig. 7, which is at the central region marked as C.
Overall, the trend obtained in model H due to the effect of transient aerodynamics is the restraining of pitching motion, while the opposite tendency is observed for model L. Hence, both models have different pitching stability characteristics as demonstrated in the real production vehicles studied by Okada et al. (2009).
Based on the changes in surface static pressure distribution with pitch angle illustrated in Fig. 7, it could be assumed that these changes correspond to the changes in flow structures around the vehicle models. Hence, the flow structures are being visualized in order to discern their transient behaviors during pitching oscillation, which will be discussed in the following sections.
11
Fig. 7. Distribution of phase-averaged surface static pressure Cp (normalized by inlet velocity) on trunk deck during pitching oscillation
3.2 Predominant vortex structures
In order to ensure that the simplified vehicle models had successfully generated the flow features of the real production vehicles, the time-averaged vortex structures generated under the steady-state simulation condition, with the vehicle models fixed at pitch angle = 0°, were visualized and compared with the results reported by Okada et al. (2009).
Figure 8 shows the time-averaged vortex structures generated around the vehicle models rendered by the ISO surface of the second invariant of velocity gradient tensor Q, which is defined as Q = ½ ∂jui∂iuj.
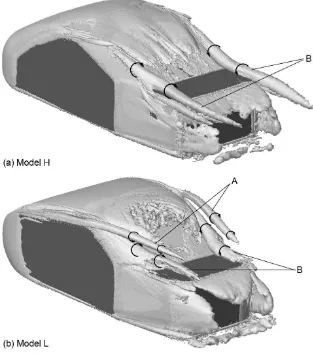
The arrows indicate the rotational directions of the coherent structures. As depicted, a pair of longitudinal vortices (marked as A) that shed at the front pillar edges and then convected downstream, is observed in model L. Meanwhile, side edge vortices (B) coming off the rear pillar edges are observed in both models. For convenience in discussion, the vortex structures A and B are designated as front and rear pillar vortices, respectively. In addition, it appears also the rolled up of shear layers at the horizontal and vertical edges of the rear end of the models, supposing the formation of horseshoe vortices behind the models. This is consistent with the flow physic of the ground vehicle wake postulated in the literature (e.g. Ahmed, 1981).
12
Fig. 8. Predominant vortices
Fig. 9. Schematic flow images around trunk deck (After Okada et al, 2009)
“Reprinted with permission from SAE paper 2009-01-0004 © 2009 SAE International.”
3.3 Transient characteristics of pillar vortices during pitching
During pitching oscillation, alteration of the slant angle occurred at the front and rear pillars of the
13
both models at four stages of pitching, i.e., 0°, 2° upward, 4°, and 2° downward. The visualization of these vortices is via the rendering of ISO surface of Q.
In model L, the strength of the front pillar vortex is directly proportional to the pitch angle, as may be evident from the increasing size and length of the structure during tail-up pitching stages (i.e., 0°, 2° upward, and 4°). In contrast, the strength of the rear pillar vortex is inversely proportional to the pitch angle. The decrease in the size of the rear pillar vortex is more easily seen in model H, though both models share the same trend.
14
3.4 Aerodynamic damping mechanism
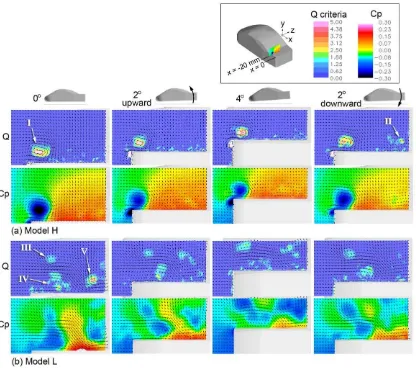
Figure 10 shows the vortex structures (depicted as Q color contour and cross flow velocity vector) and the distribution of static pressure Cp above the trunk deck in one half of the symmetric transverse planes at x = -20 mm, at four different pitching stages. As shown, the regions of high Q value coincide with the regions of low static pressure Cp. Thus this matching clearly shows their strong inversely proportional relationship.
In general, the flow above the trunk deck of model H was dominated by a pair of rear pillar vortices (indicated by „I‟ in Fig. 11) near the side edges, while away from the vicinity of the side edges, the flow
appeared to be “two dimensional”, i.e., uniform in the transverse direction due to relatively weak cross flow. Hence, the static pressure is mainly positive, except at the rear pillar vortex where strong swirling motion can be detected based on the direction of the velocity vector. The schematic diagram shown in Fig. 12 summarizes the unsteady characteristic of the predominant flow structures, changes in the front
and rear pillar‟s slant angles during pitching, and the effects of unsteady aerodynamics on pitching stability. During tail-up pitching, the strength of the rear pillar vortices decreased significantly owing to the decrease in the slant angle of the rear pillars. Consequently, the low surface static pressure region (shown in Fig. 7, marked as A), which was induced by the rear pillar vortex, narrowed down and caused an increase in the overall trunk deck pressure force, thus producing a tendency for the aerodynamic force to restrain the pitching motion of model H.
During tail-down pitching, i.e. at 2° downward, a circulatory structure is formed near the center line (indicated by „II‟ in Fig. 11). Hence, the static pressure at the central flow region dropped and caused a corresponding drop in surface pressure force at the center of the trunk deck. Accordingly, a tendency for the aerodynamic force to restrain the motion of tail-down pitching is produced. To depict how the circulatory structure is formed, Fig. 13 compares the strength of the cross flow component above the trunk deck at pitch angle = 2°, during tail-up and tail-down pitching, at four streamwise locations, i.e., x = -25, -20, -15, and -10 mm, along a longitudinal plane 10 mm from the center line. In the figure, symbols are used to indicate the distribution of the cross flow component during tail-up pitching, while lines are used for the case of tail-down pitching. In general, it is apparent that cross flow is stronger near the trunk deck surface. Meanwhile, between the same downstream location (symbol and line of the same color), the strength of the cross flow is stronger in the case of tail-down pitching. Hence, it may be conjectured that
the formation of the circulatory structure „II‟ is associated with the superimposition of the cross flow in the proximity of the trunk deck surface of the preceding phase onto the flow field of the following phase as the trunk deck surface was displaced downward during tail-down pitching. Thus the strength of the cross flow in the following phase increases as a result of this cumulative process and generates the circulatory structure.
On the other hand, the flow topology above the trunk deck of model L is more complex. It comprises the front pillar vortex, rear pillar vortex, and the circulatory structure at the central region (shown as „III‟,
„IV‟, and „V‟, respectively, in Fig. 11). Due to the interaction of these vortices, strong cross flow was generated (thus the flow is three-dimensional). Consequently, large proportion of the flow was subjected to negative static pressure. During tail-up pitching, a tendency for aerodynamic force to enhance the pitching motion in model L is attributed to the substantial dropped of trunk deck surface pressure force at pitch angle = 4°. At this instant, the strength of the front pillar increased due to the increase in the slant angle of the front pillar. In the meantime, the rear pillar vortex was elevated by the trunk deck surface and thus was brought into close proximity with the front pillar vortex. These two pillar vortices, which rotate in directions opposite one another, interact with each other and generated a strong cross flow above the trunk deck by drawing in air from the side, flowing through them and towards the center line. As the resulting cross flow converged at the center line, they rolled upwards and formed an upwash inducing, circulatory structure. Attributed to these pillar vortices, cross flow component, and the upwash inducing circulatory structure, the induced surface pressure force on the trunk deck diminished.
15
16
Fig. 12. Schematic diagram of unsteady aerodynamics effects on pitching stability of sedan-type vehicle models
17
4. Conclusion
Work described in this paper has examined the aerodynamic damping mechanism in sedan-type vehicle. In general, unsteady aerodynamics is being perceived as having negative influence on vehicle‟s stability. However, the result of present work demonstrates that it can be exploited for stability control, in particular for suppressing the pitching oscillation. This work successfully developed an assessment method by incorporating ALE in LES technique for probing the dynamic response of vehicles, which is not attainable using RANS or steady-state wind tunnel measurement.
The LES result shows strong influence of transient flow structures above the rear section of sedan-type vehicles on their pitching stability characteristic by the induced pressure force on trunk deck surface. These structures are the front-pillar vortex, rear-pillar vortex, and circulatory structure in the wake behind the rear shield. Among them, front-pillar vortex which associated with vehicle of sharp-edge front pillar configuration is found to be the main factor that imparts the unstable tendency in the vehicle‟s pitching behaviors. Hence, proper shaping of front pillar is important when vehicles are to take advantage of the transient aerodynamic forces in stability control pertaining pitching.
Acknowledgments
This work was supported by the 2007 Industrial Technology Research Grant program from the New Energy and Industrial Technology Development Organization (NEDO) of Japan. Development of the base software FFR was supported by the FSIS and “Revolutionary Simulation Software RSS21 ” projects sponsored by MEXT, Japan.
References
Ahmed, S.R. and Baumert, W., 1979. The structure of wake flow behind road vehicles. Proc. ASME-CSME Conf. Aerodynamics of Transportation, Niagara Falls, 93-103.
Ahmed, S.R., 1981. An experimental study of the wake structures of typical automobile shapes. J. Wind Eng. Ind. Aerodyn. 9 (1-2), 49-62.
Baker, C.J., Humphreys, N.D., 1996. Assessment of the adequacy of various wind tunnel techniques to obtain aerodynamic data for ground vehicles in cross winds. J. Wind Eng. Ind. Aerodyn. 60, 49-68.
Bearman and Mullarkey, 1994 Bearman, P.W., Mullarkey, S.P., 1994. Aerodynamic Forces on Road Vehicles due to Steady Side Winds and Gusts. RAeS. Vehicle Aerodynamics Conference, Loughborough.
Cogotti, A., 2004. Update on the Pininfarina “Turbulence Generation System” and its effects on the Car Aerodynamics and Aeroacoustics. SAE Paper 2004-01-0807
Franc , G., Nigro, N., Storti, M. and D‟Elia, J., 2009. Numerical simulation of the flow around the Ahmed vehicle model. Latin American Applied Research. 39. 295-306.
Hucho, W-H. and Sovran, G., 1993. Aerodynamics of road vehicles. Annu. Rev. Fluid Mech. 25. 485-537. Hirt, C.W., Amsden, A.A. and Cook, J.L., 1974. An Arbitrary Lagrangian-Eulerian Computing Method for All Flow Speeds, J. Comput. Phys. 14, 227-253.
Kobayashi, T., Tsubokura, M. and Oishi, M., 2008. Technology of automobile and visualization studies: In celebration of the 10th anniversary of journal of visualization. J. Visual-Japan. 11-1, 15-22.
Krajnovic, S. and Davidson, L., 2005. Flow around a simplified car, part 1: large eddy simulation. J. Fluids Eng. 127. 907-918.
Minguez, M., Pasquetti, R. and Serre, E., 2008. High-order large-eddy simulation of flow over the “Ahmed body” car model. Physics of Fluids. 20-9, 095101.
Nakashima, T., Tsubokura, M., Nouzawa, T., Nakamura, T., Ichimiya, M., 2009. Flow Structures above the trunk deck of sedan-type vehicles and their influence on high-speed vehicle stability, 2nd report: Numerical investigation on simplified vehicle models using large-eddy simulation. SAE International Journal of Passenger Cars; Mechanical Systems. 2-1, 157-167.
Noger, C., Regardin, C., and Széchényi, E., 2005. Investigation of the transient aerodynamic phenomena associated with passing manoeuvres. J. Fluid and Structures. 21-3, 231-241.
Okada, Y., Nouzawa, T., Nakamura, T. and Okamoto, S., 2009. Flow structure above the trunk deck of sedan-type vehicles and their influence on high-speed vehicle stability 1st report: On-Road and Wind-Tunnel Studies on Unsteady Flow Characteristics that Stabilize Vehicle Behavior. SAE Paper No 2009-01-0004.
Roache, P.J., 1998. Verification and Validation in Computational Science and Engineering, Hermosa Publishers, Albuquerque, New Mexico.
Sawada, M. and Matsumoto, T., 2009. Vehicle Stability Control System, U.S. Patent, Patent No. US 7,577,504 B2, Date of Patent 18 Aug. 2009.
Smagorinsky, J., 1963. General circulation experiments with primitive equations. Monthly Weather Rex. 91-3, 99-164.
18
Tsubokura, M., Kobayashi, T., Nakashima, T., Nouzawa, T., Nakamura, T., Zhang, H., Onishi, K., Oshima, N., 2009a. Computational visualization of unsteady flow around vehicles using high performance computing. Comput. Fluids. 38, 981-990.
Tsubokura, M., Nakashima, T., Kitoh, K., Sasaki, Y., Oshima, N. and Kobayashi, T., 2009b. Development of an Unsteady Aerodynamic Simulator Using Large-Eddy Simulation Based on High-Performance Computing Technique. SAE International Journal of Passenger Cars; Mechanical Systems. 2-1, 168-178.
Tsubokura, M., Nakashima, T., Kitayama, M., Ikawa, Y., Deog, H. D., Kobayashi, T., 2010. Large eddy simulation on the unsteady aerodynamic response of a road vehicle in transient crosswinds. Int. J. Heat Fluid Fl. Article in press.