FAKTOR- FAKTOR YANG MEMPENGARUHI PERTUMBUHAN EKONOMI DI INDONESIA PERIODE 1981-2014
PENDEKATAN ERROR CORRECTION MODEL
UNDERGRADUATE THESIS
Written by: NADYA ROSE .P
20130430276
FACULTY OF ECONOMICS AND BUSINESS
INTERNATIONAL PROGRAM FOR ISLAMIC ECONOMICS AND FINANCE (IPIEF)
FAKTOR- FAKTOR YANG MEMPENGARUHI PERTUMBUHAN EKONOMI DI INDONESIA PERIODE 1981-2014
PENDEKATAN ERROR CORRECTION MODEL
UNDERGRADUATE THESIS
In partial fulfillment for the requirement for the degree of Bachelor of Economics
(Sarjana Ekonomi) at International Program for Islamic Economics and Finance
(IPIEF), Economics Department
Written by: NADYA ROSE .P
20130430276
FACULTY OF ECONOMICS AND BUSINESS
INTERNATIONAL PROGRAM FOR ISLAMIC ECONOMICS AND FINANCE (IPIEF)
Name : Nadya Rose .P
Student Number : 20130430276
I declared that this undergraduate thesis entitled “The Factors Influencing Economic Growth in Indonesia Period 1981-2014, Error Correction Model Approach” does not consist of any content that ever being proposed for any degree in other university, ideas of any research and publication of others, in exception all quotes and ideas which are purposely taken are considered as the research references and listed in the reference list. Therefore, if any violation of intellectual right is found in this study, I agree to accept any relevant academic consequences.
Yogyakarta, March, 18th 2017
Good to People. Being Good to People is a Wonderful Legacy to Leave Behind –
This Undergraduate Thesis I dedicate to my beloved parents, my sister Alya, and
In the name of Allah, the most Merciful, the most Gracious. All praise is due to Allah; we praise Him, seek His help, and ask for His forgiveness. I am thankful to Allah, who supplied me with the courage, the guidance, and the love to complete this thesis. Also, Peace and salutation always be to the Prophet Muhammad peace be upon him altogether with his accompanies.
This undergraduate thesis entitled “The Factors Influencing Economic Growth in Indonesia Period 1981-2014, Error Correction Model Approach” has
made as partial fulfillment for the requirement to achieve the bachelor degree of economics (Sarjana Ekonomi). So that, I would like to thank all the people who contributed in some way in this thesis. In particularly they are:
1. A special feeling of gratitude to my beloved parents; Ibu and Ayah. Thank you so much for endless love, prayers and encouragement, trust, and all the things you have done to me since I was a little girl until I can finish my undergraduate studies.
2. I also thanks to my beloved brothers and sister: Desmonth, Arief, and Alya fortheir support, understanding and good wishes whenever I needed. 3. I dedicated this work and give special thanks to my best friend Salma, for
the support of my research, for her flawless grammatical editing of my thesis, tolerating my crazy habits, for being by my side in any situations. Thank you for everything ma, and no words can describe our friendship.
4. I should not forget to acknowledge to all my best friends that are far away from me; Tika, Putri, and Trisna for the trust, love, and support long this way.
5. Sincere thanks to my childhood friend, Mbak Lia who also still give me support until now.
6. I would like to express my sincere gratitude to Dr. Masyhudi Muqorrobin
(Alm) for being a very good lecture as well as parent in this department. Thank you for all the lesson you have taught to me in this university.
Al-Fatihah…
7. My thanks must go also to my IPIEF fellas batch 2013 for all the fun we had in the last 3 years together at class.
10.I would like to express my wholehearted thanks to all my lecturers in IPIEF department who guide me from the beginning of university days until I can graduate from this university.
11.Last but not least, I’d like to congratulate myself for the sleepless night, the ups and downs mood, eating too much, uncontrollably tears and all the
efforts that I’ve done while making this thesis real in the end.
Yogyakarta, March, 18th 2017
SUPERVISORS AGREEMENT PAGE ... iii
CHAPTER I INTRODUCTION ... 1
A. Research Background... 1
B. Research Limitation ... 14
C. Research Questions ... 15
D. Research Objectives ... 15
E. Research Benefits ... 16
CHAPTER II LITERATURE REVIEW... 17
A. Theoretical Framework ... 17
1. Economic Growth ... 17
2. Foreign Direct Investment ... 30
3. Export ... 33
D. Operational Data of Variables ... 45
E. Analysis Method ... 46
1. Classical Assumption Test ... 47
a. Autocorrelation ... 48
b. Integration Degree Test ... 52
c. Co-integration Test... 52
d. Error Correction Model ... 53
CHAPTER IV RESULT & ANALYSIS ... 56
A. Research Variable Overview... 56
1. Indonesian Gross Domestic Product Overview ... 56
2. Foreign Direct Investment (FDI) Overview in Indonesia ... 58
3. Indonesian Export Overview... 59
4. Indonesia Infrastructure Overview ... 61
5. Indonesian Inflation Overview ... 62
B. Classical Assumption Test ... 63
1. Autocorrelation Test... 63
2. Normality Test ... 64
3. Heteroskedasicity Test ... 64
4. Multicollinearity ... 65
C. Dynamic Assumption Test ... 67
1. Stationary Test ... 67
1. The Influence of Foreign Direct Investment (FDI) on
Economic Growth (GDP) ... 75 2. The Influence of Export on Economic Growth (GDP) ... 78
3. The Influence of Infrastructure (Road Length) on Economic
Growth (GDP) ... 80
4. The Influence of Inflation Rate on Economic Growth (GDP) 83
CHAPTER V CONCLUSION & SUGESTION ... 86 A. Conclusion ... 86 B. Suggestion ... 87 REFERENCES
1.2 The Foreign Direct Investment by Province in Indonesia ... 10
1.3 The Export and Import Growth in Indonesia in Million US$ ... 12
4.1 The Lagrange Multiplier Test (LM) Result ... 63
4.2 The Jarque-Bera Test (J-B test) Result ... 64
4.3 The White Heteroskedasticity Test Result ... 65
4.4 The Multicollinerity Test before being Transformed into First Difference Form (D) ... 66
4.5 The Multicollinearity Test Has Been Transformed into First Difference Form (D) ... 66
4.6 The Unit Root Test Result in Level Degree by Augmented Dickey-Fuller test Method ... 68
4.7 The Unit Root Test Result in First Difference Degree by Augmented Dickey-Fuller test Method ... 69
4.8 The Result of Co-integration Test in Long Term... 71
4.9 The Unit Root Test result toward the Residual Long Term Equation ... 72
4.10 The Result of Error Correction Model Estimation ... 73
1.2 The Contribution Growth of Several Sectors on GDP in Indonesia 1981-2014 .... 4
2.1 Aggregate Demand and Supply in a Balance Macroeconomic Situation ... 20
2.2 Theory of Harrod-Domar: TheRole of Investment in Economic Growth... 24
2.3 Neo-Classical production Function ... 27
2.4 Research Framework ... 43
4.1 Indonesian Gross Domestic Product in 1981-2014 ... 57
4.2 Indonesian Foreign Direct Investment in1981-2014... 58
4.3 Indonesian Export in 1981-2014 ... 60
4.4 Indonesian Infrastructure in 1981-2014 ... 61
Indonesia. The study employed the quantitative approach by using secondary data from 1981 to 2014. Analysis tool that is used in this study is Error Correction Model (ECM). Variables that are used namely Foreign Direct Investment (FDI), Export, Infrastructure (Road Length), and Inflation Rate, in which economic growth represented by Gross Domestic Product (GDP).
The result of this study indicates that Foreign Direct Investment (FDI) and export have positive and significant impact in short and long run. Meanwhile, both in short and long run, the inflation rate has negative and significant impact. The different result shows by infrastructure (Road Length) that has negative and insignificant relationship on economic growth in Indonesia, both in short and long run.
mempengaruhi pertumbuhan ekonomi di Indonesia. Penelitian ini menggunakan pendekatan kuantitatif dengan menggunakan data sekunder periode 1981-2014. Alat penelitian yang digunakan dalam penelitian ini adalah Error Correction Model (ECM). Variabel yang digunakan meliputi Penanaman Modal Asing (PMA), Ekspor, Infrastruktur (Panjang Jalan) dan Inflasi. Pertumbuhan Ekonomi diwakili melalui Produk Domestik Bruto (PDB).
Hasil Penelitian ini menunjukan bahwa penanaman modal asing (PMA) dan ekspor berpengaruh positif dan signifikan pada jangka pendek dan panjang. Sedangkan inflasi berpengaruh negatif dan signifikan di jangka panjang dan pendek. Hasil yang berbeda ditunjukan oleh infrastruktur yang tidak berpengaruh signifikan di jangka pendek maupun jangka panjang.
1
CHAPTER I
INTRODUCTION
A. Research Background
Economic performance is an assessment of its success in areas related
to its assets, liabilities and overall market strength. Many countries take regular
stock in either formal or less formal basis of the general economic performance
of their countries to make sure that it remains on the right track financially.
Economic performance can be seen from economic growth. Economic growth
is an indicator to perceive a country’s performance whether in good or bad performance. The success of the development of a country can be seen from the
level of economic growth. Therefore, each country always set target of high
economic growth rates in the planning and development objectives. By high
sustainable economic growth means as the main condition for sustainable
development economy.
In the narrow sense, economic growth means the increase in total
production of both goods and services. This is measured by the change in real
gross domestic product (GDP) and by the change of real gross domestic product
per capita. GDP is the total value of all final goods and services produce in a
country in a one-year period. The value of GDP would give a view of how a
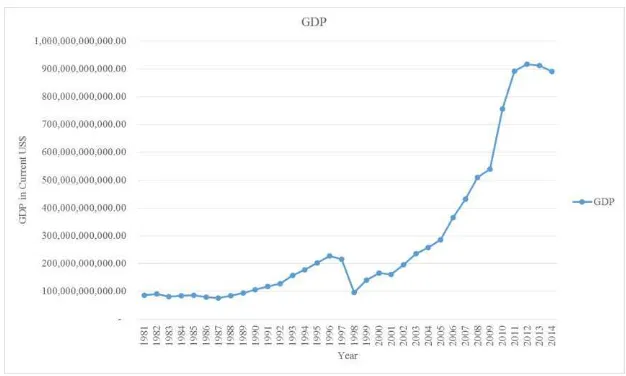
Indonesia is one of the developing countries in the world. As a
developing country Indonesia has been joined as a member in G-20 major
economies and classified as the newly industrialized country. Based on the data
from world-bank in 2013, the gross domestic product of Indonesia reached
3,475.25 USD. Indonesia experienced a GDP growth of 5.8% per 2013, it is of
course a good hope for the Indonesian’s government to realize the improvement
of people's welfare.
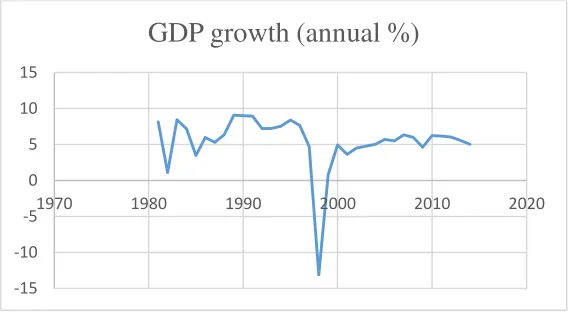
Source: World Bank
The graph above explained about the development of economic growth
in Indonesia for 34 years from 1981 until 2014. Given the fact from World
Bank, it can be concluded that the economic growth in Indonesia moving into
-15 -10 -5 0 5 10 15
1970 1980 1990 2000 2010 2020
GDP growth (annual %)
FIGURE 1.1
fluctuation ways for 34 years. In the crisis 1998, the economic growth in
Indonesia decreased dramatically around -13.12%. As for Indonesia, the main
cause of financial crisis happens because of the internal source at that time. The
crisis started when huge capital flight out from Indonesia. The direct result of
capital flight that occurred in Indonesia, result in Indonesia's national currency
(rupiah) then deteriorated against the US dollar. Moreover, many companies
bankrupted and the national banking sector collapsed (Tambunan T. , 2010).
Indonesia has suffered a crisis in 12 years, for example, in 1997/1998
and 2008/2009. Because of those crises, Indonesia economy is exposed to
economic shocks, either from internal sources or external sources, for the
following main reasons. Firstly, Indonesia's economy becomes more open to
other countries. Therefore, any volatility which happens in global economics
will effect on Indonesian economic as well. Secondly, Indonesia is still depend
on the primary commodities, especially agriculture sector. So when, the price
instability happens in the primary commodities, became a shock for Indonesian
economy. Thirdly, because of the instability of these commodities, it is also
impact the domestic consumption and food security in Indonesia (Tambunan T.
, 2010).
In fact, economic growth in a country cannot be separated from the role
of government from policy makers both fiscal and monetary, and the role of
economic cycle. Hence, gross domestic product has become a measure of the
ability of a society to produce a product that can enhance the economic growth
of a country.
One of the important things by using of national income data is to
determine the rate of economic growth which is achieved by a country year to
year. Data from national income can also be an indicator to see the economic
performance. By observing the growth of a country from year to year, it can be
assessed achievements and success in controlling the country's economic
activity in the short term and in the long term. Comparisons may also be made
between the level of the country's success in controlling and build its economy
achieved when compared with other countries. (sukirno, 2013)
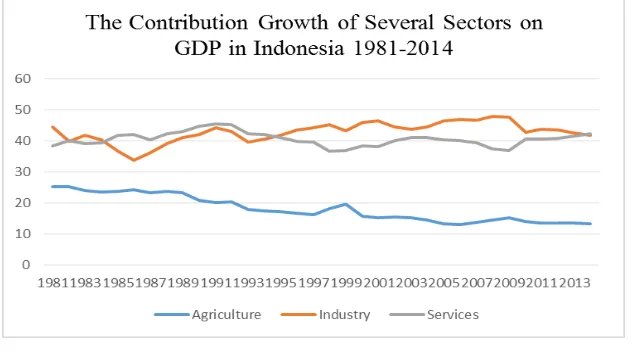
FIGURE 1.2
The Contribution Growth of Several Sectors on GDP in Indonesia 1981- 2014
Gross domestic product cannot be separated from that contributions
given by various sectors produced in Indonesia. With an area of 1,905 million
km which is owned by Indonesia, there are a wide variety of sectors
contributing. The figure 1.2 above shows the development contribution of
several sectors on gross domestic product in Indonesia.
The income which is gained by the government come from three major
sectors; agriculture, industry, and services. The development of the three
sectors fluctuates for 34 years. The highest contributing sector is industry,
followed by service, and the last is agriculture. The agriculture sector trend
tends to decrease each tear although it once increases after the Asian crisis in
1997. The previous contribution is 16% increased to 19% after the crisis. In the
beginning of 1995, the industry sector surpassed the service sector until 2014;
while since 1981 to 1995 the service sector contributed the most to the national
income
In macroeconomic analysis, besides explaining the supporting factor
that possibly affect the economic growth, it also discusses on the issues such
as; inflation. Inflation is a process of rising prices in general and continuous
(continuous) for a certain time. In other words, inflation is also a process in
which the declining in currency values continuously. Inflation is a process of
an event, not the high-low level of a price. That is, if the high price level it has
happen and influence each other means there is inflation. To achieve
sustainable economic growth along with price stability continues to be the main
objective of economic policy macro to most countries in the world today.
Based on the data from World Bank, the rate of inflation in Indonesia
has fluctuated over the time. The highest level of inflation is happen when Asia
financial crisis in 1997. Because of that problem, the inflation rate reach 58.3%
and 20.48% in 1999. It became the hardest-hit country because the crisis not
only had economic but also significant and far-reaching political and social
implications. And after that, the inflation rate in Indonesia gradually back to
normal.
There are three main components in the growth for each country,
namely capital accumulation, population growth, and technological advances.
As discussed above, the economic growth associated with the state's ability to
produce goods and services and the increase in per capita income of the
population. The accumulation of capital is reinvested earnings with the aim to
increase output (Todaro, 2000).
In this globalization era, foreign direct Investment (FDI) plays an
important role in international business. Economic integration occurs between
the countries in the world encourage the emergence of cooperation in the
economic, political, social and cultural. As the developing country in the world,
is due to the undertakings in pursuit of the underdevelopment of the developed
countries in the world globally. The fact that Indonesia itself is not able to
provide the fund for development itself.
The sources of financing in development could come from domestic and
abroad. One of the external types of is Foreign Direct Investment (FDI).
According to (Panayotou, 1998) in (Sarwedi, 2002) tells that FDI is more
importantto ensure the continuing development in a country compared to other
funding streams such as, portfolio, because the presence of FDI will be
followed by the transfer of technology, know-how, management skills, business
risk is relatively smaller and productive (Sarwedi, 2002).
According to Jhingan (2004) In Agma tells that foreign investment in
the need to build economic acceleration. This is because the foreign capital can
help in the process of industrialization in order to create wider opportunities.
Foreign capital could be aid technology.
Foreign investment in Indonesia, has become a funding source that can
be used as financing for development and economic growth. By using foreign
investment, it is intended to replace the use of foreign debt as a source of
financing. Because with the increasing uncontrolled interest rates on foreign
debt and the rupiah exchange rate against foreign currencies make Indonesia
Based on the legal basis, Foreign Direct Investment has been regulated
by UU No.1 year 1967 and UU No.11 year 1979. In this basis, FDI means that
foreign investment activities directly undertaken by or under the provisions of
this law and used to run a company in Indonesia, and the owners of the capital
directly bear the risk of the investment.
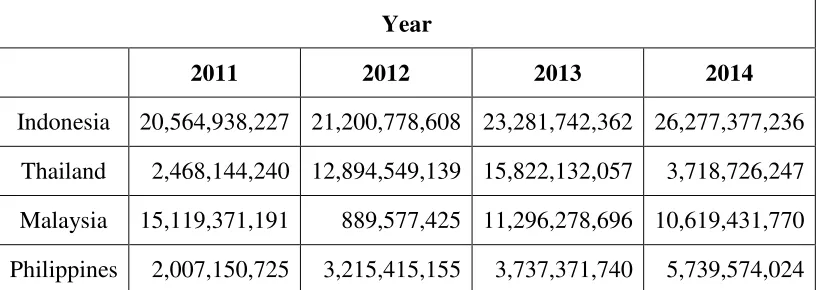
The realizations of foreign direct investment in every country fluctuate
every time. The following data is the development net inflows of FDI in
Indonesia among the other ASEAN-4-Nations based on the World Bank from
2011 until 2014 in Million US Dollar:
Based on the table above, Indonesia has become the largest foreign
direct investment realization among the ASEAN-4-Nations. The realization of
Year
2011 2012 2013 2014
Indonesia 20,564,938,227 21,200,778,608 23,281,742,362 26,277,377,236
Thailand 2,468,144,240 12,894,549,139 15,822,132,057 3,718,726,247
Malaysia 15,119,371,191 889,577,425 11,296,278,696 10,619,431,770
Philippines 2,007,150,725 3,215,415,155 3,737,371,740 5,739,574,024
Source: World Bank
TABLE 1.1
foreign direct investment (net-inflows) in Indonesia always increase from 2011
until 2014. Similarly, the net inflows of FDI always increase over 4 years in
Philippines. On the contrary, the foreign direct investment of the other countries
fluctuates at that time. Surprisingly, for 4 years, the FDI of Malaysia decreased
on 2012, and keep increasing in 2013 and 2014. The smallest foreign direct
investment is Thailand among ASEAN-4-Nations.
Investors invest in Indonesia with various forms. Usually investors
come to a province or region that have advanced development. This is because
of the stability that the investors can have from that advanced province.
Province in Java Island mostly become the choice from the investors to be the
right place to invest. The difficulty is that not every province has the same
growth and stability. So, there is the amount gap in each province.
Indonesia is an archipelago with many islands and is divided into 34
provinces. The investments that are in Indonesia are scattered throughout the
area in Indonesia. Each province has its uniqueness to offer to investments.
Indonesia is rich with the natural resources, so that the investors can choose to
invest on this development. There are various types of industries in Indonesia
that the investors can also choose. The following is an overview of the
distribution of foreign direct investments in each region in Indonesia taken from
the Investment Coordinating Board of the Republic of Indonesia in January-
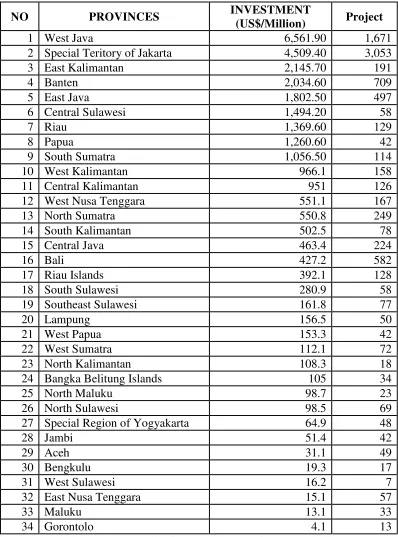
TABLE 1.2
The Foreign Direct Investment by Province in Indonesia in 2014
NO PROVINCES INVESTMENT
(US$/Million) Project
1 West Java 6,561.90 1,671
2 Special Teritory of Jakarta 4,509.40 3,053
3 East Kalimantan 2,145.70 191
The table 1.2 above explains about the foreign direct investment based
on the locations in Million US Dollar and the total project for each location.
According the table above, in January- December period, the highest realization
of FDI was located in West Java with the total Investment 6,561.9 Million US
Dollar. On the other hand, the lowest realization of FDI was located in
Gorontalo with the total investment only 4.1 Million US Dollar. Besides the
total investment, the highest number of the total project was located in Special
Territory of Jakarta with 3,053 project in 4,509.4 Million US Dollar total
investment. At last, the lowest total project was located in West Sulawesi with
only 7 project in 2014.As we have discuss previously, the size of the economic
growth in each country, depending on the capital invested by each country. The
need for productive investments in supporting social and economic necessity to
carry out the process of development in a country
Beside investments, Export also play an important role in the economic
activities of a country. Exports will generate income that will be used to finance
imports of raw materials and capital goods needed in the production process
that will create value-added. Aggregation value added generated by all
production units in the economy is the value of products GDP (Sutawijaya &
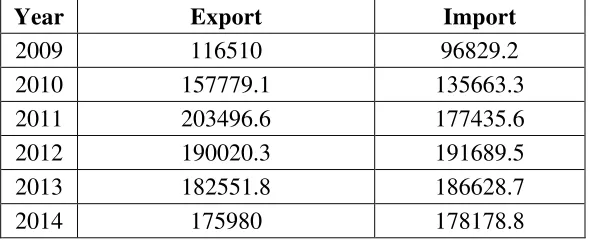
TABLE 1.3
The Export and Import Growth in Indonesia in Million US$
Net exports is the difference between the value of goods and services
export to other countries for goods and services imported from other countries.
In this case, exports in Indonesia has fluctuated in the last 6 years. From the
table 1.3 above, it conclude that the total import is greater than the total export
in Indonesia. It means that the directions net export growth rate of Indonesia
are in a negative direction within the last 6 years.
Through productivity gains, from the micro level, infrastructure can
promote economic growth. Kuznets in his theory mentioned that the economic
growth of a country is affected by the accumulation of capital, natural resources,
human resources, with a view of quantity and quality. On the other hand,
infrastructure can be categorized as capital accumulation. So, infrastructure can
be used as inputs to production indirectly.
Year Export Import
2009 116510 96829.2
2010 157779.1 135663.3
2011 203496.6 177435.6
2012 190020.3 191689.5
2013 182551.8 186628.7
2014 175980 178178.8
The developing countries has made an investment of 200 billion US
dollars each year for the construction of the new infrastructure (World Bank,
1994). With the investments were acquired, the expected increase value of
infrastructure will be better in the future, in fact sometimes the performance of
infrastructure is disappointing. One of the causes is an error in the allocation of
funds. For example, the development of infrastructure continued without
maintaining the existing infrastructure.
The effort to revamp the infrastructure conditions to realize an
important role in reducing inequalities of income and long-term effects for
gross domestic product is important. Improvements in infrastructure have
contributed to increasing productivity and is expected to support economic
growth in the long term (Maryaningsih, Hermansyah, & Savitri, 2014)
In this research, it focuses on the long road infrastructure in Indonesia
in Kilometer units. By having the best quantity and quality road infrastructure
in Indonesia, country will able to provide convenience in the distribution of
economic activities in the community. Based on World Bank in 2013, Roads
are the main transport in Indonesia, and the total road network recorded more
than 477,000 km with an asset value of more than 15% of GDP. However, the
number and quality of road infrastructure in Indonesia is still below neighboring
way to 70 trillion Rupiah per year (USD 7 billion per year), representing 40%
of total spending on infrastructure.
However, the level of investment of this magnitude cannot pursue
increased demand and growth in the last ten years. Productivity and efficiency
management of national roads are still less than optimal. The spending of
national roads has tripled in real terms between 2005 and 2011, but output
which is generated in the road length only rose 20% whether if counted from
the existing road or the road under construction.
With the progress that has been achieved, Indonesia still has to face the
problems that are faced by other countries, especially developing countries,
who are on development. The process of economic performance is affected by
two kinds of factors, namely, economic factors and non-economic factors.
Based on the terms describe above, the need for scientific assessments
of the factors that affecting economic growth in Indonesia is highly needed. In
this case the factors that will be analyzed are the factors in economic which are
foreign direct investment, export, infrastructure, and inflation rate.
B. Research Limitation
This research only limit in Foreign Direct Investment, Export and
Infrastructure especially in Road Length (in Km2), and Inflation Rate on
C. Research Questions
Based on the background, the researcher needs to formulate the problem
as the ultimate goals of this research which includes:
1. What is the impact of foreign direct investment on economic growth in
Indonesia in short and long run?
2. What is the impact of export on economic growth in Indonesia in short run
and long run?
3. What is the impact of infrastructure on economic growth in Indonesia in
short and long run?
4. What is the impact of inflation on economic growth in Indonesia in short
and long run?
D. Research Objectives
Based on the research questions, thus the objectives of this paper are:
1. In order to know about the impact of foreign direct investment on economic
growth in Indonesia in short and long run.
2. In order to know about the impact of export on economic growth in
Indonesia in short and long run.
3. In order to know about the impact of Infrastructure on economic growth in
Indonesia in short and long run.
4. In order to know about the impact of Inflation on economic growth in
E. Research Benefits
This study contributes useful information for parties which are
interested in Economic performance in Indonesia. The detailed of research
objectives will be explained below:
1. It can help to explain about the impact of foreign direct investment, export,
Infrastructure, and Inflation on economic growth in period 1981-2014.
2. It can help to increase the knowledge, experience, and as a place to practice
and apply science sciences knowledge has been gained while studying on
campus.
17
CHAPTER II
LITERATURE REVIEW
A. Theoretical Framework
1. Economic Growth.
a. The Definition of Economic Growth.
Economic growth can be defined as an increase in per capita real
output. It also defined as a broad perception that refers to the process of
economic growth that has capacity to raise the welfare of its people
(Berg, 2001).
According to Boediono (1982) economic growth is the
increasing of output per-capita in the long run. Economic growth is a
process, not an economic condition at a time. In this case, the dynamic
economic growth seen from the aspect of an economy, which is to see
how an economy grow or change over time. It is emphasized in itself to
changes or developments.
The economic growth represent as the development of the
activity in the economy that causes the good and services produced
increases in economic activity in the community, regarding growth and
development dimensional measured by the increased production and
income (Sukirno, 2002). It also can be said as one indicator is in seeing
development, growth is one of the conditions required in a development
(Meier, 1989).
b. Measuring the Economic Growth.
Economic growth occurs when an increase in the production of
goods and services. In the real world to record the number of units of
goods and services is a difficult thing to do. This is due to a wide variety
of goods and services produced in one period that have different sizes.
Therefore, the calculation uses to estimate the change in output which
is the value of money is reflected in the value Gross Domestic Product
(GDP). Gross Domestic Product (GDP) is the market value of all final
goods and services, produced in the economy in a country in a period
(Mankiw G. N., 2006).
There are two approaches to see the amount of GDP. The first
one is GDP as the total income from every person in the economic
activity, the second one is by seeing the GDP from the total output
(Mankiw G. N., 2007) . The income approach can be differentiated from
4 different types; wage or salary, rent and interest, and profit. While the
spending approach from each sector, namely; Consumption (C) from
household, Investment (I) from firm, Government Expenditure (G), and
Based on the explanation above, it can be concluded that the
economic growth is the growth on economy activity from the increasing
GDP and GNP in long-term without considering the population growth
and the economic structure change.
c. Economic Growth Theory.
The theory of economic growth determine as an explanation of
what factors determine the increase in output per capita in the long term,
and the explanation of how these factors interact with each other,
resulting in a process of growth. On these descriptions below are the
theories on economic growth(Boediono, 1982):
1) The General Theory of Economic Growth.
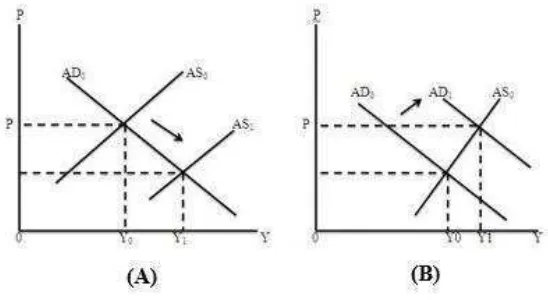
Based on Tambunan (2001), the economic growth can be
seen from two sources in which the aggregate demand from the
aggregate demand side. Based on figure 2.1, the equilibrium can be
reached if the demand curve and supply crossed on each other,
where the economic equilibrium result in output aggregate (GDP)
with the certain level. Next, the aggregate output will result in
national income. On the figure below, it will describe the initial
period (t = 0) output is the form from Y, that the economic growth
is the output from the following period, which is output=Y1, where
Based on the picture, it can be seen that the economic growth
occurred because the shift from the aggregate supply (AS) along
with the demand curve (part A) or the movement from the
aggregate demand (AD), along with the supply curve.
From the aggregate demand, the AD curve movement to the
right shows the increasing demand in the economic due to the
increasing factors of national income, including: consumers
demand, company and government. While from the aggregate
demand, the GDP usage namely; the household consumption, the
investment (I), government spending (G), and net export means the
goods and services export (X) minus the goods and services import Source: Tambunan, 2001
FIGURE 2.1
(M). The aggregate demand in the economy can be describe by the
equation below:
= � + ��+ + −
From the aggregate supply, there are two ways on describing
the phenomenon, which are; neo-classic theory and modern theory.
The neo classical theory regards the production function such as
labor and capital are influencing the output growth. While the
modern theory shows that the production functions are not only the
influence but also other variables, such as technology, energy,
entrepreneurship, and material. As an addition, the modern theory
also regards the economic growth is influenced by; infrastructure,
law, regulations, politic condition, the bureaucracy, and exchange
rate.
2) Adam Smith’s Theory.
Based on Adam Smith’s Theory in Sukirno (2002) total output in the economy is affected by the factors of production. The
factors of production namely capital, labor, and technology. From
those factors, it can be seen from the formulas the following
equation:
∆ = � �, , �
Y= Economic Growth
C= Capital
L= Labor
T= technology
Smith explains that country's production system consists of
three elements namely, available natural resources, human
resources or population, and the stock of capital goods. First,
Natural resources provided a means that most fundamental of the
production activities of a society. The second element is human
resources or population. In the process of growth of output
element is considered to have a passive role, in the sense that the
population will adapt to the needs of the community labor. The
last element is capital. Capital actively determines the output
level. Smith give a central role to the growth of the capital stock
or capital accumulation in the growth process output. In other
words, the output level depends on what happens to the stock
capital (Boediono, 1982).
3) Harrod-Domar Theory.
Harrod-Domar theory is the development of macro theory
Keynes short-term into long-term macro theory. This theory was
describes a long-term economic growth, because the keynes theory
is less complete in the long-term economic problems.
There are 4 assumptions in economic growth in
Harrod-Domar Theory. Firstly, in the economy there are full employment
and maximum use of capital. Secondly, the economy consists of
two sectors, namely the household sector and the corporate sector.
Thirdly is the amount of public savings is proportional to the
amount of national income, which means saving function starting
from the zero point. The last is the propensity to save in fixed
amount, as well as the capital output ratio and the incremental
capital output ratio (Jones, 1975).
In these assumptions explained that in order to increase the
rate of economic growth, country must increase savings. However,
economic growth is also seen in increasing the productivity of the
output from investment activities. The productivity of investment
is the amount of output that can be produced from one unit of
investment generated, where productivity can be measured by the
inverse of capital ratio output (∆�/∆� . Then, to determine the rate
of growth of total output is by multiplying the level of investment
that is contained in the savings ratio, s= I/Y with investment
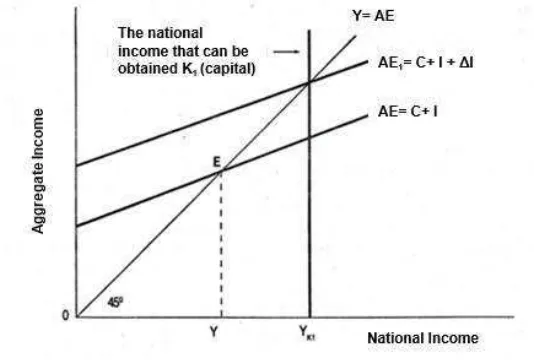
The figure 2.2 above explaining the Harrord-Domar theory
much further. The aggregate spending is the shape from AE = C +
I. The equilibrium in the point E describes; (i) national income is
Y and (ii) shows the national income from the economy reaches the
maximum capacity. For example, the capital in this equilibrium is
K0. Harrord-Domar theory shows that investment that invested in
the beginning of the year leads to the increasing value in the
following year, which is the capital from K1 = K0 + I, where K1
results in national income; so that, the initial equilibrium can be
reached again. This analysis shows the economic from two sectors
FIGURE 2.2
Theory of Harrod Domar: The Role of Investment in Economic Growth
that investment should always increase in order to increase the
economic growth. The increasing investment is highly needed to
increase the aggregate spending.
Harrord-Domar theory doesn’t focus the requirement to reach the maximum capacity if the economic is consisted with 3
sectors or 4 sectors. On that condition, the capital increases if AE1
= C + I1 + G1 + (X – M)1, where equal with I1 + G1 + (X – M)1. The
conclusion from Harrord Domar theory is that the theory completes
the Keynesian analysis. Keynesian focuses on the short-term
economic problem. While on Harrord Domar theory, it describes
the long-run economic problem. It describes the long aggregate is
needed to be reached to realize the economic growth. The robust
economic growth can be reached if I + G + (X – M) increases significantly with positive relationship.
4) Solow – Swan Theory.
The theory developed individually by Robert Solow from
MIT and Trevor Swan from the Australian National University and
the model is known as the Neo-classical growth model. This model
is similar to Harrod- Domar theory model that focuses on how the
and outputs interact each other in the process of economic growth
(Boediono, 1982).
Although the general framework of the Solow-Swan model
is similar with Harrod- Domar model, the Solow- Swan model is
more flexible. This is because the Solow- Swan models more easily
manipulated algebraically.
This model connects the output, capital, and labor in the
production function where the coefficients are unchanged (Qp = hK
and Qn = nN). This growth theory used general production
function, which can accommodate a wide range of possibilities for
substitution between capital (K) and labor (L). This function can
avoid the problem of instability and take new conclusions about the
distribution of income in the growth process the form of the
production function are:
� = ,
Assumptions used in the Solow model that tends to run into
diminishing returns capital. When labor supply is held constant,
then the accumulation of capital to increase output will always be
less than the addition earlier, reflecting the product of capital is
diminishing if it is assumed that there is no technological
capital indicates that the one point, increasing the amount of capital
(through savings and investments) is only enough to cover the
amount of capital losses due to depreciation. At this point the
economy will stop growing, because it is assumed that there is no
technological development or growth of the workforce.
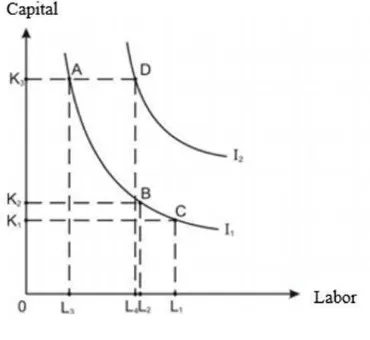
The Theory of Neo-classical illustrated in Figure 2.3.
Production function indicated by I2, I2, and so on. In the form of
the production function, a certain level of output can be created by
using various combinations of capital and labor. For example to
create an output of I1, a combination of capital and labor which can
be used include (a) K3 with L3, (b) K2 with L2, and (c) K1 with L1.
Source: Arsyad, 2004
FIGURE 2.3
Thus, even though the amount of capital changed but there is a
possibility that the output level unchanged.
Although the amount of fixed capital, the amount of output
produced can be changed. For example, if the amount of fixed
capital of K3, the amount of output can be enlarged to I2, if the
labors that work are added from L3 to L4.
In contradict to the Harror-Domar theory that assumes a
constant return with raw coefficients, meanwhile the neo-classical
solow growth model uses the concept of diminishing return from
worker and capital amount, if the two use distinct analysis. When
analyzed simultaneously, the assumption of neoclassical also use
the concept of constant return to scale. The advances in technology
are just set as residual factor to explain the long-term economic
growth. High or low growth is assumed to be exogenous or not
influenced by other factors.
d. The Factors that Determine Economic Growth.
1) Land and Other Natural Resources.
The wealth of a country includes extensive and good soil
quality, climate and weather, the number of forest products and
marine, and type of minerals produced. Natural wealth will be to
facilitate efforts to develop the economy of a country, especially at
Although the above stressed the importance of the role of
natural resources in the economic development of a country,
especially in the early days of the growth process, it does not mean
that economic development is highly dependent on the amount of
wealth of a country.
2) The Number and Quality of the Population.
The increasing of population time to time can be the trigger
or the barrier to the economic growth. The increasing the number
of population will raise the amount of labor, so it can increase the
amount of production. Another matter arising from population
growth to economic growth is the development of the broad market
and the goods produced by the company sector will increase.
Therefore, population growth will be conducive to stimulate the
increase in national production and the level of economic activity.
If the additional labor cannot increase the national
production level faster than the rate of population growth, per
capita income will decline. Thus, the excess population will lead to
decline in the people's welfare
3) Capital and Technology.
Capital is very important because it can improve the
efficiency of economic growth. Capital and modern technology
capital is increasing, but the quality of the technology has not
increased, the progress that occurs will not be significant.
4) Social System and Society Demeanor.
Social system and Society Demeanor is important in
realizing economic growth. Traditional customs that might
hamper the public to use modern producing system and increase
the productivity. Therefore, economic growth cannot be brought
forward.
2. Foreign Direct Investment.
There are two kinds of foreign investments in Indonesia which are
foreign direct investment and foreign indirect investment. Foreign direct
investment is the investment that apply in Indonesia territory by foreign
investor which investment comes in form of building and buying a company
or acquiring a company. Meanwhile, indirect foreign investment is made by
the capital market instrument such as securities, stock, and bond.
Foreign Direct Investment based on UU No. 25 year 2007 is the
planting of assets in the form of money or other forms that are owned by
foreigners in the form of individual or business entity.
Foreign direct investment is direct investment that has done by an
individual or company of another country, that focus into production or
business either by buying a company or expanding operation of an existing
According to (Macaulay, 2012) In (Kunle, et al. 2014) World Bank
in 1996 states foreign direct investment as an investment that is made to
promote a long-last management interest in an enterprise and operating in a
country other than that of the investors (define based on to residency) the
investor desire being an effective voice to earn long term capital as shown
in the nation balance of payments. Based on the UU No. 25 year 2007 in
(Agma) represent the purpose of investment as follows: increase national
economic growth, to create a vocation, to Increase the sustainable economic
development, to increase the capacity and capability of national technology,
and to develop community economy.
Generally, there are three main sources of foreign capital in a country
that apply open economic system, namely foreign debt, foreign direct
investment and portfolio investment. According to Wuryaningsih, et al.
2008 foreign borrowing by the government bilaterally and multilaterally.
Portfolio investment is investment made through the capital markets. Then,
foreign direct investment is an investment made by a private foreign
company to a particular country. The form can be a branch of a
multinational company, a subsidiary of multinational companies
(subsidiary), licensing, joint venture, or more.
Foreign capital inflows have been viewed by developing countries in
of foreign technology. This viewed is relevant, especially given the failure
of import substitution and the slowdown of technological progress in many
developing economies. The developing countries coveted the foreign direct
investment (FDI) by multinational enterprises (MNEs), FDI is seen as a
major tunnel for technology transfer. MNEs are the firms that produce and
market their products in more than one country (Berg, 2001).
FDI can also be divided into two types, namely Greenfield and
Acquisition. Investments by type Greenfield will build a new production
unit while FDI is a type of acquisition that buy part ownership of a company
that already exists (Kurniati, et al. 2007).
In macroeconomics, investment has two important roles in the
economy. First, investment is a major component of spending and provide
changes in demand and the business cycle. Second, the investment is a form
that leads to the accumulation of capital. If the additional shares of buildings
and equipment, it can affect the country and increase potential output
growth in the long term.
Based on the theory raised by Keynes, the investment amount is
determined by the interest rate. For employers, the interest rate is considered
to invest in a country. Then, the other factors that determine the behavior of
entrepreneurs in investing that the current economic situation and the future
3. Export.
Export is the activity of selling and sending goods from the origin
country to other countries. These activities can bring the flow of
expenditure will be flowed into the enterprise sector. Furthermore, the
aggregate expenditure will increase, this is because the export activities of
goods and services, and therefore the national income will also increase. If
net exports in a positive state, the aggregate expenditure will increase. Then
this will increase the national income and employment (Sukirno, 2013).
Exports are one of the component in aggregate spending on the
open-economy. Aggregate expenditure in an open economy means that the
household expenditure on domestic production, investment, government
spending, spending on imported goods and foreigner who spend the export
goods. The aggregate expenditure can be expressed by this following
formula:
� = ��� + � + + −
Another theory that is used in the export is the basic theory of export.
The basis theory is that the economic basis that is developing from the basis
export becomes the city basis. From all of the theories, all are stressing on
the demand from the external sides. On the city theory, there is a division
In export theory it can be described as the autonomic factor. It means
that export is a factor to increase the income and economic growth directly.
To reach the high export level, then it needs the strategy to increase the
appropriate export value and appropriate investment with the high
technology to be implemented punctually (Adisasmita, 2013).
4. Infrastructure.
Infrastructure is the capital stock that provides public goods and
services. Infrastructure will affect the production activities and quality of
life for the households. Infrastructure is a fundamental factor behind
economic growth. This variable has shown its long-enduring significance
(Yoshino & Nakahigashi, 2000).
Infrastructure refers to the physical facility and organizational
framework, knowledge and technology that is essential to society and
economic growth. Infrastructure includes laws, public health and education
systems, distribution systems, and transportation systems and public
utilities.
In the economics, infrastructure is a form of public capital, which
formed from the investment made by the government. In this study,
infrastructure including roads, bridges, and sewer system (Mankiw G. ,
Infrastructure means that the relatively of large physical capital
facilities and organizational, knowledge and technological frameworks that
together become a fundamental to the organization of communities and the
economic development of the communities. Besides that, legal, educational
and public health systems, water treatment and distribution, garbage and
sewage collection, treatment and distribution system, treatment and
disposal, public safety systems, such as fire and police protection,
communications systems, public utilities and transportation systems. The
federal government’s principal involvement in infrastructure formation
involves the military, legislative and judicial functions(Tatom, 1993).
Modernization of the economy requires modern infrastructure as
well, due to various economic activities require the infrastructure to
develop, such as roads and bridges, airports, ports, industrial estates,
irrigation and water supply, electricity and telephone networks need to be
developed. The various types of infrastructure is needed by the company to
the efficiency of its operations.
Infrastructure development should be in harmony way with
economic development. At a low stage of development, the necessary of
infrastructure is still limited. At this level of development is based on the
construction of roads, bridges, irrigation, electricity and other infrastructure
the economic development that has been achieved and realized and that will
be realized in the future(Sukirno, 2013).
Based on the type, the infrastructure is divided into 13 categories as
follows (Grigg, 1988):
- The water supply system: reservoirs, water storage, transmission
and distribution, and water treatment facilities (treatmentplant),
- Waste water management system: collection, processing,
disposal, and recycling,
- Facility waste management (solid),
- Facilities flood control, drainage and irrigation,
- Inland waterways and navigation facilities,
- Facility of transport: road, rail, airports, as well as other
complementary utilities,
- Public transit systems,
- Electrical systems: production and distribution,
- Natural gas facilities,
- Public Buildings: schools, hospitals, government buildings, etc.,
- Public housing facility,
- Garden City: the park is open, plaza, etc., as well as
Based on the thirteen types of infrastructure above, then the type of
infrastructure is grouped into seven major groups as follows:
- Transportation (roads, highways, bridges),
- Transport services (transit, airports, ports),
- Communications,
- Flooded (water, wastewater, flooded the system, including the
water that rivers, open channels, pipes, etc.),
- Waste management (solid waste management system),
- Building, as well as
- Distribution and production of energy.
5. Inflation Rate
Inflation is an increase in the general price level of commodities and
services during a specific time period. Inflation is regarded as a monetary
phenomenon due to the impairment of the monetary calculation unit to a
commodity (Greenwald, 1998).
Inflation is one of the problems that need most attention by the
government. The long term goal of government is to keep the inflation rate
at the lowest level. The three kinds of inflation based on the causes of
inflation that is demand-pull inflation, cost-push inflation, and imported
Demand-pull inflation occurred in the economy is growing rapidly.
The higher employment causes high levels of income, and this will cause
expenses that exceed the ability of the economy to pull out of goods and
services. Excessive spending will cause inflation.
Cost-push inflation happens when the level of unemployment at the
lowest level. If the company is still facing the increasing of production
demands, they will keep increase the production cost by providing the
higher salaries to their workers, and look for new workers with higher
payments. Consequently, the increasing of cost production will increase the
price level of goods.
Imported inflation occurs when the price of import goods
increasing. This kind of inflation can be illustrated by the real problem in
the world, the effect of increasing oil price on 1970s toward to western
economies, and the other oil-importing countries.
Based on the rapidity of the increasing level of price, inflation can
define as three categories such as, creeping inflation, moderate inflation,
and hyperinflation. The creeping inflation occurred when the rapidity of the
increasing level of price is slow. The increasing of price level does not
exceed 2 or 3 per cent a year. Then, the hyperinflation is a process of the
rapid level of increasing price. In the developing countries, the level of
average level of the inflation is 5 until 10 per cent a year, and this is called
as the moderate inflation.
The high inflation will not trigger the economic growth. The
increasing of production cost causes the productivity is not beneficial.
Usually, the owner of capital prefer to use their capital as the speculation.
The increasing of price level can give bad impact on international trade. It
causes the goods from that country in high inflation, cannot compete in
international market. As the result, export will decrease and the price of
import goods will decrease as well. The decreasing price of import goods
will effect on frequently import activities. Finally, from those problem can
cause the instability of the exchange rate circulation and the worsening of
balance of payment.
Besides inflation give a bad effect on the country, inflation can also
give a bad effect on the individual and society. Firstly, inflation will reduce
the real income of the people who have a fixed income. Generally, the
increasing of wage level not as fast as the increasing of price level.
Therefore, inflation will decrease the individual real wage who have the
fixed income. Secondly, inflation will reduce the amount of wealth
(money-from). Thirdly, inflation makes the distribution of wealth unwell. As
explained earlier, the fixed income will experience the degradation in the
real-income, but the owner of the fixed asset such as; land, houses can
B. Previous Study.
According to Pranoto (2016), simultaneously exports has a significant
and positive effect on the gross domestic product, while foreign direct
investment has a significant and negative impact in Indonesia 2004 until 2013.
This analysis was performed using linear regression analysis.
Based on Irsania and Noveria (2014) in their research titled “the Relationship among Foreign Direct Investment, Inflation Rate, Unemployment
Rate, and Exchange Rate to Economic Growth” reveals that FDI, inflation rate,
and exchange rate has a significant influence towards economic growth. But
FDI and unemployment have a positive correlation. The rest variables have
negative correlation. This research used multiple regression as a method.
From the result of Koojaroenprasit (2012) by using the multiple
regression, the findings shows that foreign direct investment has a strong
positive impact on South Korean Economic Growth. Furthermore, this finding
indicates that human capital, employment and export also have positive and
significant impact, while domestic investment has no significant impact on
economic growth in South Korea.
Research from Mofrad (2012) shows the study on The Relationship
between GDP, Export, and Investment: Case Study Iran shows that there exist
a positive and significant long-term and short-term relationship between
investment and export with GDP in 95% confidence level. This study used the
According to Sojodi, et al. (2012) the research that used ARDL Method
indicated the transportation facilities distinctively length of railway. Roadway,
and telecommunication infrastructure (fixed phone line) have positive and
significant impact on economic growth.
Study from Wibowo (2016) explains that the road infrastructure has no
significant impact on economic growth in Indonesia period 2006 until 2013. On
the other hand, electricity, health, and education has positive significant impact
on economic growth in Indonesia.
The development of infrastructure in a country is a major influence on
economic growth in a country (macro and micro) and the development of a
country. However, it is not easy to apply in Indonesia. Moreover, since the 1997
crisis which eventually widened into a multidimensional crisis impact can still
be felt today (Haris, 2005).
The other study finds that foreign direct investment has significant
impact on gross domestic product in Indonesia and vice versa. This study shows
that there is two way relationship between FDI and GDP. This study used Engle
Granger (EG-ECM) based on the theorem of granger’s representation
(Wuryaningsih, Setyowati, & Kuswati, 2008).
Research from Kasidi and Mwakanemeda (2013) investigated that
inflation has a negative impact on economic growth in Tanzania. There was no
co-integration between inflation and economic growth during the period 1990
economic growth in Tanzania. This research used regression equation as the
method.
Study from Acyumida and Eko (2013) employs that the Granger Causality of GDP has no causality relationship on inflation. On the contrary, there is a causality relationship between Inflation on GDP in Indonesia period
2000 until 2013.
From the result of Izuchukwu and Patricia (2015) noted in their study
about the Impact of Inflation on Economic Growth in Nigeria period 2000 until
2009 that the inflation has a significant impact on economic growth in Nigeria.
In addition, exchange rate has a positive impact on economic growth and that
high interest rate discourages investment and hence forestalls economic growth.
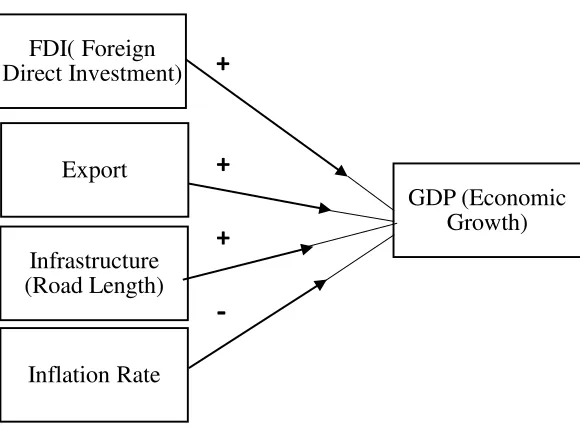
C. Hypotheses
On the paragraph below are the hypotheses based on the previous study
and theoretical framework:
1) Foreign Direct Investment has a significant and positive impact on
economic growth in Indonesia both in long-run and short-run.
2) Export has a significant and positive impact on economic growth in
Indonesia both in long-run and short-run.
3) Infrastructure has a significant and positive impact on economic growth in
Indonesia both in long-run and short-run.
4) Inflation has a significant and negative impact on economic growth in
+
+
+
-
D. Research Framework
FIGURE 2.4
Research Framework
GDP (Economic Growth) FDI( Foreign
Direct Investment)
Export
Infrastructure (Road Length)
44
CHAPTER III
DATA AND RESEARCH METHODOLOGY
A. Research Object
This research used quantitative method, so this research using deductive
approach. Quantitative method is a method that stems from numerical data to be
processed into information. So that the quantitative method is a method that is
numeric and statistical analysis and then processed into information (Kuncoro,
2003).
In quantitative research there are two variables that serve as a model, the
independent variables and the dependent variable. In this study, there are five
variables that will be used i.e. one dependent variable, and four independent
variables. The dependent variable used is economic growth denoted as gross
domestic product, while the independent variable is foreign direct investment,
exports, infrastructure, and inflation.
B. Type of Data
This research used secondary data annually in times series data. The
observation period is from 1981 to 2014. The data that used in this study are as
follows:
1. The data of Indonesia economic growth using gross domestic product (GDP in
2. The data of Indonesia foreign direct investment in this research using the net
inflows in current US$ which is collected from World Bank and The
Investment Coordinating Board (BKPM).
3. The data of export in Indonesia using the data of export in current US$ which
is collected from World Bank publications.
4. The data of Infrastructure is focused on the total length of roads in Indonesia
(kilometers) which is collected from Central Bureau of Statistics (BPS)
publications.
5. The data of Inflation Rate in Indonesia using the percentage data which is
collected from World Bank publications.
C. Data Collection Technique
Data collection technique that is used in this study was a non-participant
observer, where researchers only looked at data that is already available without
become part of a data system.
D. Operational Data of Variables
The definition of research variables is used to prevent errors in analyzing
the data. The definitions of each variable is described as follows:
1. Economic growth Gross Domestic Product (GDP) is the market value of all
final goods and services, produced in the economy in a country in a period
2. Foreign direct investment is direct investment that has done by an individual
by buying a company or expanding operation of an existing business in that
country.
3. Export is the activity of selling and sending goods from the origin country to
other countries.
4. Infrastructure is a form of public capital, which formed from the investment
made by the government. In this study, infrastructure including roads, bridges,
and sewer system.
5. Inflation is an increase in the general price level of commodities and services
during a specific time period. Inflation is regarded as a monetary phenomenon
due to the impairment of the monetary calculation unit to a commodity.
E. Analysis Method
The analysis method in this research is Error Correction Model (ECM). By
using descriptive quantitative approach, error correction model is used to determine
the effect of independent variables on the dependent variable in the long term and
short term. Short term is usually an economic behavior less than one year. It could
be monthly, quarterly, or annually. Yet in this research, the short term could be
define as the effect for one to two years. However, in the long term is usually an
economic behavior for more than one year. The period is rarely determined by the
researchers. This could be periods for more than two years. Especially in this
research, the effect might occur during the periods of research (33 years).
The quantitative approach is used by using the econometric model