WARPAGE ANALYSIS VERIFICATION BETWEEN SIMULATION
AND EXPERIMENTAL OF DUMBBELL PLASTIC PART IN THE
INJECTION MOULDING PROCESS
Mohd Amran1, Siti Salmah 1, Zolkarnain Marjom2, Umar Al-Amani2, Raja Izamshah1, Mohd Hadzley1, Zulkeflee Abdullah1, Mohd Sanusi1
1
Faculty of Manufacturing Engineering, Universiti Teknikal Malaysia Melaka, 76100 Hang Tuah Jaya, Melaka, Malaysia
2
Faculty of Engineering Technology, Universiti Teknikal Malaysia Melaka, 76100 Hang Tuah Jaya, Melaka, Malaysia Email: [email protected], [email protected], [email protected], [email protected],
[email protected], [email protected], [email protected], [email protected] ABSTRACT : Injection moulding is widely used to produce a variety of plastic parts. Its process involved
various process parameters, which plays an important roles in influencing the quality and productivity of plastic parts. In this case, the application of Computer Aided Engineering (CAE) software is essential to enhance the quality of plastic parts in the injection moulding industry. This paper deals with the application of Moldflow Plastic Insight (MPI) intergrated with a statistical technique using Taguchi Method. The purpose of this application is to study the effect of process parameters on warpage deflection in dumbbell plastic part. Subsequently, the result of CAE simulation was validated with the aid of experimental data result. The Process parameters involved in this study were core temperature, cavity temperature, melt temperature and cooling time. Based on the simulation and experimental results, it was found that the most significant parameter affected warpage deflection is cavity temperature, followed by core temperature, melt temperature and cooling time. In addition, the results show that the minimum and maximum percentages of the differential of warpage deflection between the simulation and experiment are 4% and 10.89% respectively. Thus, this indicates that there is a good agreement between the simulation and the experimental data result.
KEYWORDS: Injection moulding, warpage analysis, moldflow software, taguchi method, experimental validation
1.0
INTRODUCTIONInjection moulding is one of the common processes involved in plastic industry. However, injection moulding is a complex process due to many adjustments required, such as the part design, mould design, machine performance and process parameter setting. These adjustments are necessary to produce good quality plastic part [1]. It is well known that process parameter setting is the first interactive corrective actions that should be performed to reach quality requirements [2,3].
Enormous process parameters need to be controlled during injection moulding. Generally, the process parameters setting involved in injection moulding can be grouped into four basic categories. They are the temperature, pressure, time, and distance, with the temperature being the most affected parameter on the plastic part quality [4]. Hence, the process parameters selected on this study are the melt temperature, cooling time and the differential temperature between the core and the cavity.
Trial and error method has been widely applied in industrial practitioner for the purpose of finding the optimum parameters setting for the injection moulding process. However, this approach is unsuitable due to the waste of time taken for parameters setting and the waste of plastics material, which result in a reduced productivity [5]. Therefore, application of CAE integrated with statistical technique is widely used in injection moulding industry. Proper interpretation of results from the simulation will be able to predict the defected part of plastic and analyze the relationship of parameters, leading towards zero production defect [6].
Several researchers have studied the effects of injection moulding process parameters on warpage defect. Using experimental analysis, S.H. Tang et al. [7] employed the Taguchi method and ANOVA to identify the injection moulding parameters that contribute to warpage defect. They figured out that the most significant parameters contribute on warpage was the melt temperature. H. Oktem et al. [8] studied the effect of process parameters on warpage defect using simulation, and they found that packing pressure was the most important parameter that is affected on the warpage deflection. This is followed by packing time, injection time and cooling time. In addition, Huang and Tai [9] studied that the warpage consequences of a thin shell moulded parts using simulation. Taguchi method was applied and it was found that the packing pressure was the most significant factor that affected warpage. In this respect, we concluded that most researchers used either simulation method or experimental method to study warpage defect.
The study reported in this paper, investigated the verification of simulation and experimental study on warpage deflection. The effect of process parameter on warpage deflection is studied using dumb-bell plastic part in the injection mould process that integrates the Taguchi approach as the statistical analysis method.
2.0
METHODOLOGY2.1
Parameters Setting11g/10min at 230˚C. The injection moulding machine used
in this experiment was Arburg 420C 800-250. Two plate injection dumbbells mould were used to produce the plastic part in this study. Table 1 shows the controllable parameters and the selections of level in this study. The selection level of the parameters for core and cavity temperature were based on the capability of the water chiller model W-05 and the mould temperature controller model MX-6 supplied from Active Machineey Enterprise Sdn. Bhd. Further, the levels of melting temperature and cooling time were obtained from our previous study using the simulation Moldflow software [2]. Since four input parameters and three levels were used in this study, the L9 orthogonal array was selected. The selection of the orthogonal array selected was done using the Taguchi method, and it produced 9 number of trial runs. It is based on the standard orthogonal array applied in the Taguchi method. Each run was conducted randomly to reduce potential statistical error.
2.2
Simulation workPlastic Insight (MPI) in Moldflow software was used in the simulation to observe the warpage deflection on the plastic part. There are a few steps that should be completed before running the simulation using the Moldflow Plastic Insight (MPI) analysis. Firstly, the part was drawn in 3D solid modelling using a solid work software. The dimension of the part is 162mm x19mm x3mm. Then, the 3D solid modelling part was imported into the Moldflow software, which it subsequently undergo a meshing process. The simulation of warpage deflection began after the meshing process is completed. The warpage deflection analysis of simulation was carried out under the following assumptions:
Environmental temperature was assumed constant.
Water as coolant fluid was used to control mould at core side for cooling purpose meanwhile cavity side was controlled by oil for heating purpose.
Only warpage deflection for Y-component was taken into consideration in this paper. It is because warpage deflection for Y-component indicates the warpage deflection from original flatness of the part.
Finally, the effect of process parameters including the core temperature, cavity temperature, melt temperature and cooling time on warpage deflection was analysed using a matrix from Taguchi design as shown in Table 2.
2.3
Experimental workThis experimental work was done by changing the process parameters setting using matrix for the Taguchi design as shown in Table 2. To ensure the parameters setting were properly in adaptable condition during the conduct of this experiment, the samples of specimen were collected after 15 shots for each process setting, prior to the performance of each run. The purpose of this collection was to ensure that the change of process setting was in a homogenous state. During this experiment, the mould at the core side cavity temperature was controlled by using a chiller mould temperature controller and the mould at the cavity side was controlled by using a heater mould temperature controller. A chiller was used to control the core side using water as the coolant fluid at the early stage. The heater was controlled at
the cavity side by using oil as the coolant fluid medium for the heating
state. Meanwhile, the melting temperature
and cooling time were directly controlled from the
control panel of the injection moulding machine.
3.0
RESULTS AND DISCUSSION3.1
Simulation and Experimental ResultsTable 2 shows the value of warpage deflection on dumbbell plastic part in injection moulding process using simulation and experimental method. Result shows that the minimum differential percentage between simulation and experimental is 4% for sample run no 8. While the maximum differential percentage of simulation and experimental is 10.89% for sample run no 1.
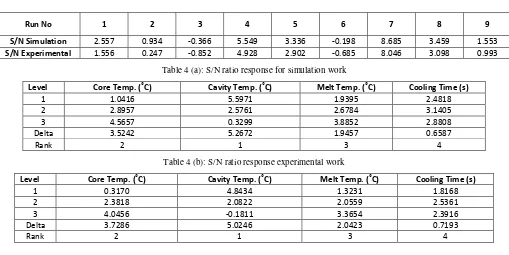
Figure 1 shows the example of interpretation warpage deflection analysis that used simulation for all effects in Y component for run number 1. Warpage deflection pattern is scaled 5 times larger to understand and magnify the shape of component after deflection.
3.2
Signal to Noise (S/N) Ratio for Simulation and Experimental WorkTable 3 shows the S/N ratio that was used in the Taguchi method to measure quality characteristic deviated from the desired value. The results show that the quality characteristic Gradually improves as the run number becomes smaller. This is in line with the aim of this project that is to minimize the warpage index within optimal process parameter. Generally, the S/N ratio for simulation work is larger as compared to S/N experimental work.
Table 1: Controllable parameters and levels
Parameters Level
Table 2: Simulation and Experimental Warpage Analysis
Table 2: Simulation and Experimental Warpage Analysis
Run N o
Core Temp.
˚C
Cavity Temp.
˚C
Melt Temp.
˚C
Cooling Time
(s)
Warpage Deflection (mm) Differential
Percentage (%)
Simulation Experimental
1 15 70 225 4 0.745 0.836 10.89
2 15 90 240 6 0.898 0.972 7.61
3 15 110 255 8 1.043 1.103 5.44
4 25 70 240 8 0.528 0.567 6.88
5 25 90 255 4 0.681 0.716 4.89
6 25 110 225 6 1.023 1.082 5.45
7 35 70 255 6 0.368 0.396 7.07
8 35 90 225 8 0.672 0.700 4.00
9 35 110 240 4 0.836 0.892 6.28
Figure 1: Deflection all effects in Y-component
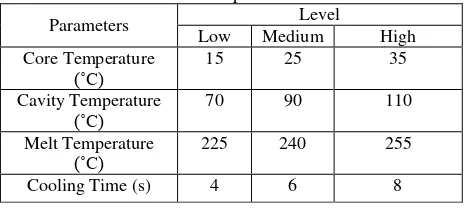
Table 3: Signal to Noise (S/N) ratio of simulation and experimental work.
Run No 1 2 3 4 5 6 7 8 9
S/N Simulation 2.557 0.934 -0.366 5.549 3.336 -0.198 8.685 3.459 1.553
S/N Experimental 1.556 0.247 -0.852 4.928 2.902 -0.685 8.046 3.098 0.993
Table 4 (a): S/N ratio response for simulation work
Level Core Temp. ˚C Cavity Temp. ˚C Melt Temp. ˚C Cooling Time (s)
1 1.0416 5.5971 1.9395 2.4818
2 2.8957 2.5761 2.6784 3.1405
3 4.5657 0.3299 3.8852 2.8808
Delta 3.5242 5.2672 1.9457 0.6587
Rank 2 1 3 4
Table 4 (b): S/N ratio response experimental work
Level Core Temp. ˚C Cavity Temp. ˚C Melt Temp. ˚C Cooling Time (s)
1 0.3170 4.8434 1.3231 1.8168
2 2.3818 2.0822 2.0559 2.5361
3 4.0456 -0.1811 3.3654 2.3916
Delta 3.7286 5.0246 2.0423 0.7193
(a)
(b)
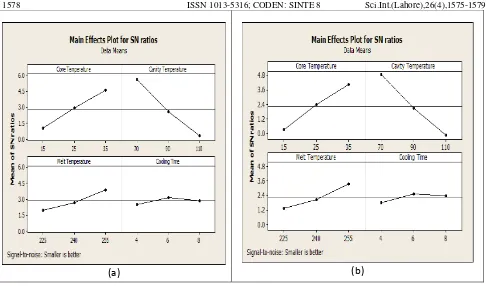
Figure 2: S/N response diagram (a) simulation (b) experiment
method is the ability to identify the impact of parameters on output response and optimization of process parameters from S/N ratio response table and S/N response diagram. The highest value of signal to noise among the levels S/N response diagram represents the optimum level of the parameters. Hence, it is found that the optimum parameters for simulation work are the core temperature 35˚C at level 3,
cavity temperature 70˚C at level 1; melt temperature 255˚C
at level 3 and cooling time 6s at level 2. This combination for optimum parameters is similar as run no 7 for initial run, which shows the minimum warpage deflection. Futhermore, as shown in Figure 2 (b), the experimental work result shows similar results with the results from the simulation work. The optimum parameters for experimental work shows the
core temperature 35˚C at level 3, cavity temperature 70˚C at
level 1, melt temperature 255˚C at level 3 and cooling time 6s at level 2. This result shows that simulation and experimental work provides a good combination for predicting the quality of plastic part. It is supported by S. Sannen et al. [11] who also stated that there is a good agreement between the simulation and experimental results in their paper.
4.0
CONCLUSIONIn this paper, the effect of process parameters on warpage deflection was studied using Moldflow Plastic Insight (MPI) with the integratin of the Taguchi method as the statistical tool. It shows that the most significant parameter affecting warpage deflection is the cavity temperature, followed by the core temperature, melt temperature and cooling time. The verification of warpage deflection between minimum and maximum of simulation on experimental are 4.00% and
10.89% respectively. Thus, it shows that the result of the flow simulation work can help industrial practitioners to predict plastic part defects and consequently enhance the plastic part quality.
ACKNOWLEDGEMENTS
The authors acknowledge Universiti Teknikal Malaysia Melaka (UTeM) for the support of this research project under the fundamental research grant scheme with grant no. FRGS/1/2014/TK01/UTEM/02/3.
REFERENCES
[1] P. K. Bharti, M. I. Khan, and H. Singh, “Recent methods for optimization of plastic injection molding process – a retrospective and literature review,” Int. J. Eng. Sci. Technol., vol. 2, pp. 4540–4554, 2010.
[2] M. Amran, S. Salmah, M. Zaki, R. Izamshah, M.
Hadzley, S. Sivarao, M. S. Kasim, and M. Amri, “The
effect of pressure on warpage of dumbbell plastic part in injection moulding machine,” Adv. Mater. Res., vol. 903, pp. 61–66, 2014.
[3] M. Yamaguchi, K. Fukuda, T. Yokohara, M.A.B.Md Ali,
S. Nobukawa, “Modification of Rheological Properties
Under Elongational Flow by Addition of Polymeric Fine
Fibers,” Macromol. Mater. and Eng., vol. 297, pp. 654-658, 2012.
[4] N. C. Fei, N. M. Mehat, and S. Kamaruddin, “Practical applications of taguchi method for optimization of processing parameters for plastic injection moulding: a
[5] S. D. Savransky, Engineering of Creativity: Introduction to TRIZ Methodology of Inventive Problem Solving, Illustrate. CRC Press, United States, America: 2000. [6] M. A. Amran, M. Hadzley, R. Izamshah, A. Hassan, S.
Samsi, and K. Shahir, “Optimization of gate, runner and sprue in two-plate family plastic injection mould,” AIP Conf. Proc., vol. 1217, p. 309, 2010.
[7] S.H. Tang, Y.J. Tan, S.M. Sapuan, S. Sulaiman, and N.
Ismail, “The use of taguchi method in injection moulding
for reducing warpage,” J. Mater. Process. Technol., vol. 182, pp. 418–426, 2007.
[8] H. Oktem, T. Erzurumlu, and I. Uzman, “Application of taguchi optimization technique in determining plastic injection molding process parameters for a thin-shell
part,” Mater. Des., vol. 28, pp. 1271–1278, 2007.
[9] M. C. Huang and C. C. Tai, “The effective factors in the warpage problem of an injection-molded part with a thin
shell feature,” J. Mater. Process. Technol., vol. 110, pp. 1–9, 2001.
[10] Z. Shayfull, M. F. Ghazali, M. Azaman, S. M.
Nasir, and N. A. Faris, “Effect of differences core and
cavity temperature on injection molded part and reducing
the warpage by taguchi method,” Int. J. Eng. Technol., vol. 10, pp. 133–140, 2010.
[11] S. Sannen, M. De Munck, J. De Keyzer, and P. Van
Punvelde, “Water-assisted injection molding: validation