Implementation of Value at Risk In LQ 45 Stocks in Indonesia
Diah Novitasari* Dr.Firman Pribadi, MSi**
ABSTRACT
Value at Risk is one measure used to measure the maximum potential loss that will be experienced in the
period of a day, five days and twenty days.In this study, the methodology used is Variance Covariance models and
Historical models.Object of research include 6 shares for 3 consecutive years (2012 to 2014) was recorded on LQ
45. Potential losses are measured on a confident level of 95%. And this validity model was tested by conducting
back testing with Kupiec Test, where the potential maximum loss calculation results compared with a loss actually
occurred.Back test measurement results indicate that the potential loss of Variance Covariance model is smaller
than the Historical models, but both models are declared valid in measuring the potential maximum loss of LQ 45.
Keywords: Value at risk, Variance covariance, Historical, LQ 45, Back test, Kupiec
*Student, Master of Management, Faculty of Postgraduate, Universitas Muhammadiyah Yogyakarta, Indonesia
Introduction
Risk is part of life.Avoid all risks will result in
no achievement, no progress and no reward.Risk
management is a systematic process to understand,
evaluate and handle such risks to maximize the
chances of goals achieved and ensure organizations,
individuals and a sustainable society.In risk
management there are several forms of risk, one of
which is the market risk.Market risk arises because
the market price moves towards the detriment of the
company.One form of investment is affected by the
stock market risk.The stock price is always changing
prices or commonly referred to fluctuations.Stock
price fluctuations closely associated with risk.The
risk is a financial risk that requires risk management
to minimize these risks.Risk measurement will
happen requires a quantitative risk measurement
methodologies, one of which is the Value at
Risk (VaR).
Value at Risk (VaR)is a measure that can be
used to assess the worst loss that might occur for an
investor or an entity on its investments in securities or
assets, either individually or in the form of a portfolio
within a certain period with level opportunities that
have been set.Models for calculating VaR is diverse,
but in general the VaR measurements follow a
common process that is often used by experts in the
calculation of market risk.There are several methods
of measuring VaR which can be grouped in a
parametric approach, non-parametric and
semi-parametric.Parametric approaches include 1) the
variance-covariance approach, and 2) GARCH.
Non-simulation approach, 2) Monte Carlo Non-simulation
approach;and 3) simulation approach bootstrapping.
Objective of the study
The main purpose of this study is two
sections.The first part, theoretical comparison of
different methods of estimation of VaR. The main
purpose of theoretical analysis VaR approach is to
ensure that the reader build a basic knowledge of the
most common VaR methodology. Although VaR is
conceptually simple, its implementation in practice is
not straight forward. This is because there are a
myriad of different alternatives, each with their own
pros and cons, which comes from the hypothesis
underlying the methodology. More precisely, the
study considers two methods, namely: (i)
Variance-Covariance (standard Risk Metrics model) and (ii)
Historical simulation. Comparison of theoretical
approach emphasizes the lack of them, in cognizance
that they provide a potential shortage of motivation
for VaR backtesting. The second part of this work is
to provide a review of empirical studies of the theory
and practice of VaR backtesting as a reality check for
the estimated VaR. The goal is not only to ensure the
accurate estimation of VaR but also to ensure the
prudent use of capital
Research methodology
Variables used in this study is the closing
price (close price) six shares in three years, the period
January 2012 - December 2014 are accessible on
Realty Tbk.(ASRI.JK), shares of Bank Rakyat
Indonesia Tbk.(BBRI.JK), shares of Bank Mandiri
Tbk.(BMRI.JK), shares of Tambang Batubara Bukit
Asam (Persero) Tbk.(PTBA.JK), and the stock
United Tractors Tbk.(UNTR.JK).
Historical data of the six stocks in the
portfolio is processed and formed using the method of
Markowitz, then historical data simulated by the
Variance Covariance model and the Historical
model.Also established a portfolio of simulation
data, then look for a portfolio VaR of historical data
and simulated data Variance Covariance.Then the
data is tested by Kupiec’s back test to know the
model used is valid or not.
Result
Results of calculation of the maximum
amount of potential losses undiversifed (VaR) for a
period of 1 next day, 5 days and 20 days in advance
for each model. In the calculation of Variance
Covariance VaR model uses the assumption that the
change in value of an asset within a certain period
would normally distributed. If the change value does
not normally distributed should be corrected by
adjusting the confident interval parameter (α). Adjustments are made by using the formula
Cornish-Fisher expansion. VaR indicates the maximum
potential financial losses on the assets or portfolios
held in the period of use with a certain confidence
level. This value applies both to an individual asset or
portfolio of assets. For individual asset values
indicated by the VaR Undiversified, whereas for
portfolio assets will be indicated by the value of VaR
diversified. VaR calculation values have diversified
into account the weight of the individual assets to
total assets of the portfolio. The maximum loss is
indicated by the value of VaR diversified but
undiversified VaR value can describe the contribution
loss if the stock stands out as an individual. Based on
the calculation of VaR with a time horizon of one day
in the future, the next 5 days and 20 days ahead
overall share are presented in Table 1 below:
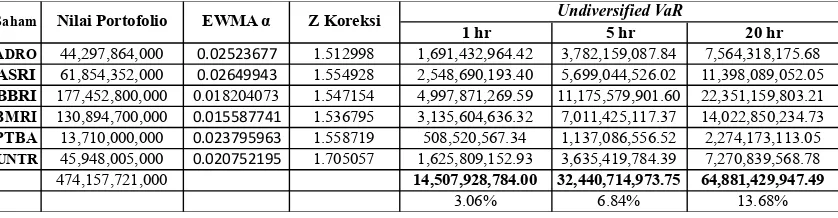
Table 1 Value at Risk – Variance Covariance (Undiversified) shows that the calculation of the undiversified VaR 1
day at 3.06%, VaR 5 days at 6.84% and VaR 20 days at 13.68% of the total exposure
1 hr 5 hr 20 hr
ADRO 44,297,864,000 . 1.512998 1,691,432,964.42 3,782,159,087.84 7,564,318,175.68
ASRI 61,854,352,000 . 1.554928 2,548,690,193.40 5,699,044,526.02 11,398,089,052.05
BBRI 177,452,800,000 0.018204073 1.547154 4,997,871,269.59 11,175,579,901.60 22,351,159,803.21
BMRI 130,894,700,000 . 1.536795 3,135,604,636.32 7,011,425,117.37 14,022,850,234.73
PTBA 13,710,000,000 . 1.558719 508,520,567.34 1,137,086,556.52 2,274,173,113.05
UNTR 45,948,005,000 . 1.705057 1,625,809,152.93 3,635,419,784.39 7,270,839,568.78
474,157,721,000 14,507,928,784.00 32,440,714,973.75 64,881,429,947.49
3.06% 6.84% 13.68%
Based on the results of the calculation of VaR for 6
shares with a time horizon of one day it appears that
the maximum amount of losses that will be incurred
over the ownership of 6 shares in the coming days
with a confidence level of 95% is equal Rp.
14,507,928,748.00 or by 3.06% of the total stock
investment portfolio exposure, on 5 days maximum
amount of losses that will be incurred over
ownership of 6 shares is equal Rp.
32,440,714,973.75 or 6.84% of the total stock
investment portfolio exposure, and on 20 days
maximum amount of losses that will be incurred is
Rp. 64,881,429,947.49 or 13,68% of total stock
investment portfolio exposure.
Diversified portfolio VaR calculations to be done by
calculating the weighted VaR weighting of each
stock in the portfolio, with the following steps :
1. Set the number of exposures stock
2. Establish the volatility of the portfolio by value
Variance Covariance Matrix
3. Assign the value of Z Score
Diversified portfolio VaR calculation is as follows :
Variance Portfolio : 0.007560787
Skewness : 1.594899
5 % Z -Score : 1.644853627
Z- Correction : 1.191400893
Exposure number : 474,157,721,000
Results on diversified overall portfolio VaR looks
like Table 2 below :
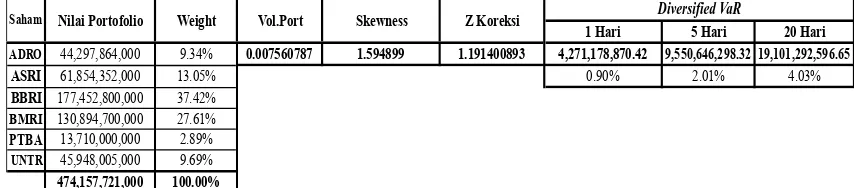
Table 2 Value at Risk Variance Covariance (Diversified) shows that the calculation of diversified smaller value than
undiversified
1 Hari 5 Hari 20 Hari
ADRO 44,297,864,000 9.34% 0.007560787 1.594899 1.191400893 4,271,178,870.42 9,550,646,298.32 19,101,292,596.65
ASRI 61,854,352,000 13.05% 0.90% 2.01% 4.03%
BBRI 177,452,800,000 37.42%
Saham Nilai Portofolio Weight Vol.Port Skewness
Based on Table 1 and Table 2, it appears that the
results of the calculation of VaR diversified Variance
Covariance is smaller than the calculation results
Undiversified Variance Covariance VaR portfolio,
for the entire time horizon. Thus these results have
proved that the risk of individual stocks can be
reduced or minimized by diversification through a
portfolio of stocks.
One method that can be used to calculate VaR using
historical data on return stock or stock portfolio is to
use the Historical Simulation models.
Ways must be taken in calculating the VaR by
Historical Simulation, first performed by sorting the
stock return data. Ordering starts from the value of
the biggest losses to the greatest number of
of data that is used as stock returns 731 time series
data (time series) with a 95% confidence level, so
that 5% of the data is 36.55 rounded up to 37. With
the return data sequence to 38 is used as a percentile
can be calculated VaR Historical Simulation.
The calculation of the maximum loss over the 6
stocks done by using return data similar to that used
in the calculation of Variance Covariance VaR.
Historical Simulation VaR calculation results of the
top ten stocks are presented in Table 3 below:
Table 3 Value at Risk - Historical model at 1 day, 5 days and 20 days
1 Hari 5 Hari 20 Hari
ADRO 44,297,864,000 0.041964 1,858,924,384.56 4,156,681,288.90 8,313,362,577.81
ASRI 61,854,352,000 0.041385 2,559,855,728.13 5,724,011,420.70 11,448,022,841.40
BBRI 177,452,800,000 0.041243 7,318,678,472.15 16,365,062,569.19 32,730,125,138.39
BMRI 130,894,700,000 0.040822 5,343,382,726.13 11,948,167,005.43 23,896,334,010.85
PTBA 13,710,000,000 0.040521 555,545,616.43 1,242,237,762.94 2,484,475,525.88
UNTR 45,948,005,000 0.040410 1,856,737,669.60 4,151,791,645.60 8,303,583,291.20
Total 474,157,721,000 0.246345 19,493,124,597.00 43,587,951,692.77 87,175,903,385.53
4.11% 9.19% 18.39%
Value at Risk
Saham Eksposure Percentile5%
In testing conducted on models backtesting Variance
Covariance and Historical Simulation models to
determine the validity of the magnitude of the
potential loss of the 6 stocks examined.The model
used is Kupiec Test using test data as much as 252
Data 1 last year that since December 25, 2013 until
December 30, 2014 Results of tests performed using
either a model of Variance Covariance and using
models Historical Simulation apparently showing the
two models is valid to measure potential losses a
maximum of 6 stocks on an individual basis as
presented in Table 4 below.
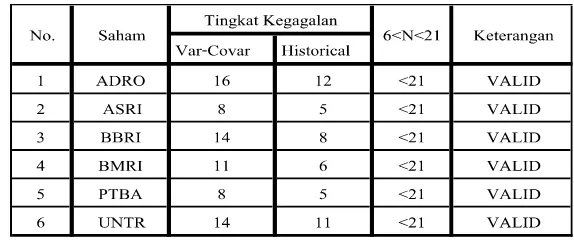
Table 4 The Result of Back Test from Variance Covariance and Historical VaR
Based on the results of testing the validity of the VaR
model at the top turns failure rate (failure) generated
by the model Variance-Covariance whole is greater
than the Historical Simulation for undiversified VaR
Discussion
Based on data in Table 1, it can be
concluded that with a 95% confidence level, the
maximum potential loss which occurred on December
30, 2014 at ADRO shares that have exposure value of
Rp 44.297.864.000 is Rp 1,691,432,964.42 for VaR 1
day, Rp 3,782,159,087.84 for the 5-day VaR and VaR
Rp 7,564,318,175.68 for 20 days.
In other words, only a 5% chance that
the losses will happen tomorrow because it has the
exposure value of Rp 44.297864 billion will exceed
USD 1,691,432,964.42 for 1-day VaR, VaR Rp
3,782,159,087.84 for 5 days, and for Rp
7,564,318,175.68 for 20 days VaR. The same
explanation applies to the five other stocks.
Once known VaR for each stock then
Undiversified VaR can be calculated by adding the
entire portfolio VaR value of each share. Of the
amount of Rp 474 157 721 000 portfolio, the
portfolio VaR for 1 day ahead of Rp
14,507,928,780.00 value of VAR for 5 days ahead of
Rp 32.44.714.973,75 and VaR for 20 days ahead of
Rp 64,881,429,947.49
Based on Table 2, it can be concluded
that the number of exposures Rp 474 157 721 000,
the investor will suffer a loss of Rp 4,271,178,870.42
for the 1-day VaR, Rp 9,550,646,298.32 for VAR 5
days and Rp 19,101,292,596.65 for a 20-day VaR
of Rp 4,271,178,870.42 for the 1-day VaR, Rp
9,550,646,298.32 for VAR 5 days and Rp
19,101,292,596.65 for 20 days VaR.
On Table 3 above, it can be concluded
that the value losses on ADRO shares with Rp
44.297864 billion exposure value is Rp
1,858,924,384.56 for the 1-day VaR, VaR Rp
4,156,681,288.90 for 5 days, and Rp
8,313,362,577.81 for 20 days VaR. The same
explanation applies to the five other stocks.
Of the amount of Rp 474 157 721 000
portfolio, the portfolio VaR for 1 day ahead of Rp
19,493,124,597.00 value of VAR for 5 days ahead of
Rp 43,587,951,692.77 and the VaR for 20 days ahead
of Rp 87,175,903,385.53
Conclusion
Based on the results of research that has
been done on LQ 45 related to market risk, it can be
concluded as follows:
1. Measurement risk market on investment
stock is good for individually or in portfolio Variance
Covariance models with turns produce values big be
compared with using the Historical models.
Differences especially happen on calculation for
undiversified VaR. While on diversified VaR
calculation shows that the compared resultcan be
smaller than undiversified VaR calculation. This
2. Result of examination to the validity of
a model based back test, shows that both model,
variance covariance models and historical models
turned out to be valid for be used as tool measure
potential loss maximum on investment stock.
Acknowledge
I would like to express my profound
gratitude to Dr Firman Pribadi, my supervisor, for his
immeasurable support and for his guidance through
the entire course of my study.
References
Arthini, Wayan, dkk. Perhitungan VaR Portofolio
Saham Menggunakan Data Historis dan
Data Simulasi Monte Carlo. e-Jurnal
Matematika Vol. 1 No. 1; 2012.
Best, Philip. Implementing Value at Risk. John Wiley
& Sons Ltd. England. 1998.
Jorion, Philippe. Value at Risk: New Benchmark for
Managing Financial Risk, 3rd Edition.
McGraw-Hill USA. 2007.
Katsenga, Gerald Z. Value at Risk (VaR) Backtesting
‘Evidence from a South African Market
Portfolio’. Dissertation Submitted the
Degree of Master of Management in
Finance and Investments. University of
Witwatersrand Business School. 2013.
Komariyah, Oom. Analisis Pengukuran Risiko Harga
Saham Syariah dengan Pendekatan Model
Variance Covariance dan Historical
Simulation. Jakarta: Universitas
IndonesiaMarkowitz, H. 1952. Portfolio
Selection. Journal of Finance. Vol.VII
No.1; 2005.
Nurharyanto. Analisis Risiko Pasar Portofolio
Investasi Saham Dengan Metode Value at
Risk (Studi Kasus pada Dana Pensiun
RST). Fakultas Ekonomi Program Studi
Magister Manajemen. Jakarta: Universitas
Indonesia. 2011.
Ross et al. Corporate Finance, 5th Edition.
McGraw-Hill Companies. 2003.
Tandelilin, Eduardus. Portfolio dan Investasi: Teori
dan Aplikasi. EdisiPertama. Yogyakarta:
Kanisius. 2010.
Wahyudi, Sugeng. Pengukuran Return Saham. Jurnal