DOI: 10.12928/TELKOMNIKA.v12i3.106 675
Performance of Chaos-Based Encryption Algorithm for
Digital Image
Suryadi MT, Eva Nurpeti, Dhian Widya
Department of Mathematics, Universitas Indonesia, Depok, 16424, Indonesia *Corresponding author, email: {yadi.mt, eva.nurpeti}@sci.ui.ac.id
Abstract
Presentation of information in digital form is highly vulnerable againts information abusing. Digital image is one of digital information which is frequently becomes a target of crime. Therefore, reliable, secure, and fast security techniques are required in digital image information. In this study, chaos-based encryption algorithm for digital image is built to improve endurance from brute force and known plaintext attack. The algorithm use logistic map as a random number generator for key stream. According to test
and analysis, this algorithm has key space of , key sensitivity up to , the key stream is proved
random, and the distribution of pixels value from encrypted image is proved uniform. So, it can be concluded that, the algorithm is very difficult to be cracked by brute force attack and also known plaintext attack.
Keywords: chaos, logistic map, encryption algorithm, digital image
1. Introduction
Performance of an algorithm can be seen from the algorithm endurance security against attacks and computation time. The traditional cipher like Data Encryption Standard (DES), International Data Encryption Algorithm (IDEA), Advanced Encryption Standard (AES), and Rivest-Shamir-Adleman Algorithm (RSA) require a large computational time and high computing power. However, the image encryption ciphers are preferable which take lesser amount of time and at the same time without compromising security [1],[2]
To provide a better solution for the security problem of digital image, a number of image encryption techniques have been proposed including the chaos -based image encryption. These techniques provide a good combination of speed, high security, complexity, and computational power, etc [3]-[6] Chaos-based encryption also been extensively studied by researchers because of its superior in safety and complexity[2],[3],[6]-[12].
Chaos is the type of behavior of a system or function that is random, sensitive to initial values, and ergodicity. Function that has chaos properties was called chaos function. Chaos function have been proved very suitable to design facilities for data protection [4],[5],[13]. With these properties, chaos function can be used as a random number generator. One of the simple function that shows the chaos properties is the logistic equation or commonly called the logistic map. Logistic map function is defined as a function : → , which is a function of one variable and is a fixed parameter. The value of variable in the interval , and in the interval , . Meanwhile, the presentation of logistic map function is in the form of iterative. It is :
(1)
where , , , . . .. and is the initial value of iteration [2],[3].
2. Encryption Algorithm
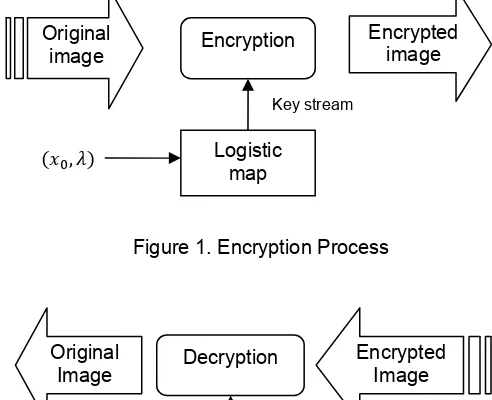
Encryption algorithm for digital image in this paper uses logistic map as a chaos function. The sequence of the process of securing the digital image can be seen in Figure 1 and process to regain access to the original digital image can be seen in Figure 2:
Figure 1. Encryption Process
Figure 2. Decryption Process
Figure 1 and Figure 2 shows the flow in securing digital images. Function key stream generator is the logistic map. The input of this algorithm are the original image and the key, the key is and λ. The output is an image that has been encrypted or image has been safe. To regain access to the original image, then we do the decryption process as shown in Figure 2. Input of the decryption process are the image that has been encrypted and the key. The key used in the decryption process is the same during the encryption process. The output is the original image. Encryption algorithm is described in the step 1 to step 5 [12]:
Step 1 : Insert the key , and original image with size
Step 2: Do 200 times iteration the logistic map equation (1) and we will get decimal fractions.
Step 3 : Check condition.
Step 3a : If yes, then do 3 times the logistic map iteration and we will obtain the results are decimal fractions , such as .
Step 3b : If not, so the encyption process is done for all part of image and we will obtain encrypted image.
Step 4 : Check whether the iteration is the last or not.
Step 4a : If yes, then do a real transformation to an integer, with procedures:
Select the first 15 number behind the decimal from decimal fraction that has been placed before ( for example ), that are the result of 3 iterations logistic map. Then divide 15 number to p integer with each integernya has 3 points. Then take as much
. , integer . Do operation mod 256 to each integer, so we get . , byte integer. 1 byte this integer number is called key stream .
Step 4a.1 : Take the pixel value information at each grayscale as much as . , . Each 1 byte information of the image is called P.
Step 4a.2 : Do step 5 . , times. Key stream
Decryption
Logistic
map ,
Original Image
Encrypted Image Original
image Encryption
Logistic map ,
Keystream
Step 4.b : If not, then do transformation from real to integer, like in the step 4a, but take by p integer. Then take p integer. Do operation mod 256 to each integer, so we get p bytes integer number or p KS.
Step 4b.1 : Take the pixel information at each pixel grayscale by p . Each 1 byte information of the image is called P.
Step 4b.2 : Do the step 5 by p times.
Step 5: Do bitwise XOR operation on each byte integer number with every byte image data. Otherwise, do: ⊕ . Back to Step 3.
3. Results and Analysis
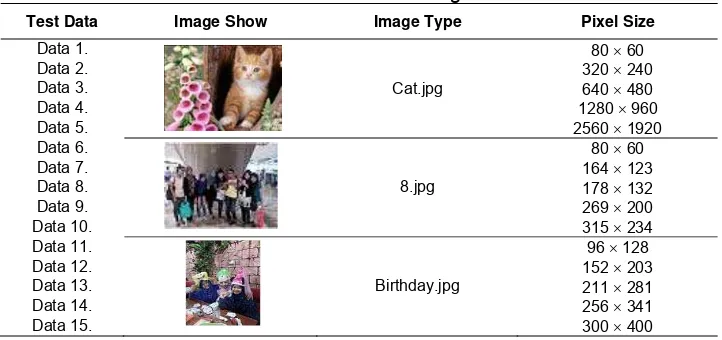
The test data used are cat.jpg digital image grayscale and color, with different sizes are presented in Table 1.
Table 1. Test Data Image
Test Data Image Show Image Type Pixel Size
Data 1.
Cat.jpg
80 60
Data 2. 320 240
Data 3. 640 480
Data 4. 1280 960
Data 5. 2560 1920
Data 6. 80 60
Data 7. 164 123
Data 8. 8.jpg 178 132
Data 9. 269 200
Data 10. 315 234
Data 11. 96 128
Data 12. 152 203
Data 13. Birthday.jpg 211 281
Data 14. 256 341
Data 15. 300 400
All test data in Table 1 will be used in the encryption process to be shown time encryption and decryption of the algorithm. Then it will be testing the durability of the chaos-based encryption algorithm. The first test is the test of resistance to brute force attacks with key sensitivity analysis and determination of the size of the key space. A second test is the test of resistance to known plaintext attack by randomness of key stream analysis and histogram analysis.
3.1 Encryption and Decryption Time Analysis
Figure 3. Encryption and Decryption Processing Time for cat.jpg using the proposed algorithm
Shown in Figure 3 that the time between the encryption and decryption process is not much different or relatively similar. For color images takes time encryption and decryption process is longer when compared to the grayscale image. That is because, the encryption process is done for each component of each grayscale red, green and blue, so it takes a longer process than just doing the encryption process on a grayscale image.
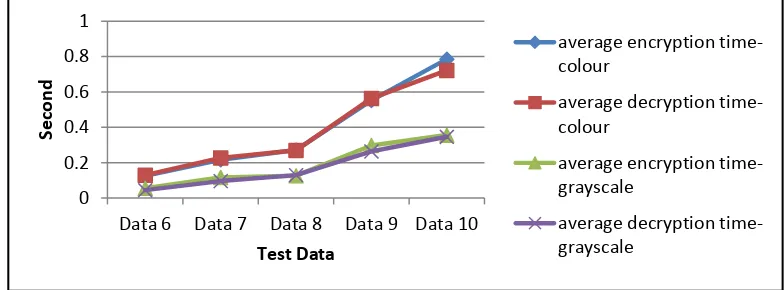
Time analysis from this proposed algorithm is better if compare with the algorithm by Gao. et. al [10]. Those were shown in Figure 4, Figure 5, Figure 6, and Figure 7. The test data which was used were Data 6 to Data 15 (Table 1).
Figure 4. Encryption and Decryption Processing Time for 8.jpg using the algorithm by Gao,et.al.
Figure 5. Encryption and Decryption Processing Time for 8.jpg using the proposed algorithm 0
average encryption time‐ colour
average decryption time‐ colour
average encryption time‐ grayscale
average decryption time‐ grayscale
average encryption time‐ colour
average decryption time‐ colour
average encryption time‐ grayscale
average decryption time‐ grayscale
average encryption time‐ colour
average decryption time‐ colour
average encryption time‐ grayscale
Figure 6. Encryption and Decryption Processing Time for birthday.jpg using the algorithm by Gao, et. al.
Figure 7. Encryption and Decryption Processing Time for birthday.jpg using the proposed algorithm
Based on the Figure 4 to Figure 7, it is shown that the encryption and decryption processing time on Figure 5 and Figure 7 is better then encryption and decryption processing time on Figure 4 and Figure 6. In terms of encryption and decryption processing time, the algorithm in this proposed algorithm is better than algorithm that was used by Gao H, et. al.[10].
3.2 Key Sensitivity Analysis
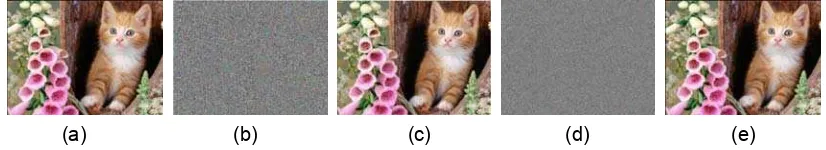
The value of the key that is used is always same for each digital image test data in this paper. While the decryption process will be tested with various different key value. The results are presented in Figure 8.
(a) (b) (c) (d) (e)
Figure 8. The Results of Cat.jpg. (a) Plain image; (b) Cipher image of (a); (c) Decrypted image; (d) Decrypted image with Difference x ; (e) Decrypted image with Difference x
0 1 2 3 4 5 6 7
Data 11 Data 12 Data 13 Data 14 Data 15
Second
Test Data
average encryption time‐ colour
average decryption time‐ colour
average encryption time‐ grayscale
average decryption time‐ grayscale
0 0.2 0.4 0.6 0.8 1 1.2 1.4
Data 11 Data 12 Data 13 Data 14 Data 15
Second
Test Data
average encryption time‐ colour
average decryption time‐ colour
average encryption time‐ grayscale
In Figure 8b and Figure 8c are shown the results of the encryption and decryption process simulation using cat image with the same key that is . , .Thus seen that the decryption process succeeded in opening the original data (Figure 8a).
In Figure 8d are shown that the attempt to decrypt using a key difference between the value by did not succed to get the original image. This is due to one of the properties of the logistic map is sensitive to initial values. Value of 0.1 and 0.1000000000000001 still considered different values by this algorithm. But in Figure 8e, when the difference reaches the decryption proccess got the information of original image. It shows that the numbers 0.1 and 0.10000000000000001 is considered to be the same number that is 0.1. Previously, have been tested using the different decryption key for grayscale and color images ranging from
to . So we get the sensitivity of this algorithm is up to .
So we obtain that a brute force attack would be very difficult to get the original image information, because these algorithms are very sensitive to changes in the value of the key. Histogram display for each column in a row is just the components Red (R) that shows the distribution of pixel values (Figure 9).
(a) (b) (c)
Figure 9. Histogram of Cat.jpg. (a) Histogram of Figure 8a; (b) Histogram of Figure 8b; (c) Histogram of Figure 8c
3.3 Size of Key Space
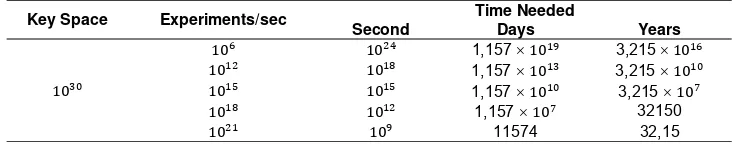
The random number generator which was used to generate key stream is logistic map. Keys that are used on logistic map are and , where and are real number. If we use a higher level of precision, for example 64-bit double precision IEEE standard, the precision level will reach . So, the total of key space are . Time required to exhaustive key search [14] can be seen in Table 2.
Table 2. Time Required to Exhaustive Key Search
Key Space Experiments/sec Time Needed
Second Days Years
It can be concluded that, the algorithm is very difficult to be cracked by brute force attack.
3.4 Randomness Key Stream Analysis
Test of randomness performed using international standard testing of the National Institute of Standards and Technology is monobits frequency test [15]. With the initial value . dan testing has been carried out on the key streams generated by the
based encryption algorithm. Key stream test in the key stream generated by the logistic map are: , , , … . , , , , , so the length of the binary sequence is 1320 bits.
The testing procedure is [14]: 1.
5. It can be concluded with the significance level of 1 % proven true that the sequence is
random because . .
Obtained from the randomness analysis of the key stream which generated by this algorithm is completely random. So that, the algorithm is very difficult to be cracked by known plaintext attack that utilizes the statistical properties of the ciphertext.
3.5 Histogram Analysis
The keys that we used is . and , performed testing using Goodness of fit test [16] on digital image of the encryption proccesss results with various sizes. The results of test statistic values towards grayscale test data digital image cat.jpg with Goodness of fit method are shown in Table 3.
Table 3. Test Statistic Values for Grayscale Image
Test Data Pixel Size Test Statistic Value
Data 1. 80 x 60 287.5733333333 Data 2. 320 x 240 255.6800000000 Data 3. 640 x 480 292.2483333333 Data 4. 1280 x 960 265.2695833333 Data 5. 2560 x 1920 260.4456250000
While the test results for the test data of cat.jpg color digital image in various sizes are shown in Table 4.
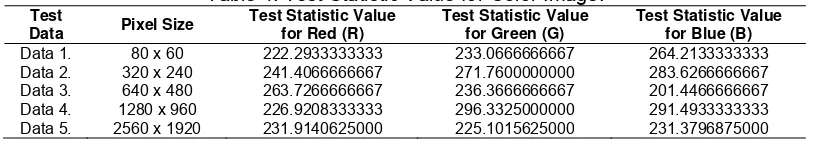
Table 4. Test Statistic Value for Color Image.
Test
Data 1. 80 x 60 222.2933333333 233.0666666667 264.2133333333 Data 2. 320 x 240 241.4066666667 271.7600000000 283.6266666667 Data 3. 640 x 480 263.7266666667 236.3666666667 201.4466666667 Data 4. 1280 x 960 226.9208333333 296.3325000000 291.4933333333 Data 5. 2560 x 1920 231.9140625000 225.1015625000 231.3796875000
With degrees of freedom 256-1=255, and 1% significance level, the critical value is 310.4573882199. It was seen from the results of the experiment are shown in Table 3 and Table 4, all the test statistic values less than the critical value. It can be concluded that all the tested data proved uniformly distributed. As seen in Figure 9b for component R, histogram diagram from the results of encrypted image is flat, which shows the distribution of encrypted image pixel value, is uniform.
Based on the test results, the distribution encrypted image pixel value, using this algorithm, is uniform. So this ciphertext is very difficult to be cracked by known plaintext attack that utilizes the statistical properties of the ciphertext.
4. Conclusion
Conclusion of this paper are :
a. Performance of chaos-based encryption algorithm are:
(i). The time of encryption and decryption processes are relatively similar to each grayscale and color image.
because on the color image , the process of encryption and decryption were done for each component grayscale, they are red, green, and blue.
(iii). Encryption algorithm has key space for and key sensitivity that reaches , so the algorithm is very difficult to be cracked by brute force attack.
(iv). This encryption algorithm is very difficult to be cracked by known plaintext attack, due to the value distribution of the pixels of the encrypted result is proved uniform (all test statistic value less than the critical value) and key streams that were generated, proved to be completely random with Pvalue = 0.74118 > 0.01.
b. So, it can be concluded that, the algorithm is very difficult to be cracked by brute force attack and also known plaintext attack.
Acknowledgments
This work was supported by the Directorate of Research and Community Engagement Universitas indonesia (Initial Research Grant PUPT UI, No. 3355/H2.R12/HKP.05.00/2014).
References
[1] Stallings W. Computer and Network Security: Principle and Practice (5th ed.). New York: Prentice hall. 2011.
[2] Pareek NK, Patidar V, Sud KK. Image encryption using chaotic logistic map. Journal of Image and
Vision Computing. 2006; 24: 926-934.
[3] Patidar V, Pareek NK, Sud KK. A new subtitution-diffusion based image cipher using chaotic standard and logistic maps. Journal of Commun Nonlinear Sci Numer Simulat. 2009; 14: 3056-3075. [4] Devaney RL. An introduction to chaotic dynamical systems (2nd ed.). New York: Addison-Wesley
Publishing company, Inc. 1989.
[5] Hirsch MW, Smale S, Devaney RL. Differential equations, dynamical systems, and an introduction to
chaos (2nd ed.). Elsevier Academic Press. 2004.
[6] Zhang W, Wong K, Yu H, Zhu Z. An image encryption scheme using reverse 2-dimensional chaotic map and dependent diffusion. Journal of Commun Nonlinear Sci Numer Simulat. 2013; 18: 2066-2080.
[7] Suryadi MT. New Chaotic Algorithm for Video Encryption. 4th The International Symposium on Chaos Revolution in Science, Technology and Society 2013, Jakarta, August 28-29. 2013.
[8] Zhang Y. Plaintext Related Image Encryption Scheme Using Chaotic Map. TELKOMNIKA
Indonesian Journal of Electrical Engineering. 2014; 12(1): 635-643.
[9] Zhang Y, Xia JL, Cai P, Chen B. Plaintext related two-level secret key image encryption scheme.
TELKOMNIKA Indonesian Journal of Electrical Engineering. 2012; 10(6): 1254-1262.
[10] Gao H, Zhang Y, Liang S, Li D. A new chaotic algorithm for image encryption. Journal of Chaos,
Solutons and Fractals. 2006; 29: 393-399.
[11] Abu Zaid, Osama M, El-Fishawy, Nawal A, Nigm EM. Cryptosystem Algorithm Based on Chaotic System for Encrypting Colored Image. International Journal of Computer Science Issues. 2013; 10(4): 215-224.
[12] Eva N, Suryadi MT. Chaos-Based Encryption Algorithm for Digital Image. The 2nd IndoMS International Conference on Mathematics and Its Applications, Yogyakarta, November 6-7. 2013. [13] Kocarev L, Lian S. Chaos-based cyrptography. Berlin Heidelberg: Springer-Verlag. 2011. [14] Stallings W. Data and Computer Communications (8th ed.). Prentice Hall. New Jersey. 2007.
[15] National Institute of Standard and Technology (NIST). A statistical test suite for random and
pseudorandom number generators for cryptographic applications (Special Publication 800-222). U.S.
Department of Commerce. 2010.
[16] Walpole RE, Myers, RH, Myers SL, Ye, K. Probability and Statistics for Engineers and Scientists