MIIC EMA 12th Unive rsity o f Be ng kulu 1297 | P a g e
IDENTIFICATION OF EARNINGS MANAGEMENT ON THE
COMPANY LISTED ON THE INDEX LQ 45 IN INDONESIA
STOCK EXCHANGE
Noer Sasongko dan Emi Fauziah
Economics Faculty, Magister Management Program Muhammadiyah University of Surakarta
Jl A Yani tromol pos 1 Pabelan Surakarta, Central Java, Indonesia
Abstract
Earnings management is a management action to maximize or minimize the portion of accruals in earnings. Management often perform earnings management for several reasons: first, because the use of the accrual basis of accounting. This is an opportunity for management to select accounting methods (Scott, 2006); Second, because of the asymmetry of information. In this case, management has greater information than the principal (Morris, 1987); Third, as regards the company as a nexus of contracts. It is based on the theory of agency that is the difference of interests between agents and principals. The action is related to earnings management bonus plans, debt covenants and political costs (Watts and Zimmerman, 1990). In this case, management has 2 related behavior of earnings management is opportunistic behavior and efficient behavior contract. The purpose of this study was to identify the trend of earnings management in companies incorporated in the BEI LQ45, and magnitude of earnings management by the management. The samples were incorporated in the LQ 45 from year 2004 to 2010 with a total
samples 187 firm years. The results showed that the average value of EM 2004 = 4.01, EM
2005 = 0.15, EM 2006 = -0.24, EM 2007 = 0.54, EM 2008 = 0.87, EM 2009 = - 0.51, EM 2010 = -2.52, and the total average EM = 0.89, these results showed no significant average EM conducted by management. The results also indicate the trend of EM that do not give the same direction from year to year. However, the average total EM
has positive value. This finding supports previous research done by Cahan (1992),
DeFond and Jiambalvo (1994), Sweeney (1994); Kusumawati and Sasongko (2005), and Dechow et. al. (2010), which provides empirical evidence regarding the identification of trends of earnings management in the form of maximizing or minimizing the reported earnings. Earnings management perspective used in this study do not lead to opportunistic perspective or not. However, this study illustrates the tendency of earnings management performed.
MIIC EMA 12th Unive rsity o f Be ng kulu 1298 | P a g e Introduction
Financial statements are prepared based on the accrual basis of accounting (accruals accounting). Accrual accounting has the advantage that corporate earnings information and measurement components generally provides a better indication of the economic performance of companies in the information generated from the aspects of current cash receipts and disbursements (FASB 1978). Accrual accounting also has drawbacks. Wild et al. (2003) criticized the rule that accrual accounting is imperfect and obscure financial report which aims to provide cash flow information and company capability to generate cash. The blurring is due to accrual accounting information is complicated and vulnerable to manipulation that led to earnings management measures.
The term earnings management began to attract the attention of researchers, especially researchers accounting, because it is often associated with the behavior of the manager or the makers of financial statements (preparers of financial statements). At first glance, it appears that earnings management is closely linked to the level of profits (earnings) or achievements of the business of an organization. It is not strange because the level of profit earned is often associated with the achievement of management in addition it is a common that the size of the bonus to be received by the manager depending on the size of the profits. Therefore it is not surprising that managers often try to highlight his accomplishments through profit or profit level achieved.
Earnings management as an intervention with the specific purpose of external financial reporting process with the purpose to obtain some private gain (Schipper, 1989). Earnings management as an act of a manager by presenting a report that raise (lower) profit for the period of the business unit that became his responsibility, without causing an increase (decrease) the economic profitability of such units in the long term (Fischer and Rosenzweig, 1995). Earnings management occurs when managers use considerations (judgment) in financial reporting and the preparation of transactions to alter financial reports, in order to manipulate the size (magnitude) of income to some stakeholders about the economic performance of the company or to influence the outcome of the agreement (contract) which depends on the numbers reported accounting numbers (Healy and Wahlen, 1999).
Earnings management action has led to several cases of reporting accounting scandals that are widely known, among others, Enron, Merck, World Com and the majority of other companies in the United States (Cornett, Marcuss, Saunders and Tehranian, 2006). Some cases that occurred in Indonesia, such as PT. Lippo Tbk and PT. Kimia Farma Tbk also involve financial reporting (financial reporting) which originated from the detected manipulation (Gideon, 2005).
MIIC EMA 12th Unive rsity o f Be ng kulu 1299 | P a g e makers and users of financial statements and also because accounting earnings are widely believed to be the main information available in an organization's financial statements (Lev, 1989; Schipper, 1989; Gujarathi and Hoskin, 1992). The result is not surprising that many managers who set the gain depends on the underlying motivation.
Earnings management actions occur in a variety of companies, both in the trade sector, manufacturing and service industry sectors. The practice of earnings management can be viewed from two different perspectives, namely as a wrong action (negative) and management actions that should be (positive). Healy and Wahlen (1998) consider earnings management as an act of misleading and deceiving shareholders.
Copeland (1968:10) defines earnings management as, "some ability to Decrease or increase of net income reported at will". This means that earnings management includes management efforts to maximize, or minimize income, including income smoothing in accordance with the wishes of management. To detect the presence or absence manajamen profit, then the measurement of accruals is a very important thing to note. The total accrual is the difference between profit and cash flow from operating activities. Total accruals can be divided into two parts, namely: (1) the accruals that are naturally present in the process of preparing financial statements, called the normal accruals and non discretionary accruals, and (2) the accrual which is the manipulation of accounting data is called abnormal accruals or discretionary accruals.
According to Healy and Palepu (1993), there are three conditions that cause communication over financial reporting is not perfect and not transparent, namely: (1) compared with the investors, managers have more information about the strategy and business operations are managed, (2) the interests of managers are not always aligned with the interests of investors, and (3) the imperfection of accounting and auditing rules. In the preparation of financial statements, accrual basis was chosen because it is more rational and fair in reflecting the company's financial condition in real terms, but on the other hand use the accrual basis can give freedom to the management in choosing the method of accounting for not deviate from the rules of the Financial Accounting Standards applicable. This study of possible indications of earnings management in the conventional index one on the LQ-45 index. LQ45 is an index which contains the companies that their shares have high levels of liquidity and high market capitalization.
This research problem is: how is the practice of earnings management that occurred in the company went public joined in the LQ-45 (conventional index)? And whether the company will likely take action to raise or lower the rate of profit? While the purpose of this study, namely: identify the magnitude of earnings management that occurred in the company went public into the LQ-45 (conventional index), and identify whether the management tends to raise or lower the rate of profit.
Literature Review
MIIC EMA 12th Unive rsity o f Be ng kulu 1300 | P a g e information about the agent's performance. While not all circumstances are known by all parties and as a result, when certain consequences not considered by the parties, this has resulted in an imbalance of information possessed by the principal and agent. The imbalance of information is called asymmetric information.
The imbalance of information or information asymmetries and conflicts of interest between principal and agent encourages agents to present information that is not true to the principals, especially if the information relates to performance measurement agent. This may be influenced by moral hazard (moral chaos) (Hendriksen and Van Breda, 2002). Information asymmetry between management with the owner (principal) can provide an opportunity for managers to make management earnings in order to mislead the owner of the company's economic performance (Ujiyantho and Scout, 2007).
The cause of earnings management will be explained using the theory of agency. As an agent, manager morally responsible for optimizing the benefits of the owner (principal) to obtain compensation in accordance with the contract. Thus there are two distinct interest in the company where each party seeks to achieve or maintain the desired level of prosperity (Ali, 2002)
Scott (2006) defines earnings management as follows "Given That managers can choose from a set of accounting policies (for example, GAAP), it is expected hat the Urals to That They Will choose policies so as to maximize Their own utulity and / on the market valve of the firm." From the above definition, then the earnings management is an accounting policy choice by the manager of accounting standards that exist naturally and can maximize their utility or value of the enterprise market.
Schipper (1989) defines earnings management as an intervention with the specific purpose of external financial reporting process deliberately to gain some personal advantage. Fischer and Rosenzweig (1995) defines earnings management as an act of a manager by presenting a report that raise (lower) profit for the period of the business unit that became his responsibility, without causing an increase (decrease) the economic profitability of such units in the long run. Meanwhile, according to Healy and Wahlen (1999), earnings management occurs when managers use considerations (judgment) in financial reporting and the preparation of transactions to alter financial reports, in order to manipulate the size (magnitude) of income to some stakeholders about the economic performance of the company or to influence the outcome agreement (contract) which depends on the accounting figures reported.
Healy and Wahlen (1999), states that the definition of earnings management contains several aspects. The first intervention income management over financial reporting can be done with the use of judgment, for example judgment needed in estimating the number of economic events in the future to shown in the financial statements, such as the estimated economic life and residual value of fixed assets, the responsibility for pensions, deferred taxes, losses receivables and a decrease in asset values. Besides, the manager has the option of accounting methods, such as the depreciation method and cost method. Secondly, the purpose of earnings management to mislead stakeholders about the economic performance of companies. This occurs when management has access to information not accessible by outsiders.
MIIC EMA 12th Unive rsity o f Be ng kulu 1301 | P a g e statements and can interfere with the trust the users of financial statements of profit rate was engineered as a number of profit without engineering (Setiawati and Na'im, 2000).
Earnings management techniques and patterns according to Setiawati and Na'im (2000) can be done by three techniques namely:
a) Make use of opportunities to make accounting estimates.
How to affect earnings management through the judgment (approximate) of accounting estimates include the estimated level of bad debts, estimation fixed asset depreciation period or amortization of intangible assets, estimated warranty costs, and others.
b) Change of accounting method
Changes accounting method used to record a transaction, for example: change the method depreciation the fixed assets, rate of depreciation methods year straight line depreciation. c) Shifting the period of cost or revenue
Examples of engineering fees or earnings period include: accelerate / defer spending on research and development until the next accounting period, speed / delay until the next period of campaign spending, accelerate / delay product delivery to customers, set the time of the sale of fixed assets which are not used.
The pattern of earnings management performed by management can be done by four ways: Scott (2000)
a) Taking a Bath
This pattern occurs at the time of the reorganization including the appointment of new CEO by reporting a loss in large numbers. This action is expected to increase earnings in the future.
b) Income minimization
Done when the company experienced a high level of profitability so that if earnings in the coming period is expected to fall drastically can be overcome by taking profit of the previous period.
c) Income maximization.
Performed as income decreases. Action on income maximization aims to report higher net income for the purpose of a larger bonus. This pattern is done by companies that conduct debt covenant violations.
d) Income smoothing
Framework
FS
Ma na g e me
O p p o rtunistic Be ha vio r
Firm Va lue
Earnings Management
Inc re a sing Ea rning s
Decreasing Earnings
Shifting income from future periods to the current period
Shifting income from current period to the nextperiod
Mo tiva tio n - Bo nus p la n
hyp - De b t
Ha ve g o o l
SAK
There are several accounting policies (Principle Accrual)
The financial statements refer to SAK. Inside there are several policy Accounting GAAP (accrual principle). Management chose the method of accounting in order to achieve company goals. Management companies do earnings management by increasing or decreasing earnings. If the increase means the company's earnings shifting income future period to current period and if the company decreasing earnings means income current
period. shifting to the next period.
Research Methods
This research is explanatory research to determine the magnitude of earnings management performed publicly traded companies in Indonesia. As for who becomes the object of research is the company go public or be listed on the Indonesia Stock Exchange in category of the LQ-45 during the period 2004-2010. The sample in this study were non-random purposive sampling to filter out as much information might have been looking from a variety of sources. LQ 45 Index, using 45 stocks are selected based on the liquidity of stock trading and adjusted every six months (the beginning of each February and August). Thus the shares contained in the index will always be changing.
To detect the presence of earnings management practices and see how the behavior of management (whether likely to manipulate earnings by increasing or decreasing the rate
MIIC EMA 12th Unive rsity o f Be ng kulu 1303 | P a g e of profit), then the techniques used in the analysis of the discretionary accruals (DACC) and calculated using the Modified Jones Model
Step-by-step analysis as follows: TACCit = EBXTit – OCFit
TACCit/TAi,t-1 = α1 (1/TAi,t-1) + α2 (∆REVit - ∆RECit)/TAi,t-1) + α 3 (PPEi t/TAi,t-1).
From the regression equation above, NDACC (non discretionary) can be calculated by re-enter the coefficients alpha (α) is as follows:
NDACCit = α1(1/TAi,t-1)+ α2(∆ REVi t - ∆ RECit)/TAi,t-1) + α3 (PPEit/TAi,t-1)
Description:
TACCit : Total accruals company i in t period
EXBTit : Earnings Before Extraordinary Item company i in t
period
OCFit : Operating Cash Flows company i in t period
NDACC it : Non discretionary accruals company in t period
TAi,t-1 : Total assets company i in t-1 period
∆REVit : Revenue exchange company i in t period
∆RECit : Receivable exchange company i in t period
PPEit : Fixed assets (gross) company i in t period
Furthermore, the value of discretionary accruals can be calculated as follows: DACCit = ( TACCit/TAi,t-1 ) - NDACCit
Description:
DACCit : Discretionary accruals company i in t period
TACCit : : Total accruals company i in t period
TAi,t-1 : Total assets company i in t-1
NDACCit : Non discretionary accruals company i in t period
Furthermore, the value NDACC further analyzed to determine the practice of earnings management in companies incorporated in the LQ45 during the period 2004 to 2010.
Data Analysis And Discussion 1. Samples
Based on the sampling criteria that have been outlined earlier, then a detailed study of samples obtained as follows:
Table 1 The research sample
Conventional companies (LQ-45)
companies listed in LQ-45 during 2004-2007 period companies have data incompletely
LQ 45 sample
220 (33) 187
MIIC EMA 12th Unive rsity o f Be ng kulu 1304 | P a g e From the data tabel.1 above we can see that the companies listed in going public LQ-45 from the year 2004-2010 is 220 firms, but there are 33 companies that are not complete in a financial report, so the company can be used in sampling was 187 firms. Of the 187 companies can be viewed on tabel.2 below is the number of companies that can be used in the sampling of the years 2004-2010.
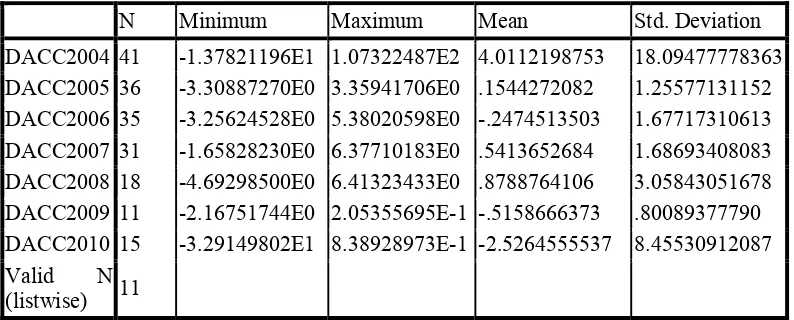
2. Data Analysis Descriptive statistics to explain or describe each of the variables involved in this study. Descriptive statistics as described in the table below.
Table 2. Descriptive Statistics
N Minimum Maximum Mean Std. Deviation
DACC2004 41 -1.37821196E1 1.07322487E2 4.0112198753 18.09477778363 DACC2005 36 -3.30887270E0 3.35941706E0 .1544272082 1.25577131152 DACC2006 35 -3.25624528E0 5.38020598E0 -.2474513503 1.67717310613 DACC2007 31 -1.65828230E0 6.37710183E0 .5413652684 1.68693408083 DACC2008 18 -4.69298500E0 6.41323433E0 .8788764106 3.05843051678 DACC2009 11 -2.16751744E0 2.05355695E-1 -.5158666373 .80089377790 DACC2010 15 -3.29149802E1 8.38928973E-1 -2.5264555537 8.45530912087 Valid N
(listwise) 11
Sources: Secondary data are processed
The results showed that the average value of DACC or EM 2004 = 4.01, EM 2005 = 0.15, EM 2006 = 0.24, EM 2007 = 0.54, EM 2008 = 0.87, EM 2009 = 0.51, EM 2010 = -2.52, and the total average EM = 0.89, these results showed no significant average EM conducted by management. The results also indicate the trend of EM that do not give the same direction from year to year. However, the average total EM has positive value.
This finding supports previous research done by Cahan (1992), DeFond and Jiambalvo (1994), Sweeney (1994); Kusumawati and Sasongko (2005), and Dechow et. al. (2010), which provides empirical evidence regarding the identification of trends of earnings management in the form of maximizing or minimizing the reported earnings. Earnings management perspective used in this study do not lead to opportunistic perspective or not. However, this study illustrates the tendency of earnings management performed.
Conclusion
Based on the results of data analysis and discussions noted above, it can be concluded that:
1. Within the period 2004 to 2010, the companies listing on LQ-45 index as many as 187 companies to follow the pattern of increasing earnings figures. Average value of accruals (DACC) of 0.8942210
2. The analysis showed that in 2004 the value of EM 2004 = 4.01, EM 2005 = 0.15, EM 2006 = -0.24, EM 2007 = 0.54, EM 2008 = 0.87, EM 2009 = - 0.51, EM 2010 = -2.52, and the total average EM = 0.89.
MIIC EMA 12th Unive rsity o f Be ng kulu 1305 | P a g e This paper is part of Hibah Pasca-I research that is funded by DP2M, Dirjen Dikti, Kementerian Pendidikan Nasional Republik Indonesia, DIPA Nomor : 0541/023-04.1.01/00/2011
References
Ali Irfan (2002). Pelaporan Keuangan dan Asimetri Informasi dalam Hubungan Agensi. Lintasan Ekonomi Vol. XIX. No.2. Juli 2002.
Alijoyo, F. Antonius. 2002. Komite Audit yang Efektif: Belajar dari Kasus Enron. http:/www.fcgi.or.id.
Deni Darmawati, Khomsiyah dan Rika Gelar Rahayu. (2004). Hubungan Corporate Governance dan Kinerja Perusahaan. Simposium Nasional Akuntansi VII, IAI, 2004.
Dezoort, F. Todd, et al. 2002. Audit Committee Effectiveness: A Synthesis of the Empirical Audit Committee Literature. Journal of Accounting Literature. Gainesville. Vol.21, hlm.38-75.
Jensen, M.C., 1993. The Modern Industrial Revolution, Exit, and The Failure of Internal Control Systems. The Journal of Finance Vol. 48, No3, 831-880.
Gideon SB Boediono. (2005). Kualitas Laba: Studi Pengaruh Mekanisme Corporate
Governace dan Dampak Manajemen Laba dengan Menggunakan Analisis Jalur. Simposium Nasional Akuntansi VIII, IAI, 2005.
Gujarathi, M.R. and Hoskin, R.E. (December 1992). “Evidence of Earnings Managementby The Early Adopters of SFAS 96”. Accounting Horizon, page: 18-31. Jurnal Akuntansi & Keuangan Vol. 2, No. 2, Nopember 2000: 104 – 115
Healy,P.M., dan J.M. Wahlen. “A Review of the Earnings Management Literature and Its Implications for Standard Setting,” Accounting Horizon (1999), 13: 365-383.
Healy P.M and K.G Palepu. 1993. “The Effect of Firms’ Financial Disclosure Strategieson Stock Prices”, Accounting Horizons, Vol 7 No.1, March 1993:1-11 ,American Accounting Association
Ujiyantho,MuhArief,2007 Mekanisme Corporate Governance, Manajemen Laba Dan Kinerja Keuangan, jurnal Studi Pada Perusahaan go publik Sektor Manufaktur
Midiastuty, Pratana P., dan Mas’ud Machfoedz. 2003. Analisis Hubungan Mekanisme Corporate Governancedan Indikasi Manajemen Laba. Artikel yang Dipresentasikan pada Simposium Nasional Akuntansi 6 Surabaya tanggal 16-17 Oktober 2003
Michaelson, S.E., J.J. Wagner, dan C.W. Wotton. 2000. “The Relationship beetwen the Smoothing of reported Income and Risk-Adjusted Returns”. Journal of Economics and Finance. Volume.2, No.2. Summer, pp. 141—159.
Setiawati, Lilis, dan Ainun Na’im. “Manajemen Laba,” Jurnal Ekonomi dan Bisnis Indonesia, (2000),hal.424-441.
MIIC EMA 12th Unive rsity o f Be ng kulu 1306 | P a g e Schipper, Katherine. (1989). Comentary Katherine on Earnings Management. Accounting Horizon
Shleifer, A. dan R.W. Vishny. (1997). A Survey of Corporate Governance. Journal of Finance, Vol.52. No.2. Juni, hal.737-783.
Short, Helen dkk., 1999, Corporate Governance: From Accountability to Enterprise, Accounting and Business Research, Vol. 29, No. 4, Hal. 337-352.
Scott, R. William. 2000. Financial Accounting Theory 2
nd
Edition. Prentice-Hall, New Jersey
Trueman, B. and S. Titman. 1988. "An Explanation for Accounting Income Smoothing". Journal of Accounting Resserach 26 (Supplement), pp. 127—139.
Wild, J.J, K.R. Subramanyam, and R.F. Halsey (2003). Financial Statement Analysis. Eight Edition. Singapore: McGraw-Hill.
Wilopo. 2004. The Analysis of Relationship of Independent Board of Directors, Audit Committee, Corporate Performance, and Discretionary Accruals. Ventura Volume 7 No. 1 April: 73-83
Wedari, L.K. 2004. Analisis Pengaruh Dewan Komisaris dan Keberadaan Komite Audit terhadap Aktivitas Manajemen Laba. Makalah pada Simposium Nasional Akuntansi VII. Denpasar.
Watts, R, L., and Zimmerman, J, L. (1986). Positive Accounting Theory. New York, Prentice Hall. Dikutip dari Jurnal Akuntansi & Keuangan Vol. 2, No. 2, Nopember 2000: 104 -115.