The Effect of Tax Planning and Deferred Tax Expense on Earnings
Management on Manufacturing Companies Listed In The Indonesia Stock
Exchange
Noviana Mulyania, Kartika Hendra Titisaria, Riana Rachmawati Dewib a
Universitas Islam Batik Surakarta, Jl. KH Agus Salim No. 10, Surakarta, Indonesia b
Universitas Islam Batik Surakarta, Jl. KH Agus Salim No. 10, Surakarta, Indonesia
Corresponding e-mail: [email protected]
Abstract : This study aims to examine the effect of tax planning and deferred tax expense on earnings management practices. Population in the study were all manufacturing companies listed on the Indonesia Stock Exchange. Sampling method used is purposive sampling method by using the criterion of research sample data, so that obtained sample of 84 annually report of manufacturing company during period of year 2014 – 2016. Data analysis method using descriptive statistical test, classical assumption test and multiple linear regression. The results of the study provide empirical evidence that earnings management is not influenced by tax planning and earnings management are affected negatively and significantly by deferred tax expense. Meanwhile, simultaneously proves that tax planning and deferred tax expense have significant effect to earnings management variable. Based on the coefficient of determination proves that 11,5% variable earnings management can be explained by variable tax planning and deferred tax expense. While 88,5% other variables which are not used in this research influence earnings management variable.
Keywords: TaxjPlanning, DeferrediTaxlExpense, EarningsuManagement
1. INTRODUCTION
Current technological advances,
corporate finance is expected to be well managed, and capable of producing
goods of the highest quality.
Competitive advantage must also be owned by a company especially for manufacturing industry in Indonesia to be able to exist in global market. From this condition approach the agency theory used corporate management in responsible and manage finance.
According to Negara (2017) the agency theory approach is a theory that explains that the conflict of interest
between the parties concerned
(principal) with management as the party of interest (agent) affect the practice of earnings management.
The company’s management tends to minimize tax payments in order to save the tax burden becomes small. Suandy (2003) reveals that the effort to minimize the tax expense in euphemism is often referred to as tax planning or tax sheltering (Negara, 2017).
Research on earnings management has been widely reviewed by several researchers with variables that vary so as to provide diverse empirical evidence. Research conducted Astutik (2016) and Ulfah (2013) show that earnings management is influenced by tax planning. While research Ifada (2015) finds empirical evidence that earnings
management practices are not
deferred tax expense. Other empirical research Harnovinsah (2015), Amanda (2015) and Aulia (2014) proves that earnings management is not affected by deferred tax expense.
Various background descriptions and previous research results provide
empirical evidence that is still
contradictory about the relationship, the authors restest by plucking the title of research “The Effect Of Tax Planning And Deferred Tax Expense On Earnings
Management On Manufacturing
Companies Listed In The Indonesia Stock Exchange”.
2. RESEARCH METHODS
This type of quantitative research is used in this study. The purposive sampling method was used in this study for sampling. Based on sampling criteria there are as many of 84 annually report manufacturing companies during the period 3 years (2014 –2016) published in www.idx.co.id.
3. DATA ANALYSIS METHOD
3.1 Descriptive Statistical Test
Descriptive statistics are to describe or give an idea of the object under study through the sample data or population as is, without doing the analysis and make conclusion that apply to the public (Sugiyono, 2010).
3.2 Classical Assumption Test
3.2.1 Normality Test
Normality test used to test each data of research variables in the regression model has a normal distribution. This study was
conducted by
Kolmogorov-Smirnov Test used to test the interval and ratio data. Data of
normal distributed variable, if
significance value > 0,05
(Samrotun, 2015).
3.2.2 Multicollinearity Test
This test is used to see if there
are symptoms of
multicollinearity in the
regression model.
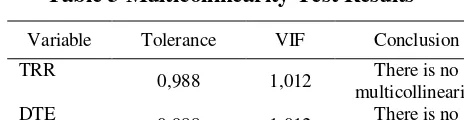
Multicollinearity test can be seen from the tolerance and VIF values. The regression model does not occur multicollinearity, if the VIF value < 10 and tolerance value > 0,1.
3.2.3 Autocorrelation Test
Regression models must be met
in the absence of
autocorrelation. The test
method is carried out by the Durbin-Watson Test (DW test). The accepted 0 hypothesis
means that there is no
autocorrelation, if the
Durbin-Watson (DW) value lies
between Upper Bound (dU) and 4-dU (Samrotun, 2015).
3.2.4 Heteroscedasticity Test
A good regression model that
does not occur
heteroscedasticity or
homocedasticity. In this study glejser test is used to measure heteroscedasticity test. Research variable is said there is no
heteroscedasticity, if have
significance value > 0,05.
3.3 Hypothesis Test
3.3.1 Multiple Linear
Regression Analysis
dependent variable that is earnings management. Multiple
linear regression model is
formulated with the following equation:
3.3.2 Model Feasibility Test (F test)
The model feasibility test (F test) is used to determine whether the dependent variable is simultaneously influenced significantly by the independent variables. Independent variables together have a significance influence on the dependent variable, if Fcount > Ftable with
significance value < 0,05.
3.3.3 Hypothesis Test (t test)
Hypothesis test is used to see whether the dependent variable
is partially influenced by
independent variables. Partially
independent variable has
significance influence on
dependent variable, if -tcount <
-ttable and significance value <
0,05.
3.3.4 Coefficient of
Determination Test (R2)
In this study, the magnitude of the contribution of the influence of independent variables on the dependent variable is predicted
using the coefficient of
determination (R2). The smaller
value of R2 means the weaker
the influence of independent
variables on the dependent
variable. In contrast, the
stronger theinfluence, if the
value of R2 is closer to 1
(Raharjo, 2017).
4. RESULTS AND DISCUSSION
4.1 Descriptive Statistics
Based on descriptive statistical
test, the results obtained are
presented in the following table:
Table 1 Descriptive Statistics
N Min Max Mean Std.
Source : data processed, 2017
From the results of descriptive statistics in table 1 above shows that the variabel tax planning minimum value of 0,677, maximum of 0,833, with a mean of 0,7556 and std. level
deviation of 0,0323. Variable
deferred tax expense minimum value of -0,007, maximum of 0,008, with a mean of 0,0008, and std. level deviation of 0,0031. Variable
earnings management minimum
value of -0,303, maximum of 0,508, with a mean of 0,0670 and std. level deviation of 0,1757.
4.2 Classical Assumption Test
4.2.1 Normality Test
Based on the normality test, the results obtained can be seen in the table below:
Table 2 Normality Test Results
Variable Sig Standard Conclusion
Unstandardize
d Residual 0,269 > 0,05
Based on table 2 above seen that the value of understandardized residual > 0,05 is 0,256. This means that data is normally distributed.
4.2.2 Multicollinearity Test
Based on multicollinearity test, then the results obtained in the table as follows:
Table 3 Multicollinearity Test Results
Variable Tolerance VIF Conclusion
TRR Source : data processed, 2017
From the test results in table 3 above, it can be seen that all independent variables have a tolerance value > 0,1 and VIF
Based on the autocorrelation test, the results obtained in the table below:
Table 4 Autocorrelation Test Results
Model
Durbin-Watson Certainty Conclusion
1 1,900 dU <DW< 4-dU There is no autocorrelation Source : data processed, 2017
The above autocorrelation test
results show that the
Durbin-Watson (DW) value of 1,900 is greater than dU and less than 4-dU. This means there is no
autocorrelation in this
regression model.
4.2.4 Heteroscedasticity Test
Based on heteroscedasticity test, then the test results can be seen in the following table:
Table 5 Heteroscedasticity Test Results
Variable Sig Standard Conclusion
TRR 1,000 > 0,05 No symptoms of
heteroscedasticity
DTE 1,000 > 0,05 No symptoms of
heteroscedasticity Source: data processed, 2017
The results of heteroscedasticity test above it is seen that all
independent variables have
significance value > 0,05. This means that in the regression model there are no symptoms of heteroscedasticity.
4.3 Multiple Linear Regression Analysis
Based on multiple linear
regression test that has been done, then presented the following results:
Table 6 Multiple Linear Regression Analysis Results
Variable ß (Coefficient of Regression)
Significance
Constant () 0,404 0,345
TRR -0,424 0,454
DTE -19,773 0,001
Source : data processed, 2017
4.4 Hypothesis Test
4.4.1 Model Feasibility Test (F test)
Based on the test of F test, then the results obtained can be seen below:
Table 7 Model Feasibility Test Results (F test)
Model Fcount Ftable Sig Standard Conclusion
The results of the analysis show that Fcount of 6,395 > Ftable of
3,110 < 0,05, it is concluded
that earnings management
simultaneously is influenced significantly by tax planning and deferred tax expense. So, the regression model meets the model feasibility test.
4.4.2 Hypothesis Test (t test)
Based on t test, then the results obtained are presented in table form below:
Table 8 Hypothesis Test Results (t Test)
Variable tcount t table Sig Std. Conclusion
TRR -0,752 1,990 0,454 <0,05 H1 ditolak
DTE -3,393 1,990 0,001 <0,05 H2 diterima
Source : data processed, 2017
From the results of hypothesis
1, the value of tcount of tax
planning variables obtained -tcount than -ttable (-0,752 > -1,990)
and significance value of 0,454 > 0,05, then H1 is rejected. Meaning that tax planning has
no effect on earnings
management. Hypothesis 2
value tcount variable deferred
tax expense obtained -tcount is
smaller than -ttable (3,393 <
-1,990) and significance value of 0,003 < 0,05, then H2 accepted. Meaning that the deferred tax expense has a negative and significant effect on earnings management.
4.4.3 Coefficient of
Determination Test (R2)
Based on the coefficient of determination test, then obtained the results presented in the following table:
Table 9 Coefficient of Determination TestResults (R2)
Model Adjusted
R Square Conclusion
1 0,115 Theindependent variable can
explainthedependent variable Source : data processed, 2017
The results of the coefficient of determination above shows that
the variable of earnings
management can be explained by tax planning variable and deferred tax expense of 11,5%, the value is derived from adjusted R square 0,115. While, 88,5% other variables outside of this research model influence earnings management variable.
5. DISCUSSION
5.1 The Effect of Tax Planning on Earnings Management.
Based on the results of
hypothesis test show that the variable tax planning does not affect the earnings management. The results of this study explain that tax planning is an attempt to regulate tax payments or minimize tax obligations by not violating the applicable legislation of the amount that should be.
Wheter or not tax planning has been done by the management company will not affect the practice of earnings management within the company. This is possibility because the management company that has made tax planning aims for the interest of the company’s external parties.
management that is nor supported
planning affects earnings
management.
significant effect to earnings
management. The results of this study explain that the deferred tax expense arises due to temporary
differences between accounting
earnings (earnings in financial statements according to GAAP for the benefit of external parties) with fiscal profit (profit according to Indonesian taxation rules used as the basis for tax calculation). The lower the company’s deferred tax expense, the less possibility it is that the
company practices earnings
management. This means that the
deferred tax expense affects
earnings management, if the smaller the tax expense paid, the greater the net profit to be generated.
Differences in accounting profit under Indonesian GAAP and tax
management practice earnings
management.
The results of this study in line with research conducted by Ulfah (2013), Ifada (2015), Parsaroan (2015), Astustik (2016), Minanari (2017), and Negara (2017) which states that the deferred tax expense effect on earnings management by empirical evidence. But the results of this study are not in line with research conducted by Aulia (2014), Amanda (2015) and Harnovinsah (2015) which states that the deferred tax expense has no effect on earnings management.
6. CONCLUSION
This study aims to examine the effect of tax planning and deferred tax expense to earnings management. The sample used in this study amounted to 84
annually report manufacturing
companies listed on the Indonesia Stock Exchange during the year 2014-2016.
Results of hypothesis 1 states that the variable of earnings management is not influenced variable tax planning. The
company’s management does tax
planning and the results do not
necessarily affect the practice of
earnings management within the
company. This is because of the possibility the management company that has made tax planning aims for the interest of the company’s external parties.
The results of hypothesis 2 shows that the variable of earnings management is affected negatively and significantly by deferred tax expense. The lower the company’s deferred tax expense, the less possibility it is that the company practices earnings management. This means that the deferred tax expense affects earnings management, if the smaller the tax expense paid, the greater
the net profit to be generated.
difference in the time of recognition of costs. This makes the company’s
management practice earnings
management.
7. REFERENCES
Aditama, F., Anna P. (2014). Pengaruh
Perencanaan Pajak Terhadap
Manajemen Laba Pada Perusahaan Nonmanufaktur Yang Terdaftar Di Bursa Efek Indonesia. Modus Vol. 26 (1): 33-50.
Amanda, F., Meiriska F. (2015). Analisis Pengaruh Beban Pajak Kini, Beban Pajak Tangguhan, dan Basis Akrual
Terhadap Manajemen Laba. Ultima
Accounting Vol. 7 No. 1: 70-86.
Aulia, I. F., Dwi F. P. & Herawati.
(2014). Pengaruh Beban Pajak
Tangguhan, Ukuran Perusahaan, dan Tingkat Hutang Terhadap Manajemen Laba. Universitas Bung Hatta.
Hapsari, D. P. & Dwi M. (2016).
Pengaruh Perencanaan Pajak
Terhadap Manajemen Laba dengan Arus Kas Operasi sebagai Variabel Kontrol. Jurnal Akuntansi: Vol. 3 No. 2.
Harnovinsah & Budisetiyawan (2015). Pengaruh Beban Pajak Tangguhan
dan Profitabilitas Terhadap
Manajemen Laba. Universitas
Pamulang dan Universitas Mercu Buana. Hal: 15-39.
Ifada, L. M., Nova W. (2015). “The
Effect of Deferred Tax and Tax
Planning Toward Earnings
Management Practice an Empirical
Study on Nonmanufacturing
Companies Listed in Indonesia Stock Exchange in The Periode of
2008-2012”. The International
Journal of Organizational
Innovation Vol. 8 No. 1: 155-170.
Minanari, R. A. K. (2017). “Effect of
Deferred Charges, Leverage and Size of Management Company
Earnings (Empirical Study at
Companies Jakarta Islamic Indes (JII) Listed in Indonesia Stock
Exchange Index Period
2012-2015”. Research Journal of Finance and Accounting, Vol. 8, No. 12.
Negara, A.A.G.P. & I.D.G. Dharma S.
(2017). Pengaruh Perencanaan
Pajak dan Beban Pajak Tangguhan Terhadap Manajemen Laba.
E-Jurnal Akuntansi Universitas
Udayana. Vol. 20: 2045-2072.
Parsaoran, L.B.M. (2016). Pengaruh
Akrual Diskresioner dan Beban
Pajak Tangguhan. Fakultas
Ekonomi: Universitas Komputer Indonesia.
Phillips, John, M. Pincus & S. Rego.
(2002). “Earnings Management:
New Evidence Based on Deferred Tax Expense”. The Accounting Review.
Raharjo, S. (2017). Makna Koefisien
Determinasi R Square. Retrieved
November 16, 2017,
Profitability and Deferred Tax Expense on Integrated Earning Management”. South East Asia Journal of Contemporary Business, Economics and Law, Vol. 7 Issue 1 (Dec.), 17-24.
Samrotun, Yuli C. (2015). Modul
Statistik Ekonomik II. Surakarta: Universitas Islam Batik.
Santana, Dewa K.W., Made G.W.
Pajak, Kepemilikan Manajerial, dan
Ukuran Perusahaan Terhadap
Praktek Manajemen Laba. E-Jurnal
Akuntansi Universitas Udayana
14.3: Hal 1555-1583.
Sugiyono. (2010). Statistika Untuk
Penelitian. Bandung: Alfabeta.
Ulfah, Yana. (2013). Pengaruh Beban Pajak Tangguhan dan Perencanaan Pajak Terhadap Praktik Manajemen
Laba. Prosiding Simposium