ITN-2 R
IVERB
ASINH
YDROLOGYM
ODEL,
AD
ISTRIBUTEDC
ONCEPTUALM
ODELF
ORP
REDICTINGF
LOODW
ITHOUTU
SINGC
ALIBRATIONM
ODELH
IDROLOGIDAS ITN-2, S
EBUAHK
ONSEPM
ODELD
ISTRIBUSIU
NTUKM
EMPREDIKSIB
ANJIRT
ANPAM
ENGGUNAKANK
ALIBRASIKustamar 1), Silvester Sari Sai 2), Erni Yulianti 3), Sunik 4) 1)
Water Resources Engineering, Civil Engineering & Planning Faculty, ITN Malang, email: [email protected] 2)
Geodesy Engineering, Civil Engineering & Planning Faculty, ITN Malang, email: [email protected] 3)
Water Resources Engineering, Civil Engineering & Planning Faculty,ITN Malang, email: [email protected] 4)
Civil Engineering, Universitas Widyakarya Malang, email: [email protected]
ABSTRACT
The change process induced by rain in one area which eventually converts such area to a river basin is relatively complicated due to a number of physical factors present in the interrelated river basins. Hence, a proper hydrology model is required in order to be able to predict flood debits. Insufficient data on rain and hourly debits in the process of setting a Regional and Space Planning demands the invention of a hydrology model that can be utilized to predict flood debits with high accuracy without conducting any calibration process. In order to meet such a need, the Hydrology Model of ITN-2 River Basin, as an improvement of the former Hydrology Model of ITN-1 River Basin, has been developed. Test results have indicated that Hy-drology Model of ITN-2 River Basin is adequately sensitive to the condition change in land utilization and can be used to predict debits without any calibration process.
Keywords: Hydrology Model of River Basin, Flood Analysis without Calibration
ABSTRAK
Proses perubahan yang disebabkan oleh hujan di satu daerah yang akhirnya mengubah wilayah tersebut menjadi sebuah Daerah Aliran Sungai (DAS) yang relatif rumit, karena sejumlah faktor fisik hadir saling terkait di daerah aliran sungai ter-sebut. Oleh karena itu, model hidrologi yang tepat diperlukan agar dapat memprediksi debit banjir. Karena data hujan dan de-bit per jam tidak memadai dalam proses menetapkan Perencanaan Wilayah & Ruang, menuntut penemuan model hidrologi yang dapat digunakan untuk memprediksi debit banjir dengan akurasi yang tinggi tanpa melakukan proses kalibrasi. Untuk memenuhi kebutuhan seperti itu, telah dikembangkan Model Hidrologi DAS ITN-2, sebagai perbaikan dari Model Hidrologi DAS ITN-1. Hasil tes telah menunjukkan bahwa Hidrologi Model DAS ITN-2 adalah cukup sensitif terhadap perubahan kon-disi dalam pemanfaatan lahan dan dapat digunakan untuk memprediksi debit tanpa proses kalibrasi.
Kata-kata Kunci: Model hidrologi DAS, analisis banjir tanpa kalibrasi
INTRODUCTION
Anticipation towards disaster caused by flood in Indonesia has been very low as reflected in each process of setting a Re-gional & Space Planning. Identification of flood-threatened areas has been conducted, generally, by using statistical models based upon the occurrence of disasters. The accuracy of such method becomes questionable when factors such as environmental dama-ge and the effects of chandama-ge in land utilization planning that ha-ve taken place are not taken into account (Kustamar dan Sari Sai, 2008).
The change process carried by rain in one area which then converts such area to a river basin is relatively complicated due to a number of interrelated factors. According to Kustamar at.all
(2009), the primary factors include rain intensity and duration, drainage system density, topography, soil density and texture, and condition of land utilization. These factors produce results such as, among others, interception, evapotranspiration, infiltrati-on, speed of surface water runoff, and speed of ground water flow. Due to the complexity of the process, a model is required in order to be able to analyze it.
The type of such model should be the distributed one. Va-rious hydrology models have been developed, either of distribu-ted or lumped type (Singh and Woolhiser, 2002). According to
Evangelos Rozos (Rozos, et al., 2004), the abilities of such mo-dels vary, ranging from calculating surface water flow debit, gro-und water flow, and river debit hydrograph to estimating surface erosion. The core model of all models is the River Basin hydro-logy model that performs the computation of river debits due to rain. One of the distributed types of River Basin hydrology mo-dels is ITN-1 River Basin Hydrology Model.
ITN-1 River Basin Hydrology Model was developed in or-der to analyze flood debit in a river basin where a couple of rain data and hourly debits, along with adequate spatial information were present. Increasing the accuracy of flood debit prediction caused by change in land use was conducted by providing 2 (two) numerical calibration facilities. Based upon the pair of rain data and hourly debits, calibration was performed by simulating cali-bration coefficients until the correct peak value and debit hydro-graph slope rate were obtained (Rozos, at al., 2004).
The improvement found in ITN-2 River Basin Hydrology Model is the model’s increased sensitivity towards the change in land type and land use condition, supported by the strategy in the computation process. The model’s increased sensitivity towards land use condition is performed by accommodating its effect on infiltration capacity. This effect is formulated in a correction coefficient (Cc), i.e., the comparison of the magnitude of infil-tration capacity measured in one location with the infilinfil-tration ca-pacity obtained from soil type information.
Improvement has been made in the analysis process as well, i.e., the separation of spatial analysis process and numeri-cal computation found in the former model is replaced by per-forming them simultaneously in the current model. In the former ITN-1 River Basin Hydrology Model, the spatial analysis was conducted by means of ArcView GIS, while the numerical analy-sis was performed by using Fortran. In ITN-2 River Basin Hy-drology Model, on the other hand, the spatial and numerical ana-lysis is conducted by means of Model Builder found in ArcGIS. This is expected to provide ease in its execution.
Lesti River Basin, which is under the administration of Ma-lang Regency, East Java (Figure 1) was selected in regard of its facilities for the model capacity test while its field data was used for problem prototype.
Figure 1. Location of Lesti River Basin
THEORETICAL BASIS
River Basin Hydrology Model
The term “River Basin hydrology” is defined as the branch of hydrology dealing with the integration of hydrology process in one river basin in relation with the basin’s responsiveness. Its hy-drological process and spatial diversities are indicated by climate, topography, geology, land, vegetation and land use.
The development of River Basin hydrology models has been very rapid, in terms of quantity, concepts, problem approa-ches, and data analysis methods as well. This is related with the development of data computation system and data acquisition technique. Based upon documented data for the purpose of vie-wing the handling of spatial data variabilities, River Basin hydro-logy models can be grouped into 3 (three), namely distributed, quasi-distributed and lumped.
The lumped-type model perceives a River Basin as a unity, and therefore disregards spatial variation in terms of process, in-put, boundary condition, or hydrological magnitude. On the other hand, the distributed type is suitable for handling spatial variables either in terms of a river basin’s physical aspects or its hydro-logical factors by performing equation solution for each data gro-up or grid. The distributed type is suitable for handling a river ba-sin’s complex conditions, therefore it requires a great number of input data, as opposed to the lumped one. In order to reduce the amount of input data required, another type called the Quasi-Dis-tributed model was then developed.
A summary of the description of each distributed-type of River Basin hydrology models can be found in Table 1. From the summary of each River Basin hydrology model in Table 1 it can be concluded that the majority of the models is comprised of a combination of surface water runoff model and ground water flow, and includes parameters such as interception, evapotranspi-ration, infiltevapotranspi-ration, surface and ground water flow. This matches the objective of modeling that is predicting river debits and/or surface erosion in one river basin as a result of rainfall.
River Basin Hydrology Model Application
A river basin hydrology mathematical model is designed to respond to Penman’s question at one level of detail depending on the existing problem and is used in a broad spectrum dwelling between river basin management and design. These models are used in planning, design and design projects to maintain water and land resources as well as preserve their quality. In land re-views, models are used for a variety of purpose such as planning and designing land conservation practice, irrigation water mana-gement, marsh-land reclamation, and sub-surface water manage-ment. In a broader scope, models can be used for protection-against-flood project, dam rehabilitation, flood control manage-ment, water quality evaluation, and water availability forecast.
Table 1. Summary of Description of Distributed-type River Basin Hydrology Model
Model Identity Concept Component & Approach Capability
TOPOG_IRM 1.Transpiration, infiltration and surface runoff
2.Vegetation carbon balance, by plant- growth simulation
Prediction of dynamic interaction between land, vegetation and atmosphere in River Basin
FRHYMAP Hydrology Model & Hydraulics: 1. Surface runoff (2-D),
2. Ground water addition, potential hourly Evapotranspiration, by Penman-Montrith.
Prediction of effect of land use change on flood debits and ground water
SHAL Z 1. Rain, Evapotranspiration,
2. Surface catchment area, infiltration, 3. 2-D Surface Runoff, Perkolasi.
PRMS 1. Interception, Evapotranspiration, surface & sub-surface water flow by non-linear routing , River Basin is divided into HRU
2. GIS for: displaying spatial data being processed as well as result of simulation
Continuous daily debit prediction
MIKE-SHE 1. SHE: Interception, Unsaturated Surface Water by Richard equation, 3-D Ground water flow, 2-D Surface runoff, difussion,
2. MIKE-11, flow in channel by 1-D routing.
Water flow process simulation in River Basin
InHM 1. Surface runoff by 2-D wave difussion,
2. Flow through saturated porous medium by 3-D Richard model ,
Computing surface and sub-surface flow , and sediment transportation as well
IGSM2 1. Ground water horizontal flow analysis by finite element,
2. Inter-layer approached by vertical water flow
Ground water surface
elevation simulation in various aquiver layers
MODFLOW 1. Surface runoff with 1-D non-permanent flow 2. Ground water flow, difference up to 3-D 3. Database System by GIS
Continuous River Debit prediction
Model Hidrologi DAS ITN-1
1. Surface runoff with 1-D non-permanent flow 2. Accommodating effects of: Interception and
infiltration.
3. Infiltration capacity information based on soil type map
Continuous River Debit prediction
Source: Kustamar and Yulianti, E. (2009)
A river basin model is used to understand the dynamic in-teraction between climate and “land-surface hydrologi”. Accord-ing to Sokrut (2001) utilized a distributed-type hydro-logy model, a combination of surface runoff and sub-surface models as a me-ans to manage river basins. Readers are referred to Yeo, et al. (2004). Optimizing Patterns of Land Use to Reduce Peak Runoff Flow and Nonpoint Source Pollution combined hydrology and land use models to optimize land use planning for the purpose of reducing peak surface runoff debit. The optimized land use plan-ning obtained was able to achieve a debit peak decrease caused by rain with a repeatable period of 1, 2, 5 and 10 years with a magnitude of 15% up to 20% from the previous conditions. In short, a river basin model has become an important means for water resource planning, development and management.
During 1980-1990 hydrology models were related to che-mistry, geology, environmental biology, meteorology and climate science. This relation was based on two considerations. First, an improved understanding in spatial variabilities of hydrology pro-cesses and the role of scaling. Secondly, the digital revolution made the use of GIS, remote sensing technology and database system management possible. In the future, river-basin hydrolo-gy mathematical models will become the means for water resour-ces planning, development, design, operation and management. This anticipates the future where the integration of river-basin hydrology models into environment and ecology management will be cultivated extensively (Haji and Legowo, 2001).
Most of the current river-basin hydrology models are com-prehensive, distributed in type and based upon physical conditi-ons. They possess accurate capabilities to imitate river-basin hy-drology and can be applied to a broad scope of water resource problems (Singh and Woolhiser, 2002). Supported by the rapidly developed information technology, models’s quality can be esca-lated by the use of tools for spatial analysis, such as in the form of Geographical Information System (GIS).
River Basin Hydrology Model Component
Vertically-bound Water Motion
Referring to the model’s purpose of acquiring a surface runoff debit, the factors which contribute to the debit’s magnitu-de should be taken into account. Those factors are interception, infiltration, and land surface roughness (Kustamar, 2008).
Interception
Interception is a portion of hydrology component that shows the magnitude of rain warer trapped in land cover and then re-evaporated. The size of interception coefficient (%) is deter-mined by land type and use condition. Consequently, modeling that has the objective of analyzing the effects of land use on river water flow should be taken into account.
Following the vegetation’s growth, the effects of vegetati-on’s condition on interception (It) are as follows:
1. Lesser amount of water escapes (A1) due to denser branches. 2. Increase in trunk flow (Ab) even though in small amount. 3. Increase in receiving capacity of canopy’s surface and fallen
leaves’ zones.
Evapotranspiration
Evapotranspiration will take place with the presence of 2 (two) primary conditions, namely the energy factor causing the evatranspration and the evapotranspirable-water. Such factors are sun’s radiation, wind, relative humidity and temperature.
The value obtained from empirical formula signifies the size of potential evapotranspiration. The size of actual evapotran-spiration, on the other hand, is very much dependent on the avail-ability of water content that can be evaporated.
In relation with interception, the types of plantation can be classified into 2 (two), i.e., heterogeneous and homogeneous. The interception value if each type is shown in Table 2 and Table 3.
Table 2. Interception Value in Heterogeneous Plantation in Konto Atas River Basin
Parameter % of Monitored Rain Evaporation from canopy 0.30 Interception during rainfall 17.6 Interception after rain 8.8
Table 3. Interception Value in Plantation with Homogeneous Vegetation
Plant Species Int. (%)
Acacia aneura 13.0
Acacia harpophylla 15.2
Aegle maramelos 13.1
Agropyron koeleria 22.3
Bouteloua Curtipendula 18.1
Crosotebush 12.2
Eucalyptus 8.3
Eucalyptus camadldulensis 14.3
Eucalyptus Regnans 23.3
Eucalyptus Rossii 10.6
Eucalyptus Obliqua 15.0
Hilaria belangeri 10.8
Mixed conifer and hardwood 22.0
Montance rain forest 18.2
Oats 20.5
Pinus radiata 26.5
Pinus rigida 19.1
Pinus wallichina 21.0
Rain forest 8.9
Rain forest 27,0
Soya beans 32,0
Tarbush 6.1
Neopanax arboreum scrub 27.0
Cypress 26.0
Bamboo 20.0
Source: Yeo, et al. (2004), Kustamar, et al. (2009).
Infiltration
Water reaches land surface will partly seep (infiltration) downward to become sub-surface water while the rest will rema-in on the surface. Actual rema-infiltration depends on the rema-infiltration capacity and the portion of rain water that possesses the potential to get seeped.
Vegetation factors can affect the magnitude of infiltration capacity because the activities in the plants’ root system may in-crease soil aggregate solidity and macro porous space. This way, it can be said indirectly that land use affects infiltration capacity. The infiltration avarage value is shown in Table 4.
Table 4. Infiltration Average in Monte Carlo
Source: Pitt, et al. (2001).
Horizontally-bound Water Motion
In River Basin Hydrology modelling of distributed type, water flow on land surfaces is approached by water flow through open channels. For the purpose of analysis, a river basin is divid-ed into independent cell forms. Debit in each cell is computdivid-ed by 1 dimensional flow concept by using Manning equation as follo-ws (Pitt et.al ,2001).
(1)
(2)
(3)
(4)
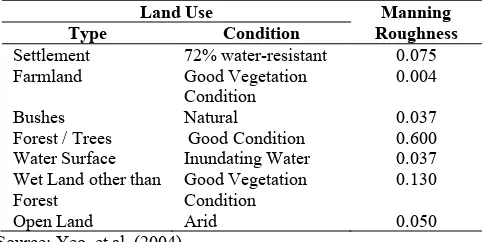
With: n, L, h, S as Manning roughness coefficient (Table 4), cell size, surface runoff water elevation, and topographical slopeness in cell respectively. Cummulative inter cell debit is computed with regard to surface water flow di-rection. Water flow direction model is setup based upon land surface slopeness, therefore forming a sequence of synthetical rivers.
Table 5. Manning Roughness Coefficient
Source: Yeo, et al. (2004).
RESEARCHMETHOD
Operational Framework
Research proses phases in expanding ITN-1 River Basin Hydrology Model into ITN-2 river Basin Hydrology Model is described briefly in Table 6.
Table 6. Research Process Stages
Group Sub Group Proses Stage
A Evaluation on with high accuracy Spatial data
Preparation Stage
2 Merging spatial and
numerical analysis
builder found in Arc GIS
in relation with the role of numerical calibration parameter
Model Development Strategy
The strategy used in developing ITN-1 River Basin Hydro-logy Model into ITN-2 River Basin HydroHydro-logy Model is as fo-llows:
1. Evaluating the shortcomings found in ITN-1 River Basin Hy-drology Model in relation with: a) dependency on rain data and hourly debits, and b) user’s ease in preparing spatial data format.
2. Identifying the physical parameters of a River Basin that have a great impact on surface runoff debit yet have not been accommodated in ITN-1 River Basin Hydrology Model. 3. Constructing a model component to minimalize the need for
numerical calibration.
4. Identifying a user’s difficulties in preparing river-basin spa-tial data.
5. Constructing a model component which is able to analyze spatial data without having to convert them first to ASCII format.
6. Replacing a number of components with the component models already developed in order to obtain a compact unified model.
7. Testing the model’s reliability. Group
Settlement 72% water-resistant 0.075
Farmland Good Vegetation
Condition
0.004
Bushes Natural 0.037
Forest / Trees Good Condition 0.600 Water Surface Inundating Water 0.037 Wet Land other than
Forest
Good Vegetation Condition
0.130
RESEARCH RESULTS
Model Component Vertically-bound Water Motion
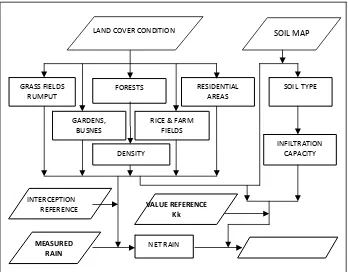
The model component of vertically-bound water motion is developed based upon rain water motion (measured rain) that turns into land surface water. The process of such water motion is clarified as follows: a) rain water falls upon trees’ branches will be partly absorbed by them and re-evaporates during the inter-ception process. The amount of the intercepted water depends on the amount of rain and the type of land use.
Water which escapes trees’ branches and falls to the land surface (net rain) will in turn get infiltrated while the rest will re-main on the land surface. The amount of water rere-maining on the land surface is affected by the infiltration capacity whose mag-nitude is determined by soil infiltration capacity (Cinf) and its density effect. This description is illustrated in Figure 2. The amount of water left on the land surface is determined by infiltra-tion capacity whose magnitude is affected by soil infiltrainfiltra-tion ca-pacity (Cinf) and the effect of its solidity. This description is cla-rified in Figure 2.
Figure 2: Model Component of Vertically-bound Water Motion
Spatial and Numerical Data Analysis
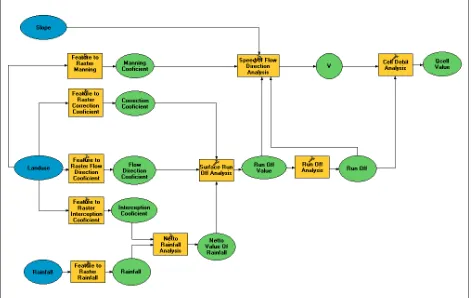
Model Builder is ArcGIS’s Toolset that is used to develop, edit and compose models. By using Model Builder, spatial ana-lysis based on vector or raster data can be performed in a more structured and simpler way. In this research the analysis model u-sed to compute debit value of each cell is constructed from a number of mathematical processes based upon raster data.
Raster spatial data used, i.e., slopeness data obtained from DEM (digital evaluation model) Shutlle Radar Topography Mis-sion (SRTM), data on land use and rainfall rate. Land use raster spatial data and rainfall rate data are obtained from vector or feature towards raster with a grid value of 100 cells. The rasteri-zation process of the vector data is conducted based upon attribu-te data possessed by each vector data. The attribuattribu-te and vector spatial data used are rainfall data, manning coefficient, correction coefficient, interception coefficient, and flowing coefficient. The description on spatial data type and attribute data used to develop raster spatial data is shown in Table 7.
In the next step, the raster data produced is used in the ras-ter spatial analysis phase, i.e., computing net rain analysis, sur-face run-off analysis, wet cross-sectional area analysis, flow spe-ed analysis, and cell debit analysis. The raster spatial analysis is conducted by using map algebra expression tools in Model
Buil-der. Description on the required raster spatial data type to perfo-rm the analysis along with the mathematical equations used can be seen in Table 8.
Table 7. Vector Spatial Data Type Used for Raster Data’s Spatial Data
Rainfall Rate Rainfall Rate Raster 100
Land Use
LAND COVER CONDITION
Table 8. Vector Spatial Analysis Type for Computing Each Cell Debit
Raster Spatial Data Analysis Type Output Data Mathematical Model of Mathematical Operation
-Interception Coefficient
Union Net Rain Interception Coefficient * Rain Raster -Rainfall Rate
-Net Rain
Union Surface Runoff Net Rain / (Flowing Coefficient * Correction Coefficient)
-Flowing Coefficient
-Correction Coefficient -Slopeness
-Surface Flow Union Wet Cross-Sectional
Area (100 * Surface Runoff) -Wet Cross section area
Union Flow Speed
(1/Manning) * POW((100 * Surface Runoff) / (100 + (2 * Surface Runoff)),0.67) *
POW(slope2,0.5) -Surface Flow
-Manning Coefficient -Slopeness
-Flow Speed Union Each Cell’s Debit Flow Speed * Wet Cross=Sectional Area
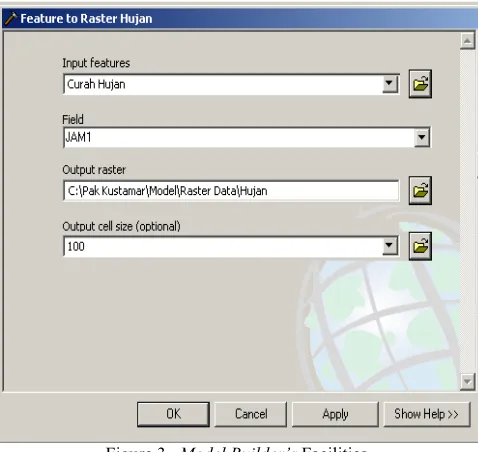
The whole process to compute each cell’s debit is performed by using ModelBuilder as shown in Figure 3.
Figure 3. Model Builder’s Facilities
Model Builder used for computing each cell’s debit can be used
for computing the debit value of each cell for figuring out each cell’s debit value for an hourly time unit by converting rainfall data source in the rasterization process of rainfall rate data such as shown in Figure 5.
Model Description
Merging the above two model components into ITN-1 Ri-ver Basin Hydrology Model produces a model with the following description:
1) A model of conceptual-distributed type.
2) Accommodating the effects of land use during the change process induced by rain that converts an area into a river by using Interception, Infiltration and Manning roughness (n) parameters, .
3) A Surface Runoff model with one-dimensional flow concept (1D),
4) A model equipped with facilities to input Kk value which is meant to rectify infiltration capacity data which is based upon soil type map along with land use information.
5) Spatial, hydrology and hydraulics analysis conducted by u-sing ArcGIS.
6) Can be used to compute hourly surface runoff debits without going through calibration process.
Model Testing
Model testing is meant for discovering a model’s capabi-lities in simulating and analyzing real world condition, in this ca-se, surface runoff debit hydrograph and low water flow parame-ters are used as measurement. A model is considered capable to simulate and analyze real conditions if the results of a model’s computation possess high equivalents to data yielded from mea-surement results.
Figure 4. Surface Runoff Debit
A measure of equivalence is demonstrated by a model’s capability in imitating graph trends resulting from measurement (debit hydrograph) in the calibration or verification process. In order to find out that equivalence, trend testing is conducted in the form of graph displays by comparing measurement results to the model’s results. Two (or more) graphs are considered posses-sing equivalent trends when they visually display equivalent sha-pes.
Used in the model testing were the physical data of Lesti River Basin, brief-duration rain data from a number of automatic rain stations, debit processed from the recorded water surface ele-vation. Computation results produced by ITN-2 River Basin Hy-drology Model (ITN-1 River Basin HyHy-drology Model equipped with the application of KK value) showed a quite significant change.
the role of numerical calibration lesser since the model accom-modated a greater number of strongly influential parameters. This condition signifies that in the absence of a measurement result of debit data in a river basin, while its other physical data are suffi-ciently accurate, the required calibration process can be left out.
The perfection of Kk value in various researches which analyze the effect of land use and cultivation is predicted to further de-crease this value to be closer to a value of 1. This will result in the increased accuracy of a model as well as ensure the discard of aby calibration process
Figure 4. Each Cell’s Debit Computation Sequence by Using Model Builder
CONCLUSION ANDSUGGESTION
Conclusion
Based upon the result of the research above, it can be con-cluded that:
1. ITN-2 River Basin Hydrology Model is a River Basin hydro-logy model of conceptual-distributed type, as a result of im-proving ITN-1 River Basin Hydrology Model.
2. The model’s perfection was achieved by introducing Kk parameter which represents the effet of land condition on in-filtration capacity, as well as using model builder facilities found in ArcView for analyzing flood debit.
3. By accommodating the effect of land use in analyzing infil-tration capacity, the role of numerical calibration parameter becomes very small. Hence ITN-2 River Basin Hydrology Model can be used to analyze flood debit without the need of calibration process.
Suggestion
To increase the accuracy of debit analysis results, Kk valu-es should be enriched by rvalu-esearchvalu-es in order to accommodate land condition in relation with its cultivation.
REFERENCES
Haji,T.S. dan Legowo, S. (2001). “Pemanfaatan GIS untuk Mo-del Hidrologi Sebar Keruangan.” Paper presented in “PIT XVIII HATHI”, Malang.
Kustamar. (2008). “Simulasi Penggunaan Lahan Untuk Mengen-dalikan Fluktuasi Debit Kali Lesti.” Paper presented in
“Se-minar Nasional Teknik Sumberdaya Air 2008”.
UNJANI-UNPAR-ITENAS-PUSSDA-HATTI. Bandung.
Kustamar dan Sari Sai, S. (2008). “Penanganan Banjir Bandang di Kota Larantuka, Nusa Tenggara Timur.” Buletin Keairan
PULITBANG PU Bandung. Vol.1 No.1, pp. 11-20. Juny 2008.
Kustamar. (2009). Konsep dan Contoh Pemodelan Hidrologi
DAS, Malang, UMM Press.
Kustamar, Suharto, B., Sumarno, Budikusuma, W. (2009). “Pe-ngembangan Model Simulasi Penggunaan Lahan Untuk Me-ngendalikan Fluktuasi Debit Sungai.” Jurnal Rekayasa. Civil Engineering Faculty, Jember University. 6 (1), pp. 1-15. Kustamar and Yulianti, E. (2009). “ITN-1 Model Hidrologi DAS
ITN-1.” Jurnal Pusair, PULITBANG PU Bandung. Vol.5 No.9, pp. 1-15. November 2009.
Pitt, R., Chen, S.E., and Clark, S. (2001). Infiltration Through Compacted Urban Soil and Effects on Biofiltration Design,
Presented at the Low Development Roundtable Conference. Rozos, E., Efstratiadis, A., Nalbantis, I., and Koutsoyiannis, D..
(2004). “Calibration of a semi-distributed model for con-junctive simulation of surface and groundwater flows.”
Hy-drological Sciences Journal, Volume 49, 5 October 2004 ,
pp. 819 - 842
Singh, V.P., and Woolhiser, D.A. (2002). “Mathematical Mode-ling of Watershed Hydrology.” J. Of Hydrology Engineering,
7(4), pp. 270-292July/August 2002
Suharto, B. 2002. Modeling Hidrologi Untuk Pengelolaan Sum-berdaya Air Dan Peramalan Hidrograf Banjir Pada Daerah Aliran Sungai, Professorship Speech in Inauguration as
Pro-fessor of Soil Engineering and Water Management ,
Brawi-jaya University, Malang.
Yeo, I.Y., Gordon, S.I., and Guldmann. J.M. (2004). “Optimizing Patterns of Land Use to Reduce Peak Runoff Flow and Nonpoint Source Pollution with an Integrated Hydrological and Land-Use Model.” American Meterorological Society