ISSN: 1693-6930
accredited by DGHE (DIKTI), Decree No: 51/Dikti/Kep/2010 595
Assessment of Voltage Stability Using Network
Equivalent
Priyanath Das1, Sunita Halder nee Dey*2, Abhijit Chakrabarti3, Tanaya Datta2 1Department of Electrical Engineering, NIT, Agartala, INDIA
2
Department of Electrical Engineering, Jadavpur University, Kolkata 700032, INDIA
3Department of Electrical Engineering, Bengal Engineering and Science University, Shibpore, Howrah 711103 , INDIA
Corresponding author: Sunita Halder nee Dey, e-mail: [email protected]
Abstrak
Pada makalah ini indeks stabilitas tegangan sistem cepat (FSVSI) diusulkan untuk menilai stabilitas tegangan sistem keseluruhan dari sistem daya multi-bus pada titik operasi tertentu menggunakan konsep ekuivalen jaringan dua bus. Sebuah indeks stabilitas tegangan langsung universal juga telah dieksplorasi untuk menilai sistem lokal (DVSI) serta stabilitas tegangan sistem keseluruhan (DSVSI). Sebuah indeks yang disebut faktor kualitas transmisi sistem (STQF) telah dikembangkan untuk menilai kualitas transmisi daya dari sistem secara keseluruhan dalam konteks stabilitas sistem. Dua pengendali FACTS, TCSC dan STATCOM juga telah dimasukkan dalam penelitian ini untuk mengamati keefektivitasnya guna memastikan stabilitas tegangan. Hasil penelitian menunjukkan STATCOM lebih baik dalam peningkatan stabilitas tegangan sistem daya dibandingkan dengan TCSC. Konsep yang dikembangkan telah divalidasi menggunakan India Easten Grid praktis (WBSEB sistem) dan memiliki potensi yang tinggi aplikasi on-line.
Kata kunci: Equivalent two-bus network, FSVSI, DSVSI, STQF, DVSI
Abstract
In this paper a fast system voltage stability index (FSVSI) has been proposed to assess overall system voltage stability of a multi-bus power system at a particular operating point using the concept of two bus network equivalent. A universal direct voltage stability index has also been explored to assess local (DVSI) as well as overall system voltage stability (DSVSI). An index called system transmission quality factor (STQF) has been developed to assess the power transmission quality of the overall system in the context of voltage stability. Two FACTS controllers, TCSC and STATCOM have also been incorporated in the present study to observe their effectiveness to ensure voltage stabilty. STATCOM has been found to be superior in order to improve voltage stability of power system as compared to TCSC. The developed concept has been validated using practical India Easten Grid (WBSEB system) and it has a high potential of on-line application.
Keywords: Equivalent two-bus network, FSVSI, DSVSI, STQF, DVSI
1. Introduction
Modern power systems operate with the limitations of unplanned load growth, non uniform load demand and limited number of transmission lines [1], [2]. In recent times several authors have pointed out that one of the most important operating problems of complex interconnected power system is voltage instability. Voltage instability is widely recognized as a significant threat of power system blackout and iIts occurrence may not be directly linked with angle instability. As far as real-time operation is concerned, there is a need for appropriate tools to identify dangerous contingencies, assess security margins and suggest corrective actions to prevent voltage collapse. Efforts are undertaken to identify voltage Collapse, determine the distance of current operating point from voltage collapse and develop control strategies to steer the operating point away from voltage collapse to maximize voltage stability margin [3].
been established covering both the static and dynamic aspects of the problem [1], [4]. Concepts have been developed to identify weak bus or transmission lines in power system [9]. In recent times, FACTS controllers have become essential for reliable operation of power system. Researchers have developed mathematical model of FACTS controllers to incorporate them in modern power system analysis. Research is continuing to find suitable FACTS controller for a particular system operation [10], [11].
This paper includes the voltage stability analysis of power system network with the help of network equivalent. A two bus network equivalent has been developed from the actual multi-bus system using total generation, load and loss available from load flow calculation. In this paper, Direct Voltage Stability Indicator (DVSI) and Fast System Voltage Stability Index (FSVSI) being described, they have been applied to assess local voltage stability and overall system voltage stability with help of network equivalent repectively. A Direct System Voltage Stability Index (DSVSI) has also been derived from DVSI to assess total system voltage stability using two bus network equivalent of a multibus power system. System Transmission quality Factor (STQF) has been proposed to monitor overall transmission quality of the interconnected power system in the context of voltage stability. Performances of STATCOM and TCSC to maintain voltage stability have also been evaluated and STATCOM has been found to better to enhance voltage stability at any operating condition. Proposed concepts have been described using a practical WESEB (Indian eastern Grid).
2. The Proposed Method
2.1 Concept of network equivalent
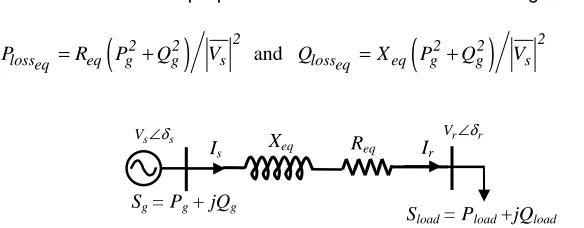
With reference to the proposed two bus network shown in Figure 1 [5],
(
2 2)
2 and(
2 2)
2losseq eq g g s losseq eq g g s
P =R P +Q V Q =X P +Q V (1)
However, for any multi-bus power system, following the principle of energy conservation, energy generated = energy consumed + energy loss; thus we can write,
and
g load loss g load loss
P = P + P Q = Q + Q
∑
∑
∑
∑
∑
∑
(2)The two bus system shown in Figure 1 can be treated as a equivalent model of a multi-bus system provided following conditions of equality are satisfied, i.e.,
and
gmultibus geq, loadmultibus loadeq lossmultibus losseq
S =S S =S S =S
∑ ∑ ∑
Assuming with Vs =1p.u., the line parameters of two bus equivalent network are given by
(
)
and(
)
lossmultibus lossmultibus lossmultibus lossmultibus
eq 2 2 2 eq 2 2 2
g g g g
s s
P P Q Q
R X
P Q P Q
I I
= = = =
+ +
∑
∑
∑
∑
(3)
It should be noted here that Xeq will be positive for inductive transmission line loss at heavy loading condition and negative for capacitive transmission line loss at light loading condition.
Sg = Pg + jQg S
load = Pload +jQload
Is Ir
r r
V∠δ Xeq Req
s s
V∠δ
The validity of the developed equivalencing technique has been checked by the following method:
and
loss lossmultibus losseq loss lossmultibus losseq
P P P Q Q Q
∆ =
∑
− ∆ =∑
− (4)If
∆
P
lossand
∆
Q
loss be less than a specific tolerance(
say
ε
=
0.0000001
)
, then it can be reasonably concluded that the proposed two bus model method is an equivalent of the multi-bus system at that particular operating point.2.1.1 Direct Voltage Stability Indicator (DVSI)
Considering a generator bus connected to a load bus through a transmission line having series admittance YLand shunt admittanceYS, all expressed in per unit quantities, the system performance equations may be presented as
[ ] [ ][ ]
I = Y V where[ ]
loadg
I I
I
=
and
[ ]
V V
E
=
and the system admittance matrix is given by
[ ]
LL LS(
L S)
(
L)
SL SS L L SY Y Y Y Y
Y
Y Y Y Y Y
+ −
= =
− +
Here V ,Iload,Sload and E ,I ,Sg gare complex voltages, currents and powers at the load bus and generator bus respectively. Now considering the expressions of receiving end current,
(
)
*LL LS load
Y V+Y E= S V Iload =
(
Sload V)
*Q
Simplification yields, S*load YLL =V 2+V V0 * =V2+V V e0 jδ (5)
where 0 LS
LL Y
V E
Y
=
and
δ is the angular difference between V and E.
Noting that V0 is kept constant by keeping the sending end voltage constant, we have
(
)
( )
2(
)
( )
1 0 and 2 0
* *
load LL load LL
Re S Y = f V ,
δ
=V +V V cosδ
Im S Y = f V ,δ
=V V sinδ
(6)The Jacobian matrix of the above power flow equations becomes singular at voltage stability limit [2]. Equating the determinant of Jacobian matrix of equation (6) to zero, we get
2 2
0 0
2V V cosδ +V V =0 (7)
Equation (7) determines the voltage stability limit where the point of voltage instability coincides with the singularity of the Jacobian matrix of the load flow. Hence from equation (7),
(
0)
1 2Re V V = − (8)
Simplification of equation (1) yields,
(
2)
0 1
* * *
load LL
From equation (8) and (9) it can be written that,
(
2)
1
*
load LL
S V Y = (10)
Equation (10) gives the criterion of voltage stability of the assumed line model. In other words, for a system as described, to retain its voltage stability, the magnitude of the expression
(
2 *)
load LL
S V Y must be less than unity. Sload
(
V2YLL*)
is thus an indicator of voltagestability and can be termed as Direct Voltage Stability Index (DVSI). DVSI gives information about the local voltage stability of the network i.e., the voltage stability with respect to a particular load bus.
2.1.2 Direct System Voltage Stability Index (DSVSI)
The DSVSI computed for the network equivalent of a power system may be a direct indicator voltage stability of the complete system and can be defined as Direct System Voltage Stability Index (DSVSI). The expression of DSVSI is given below:
(
2 *)
load r LL
DSVSI= S V Y (11)
Where,SLoad, Vr are total complex load of the system and receiving end voltage of the
equivalent network and YLL =
(
Req+ jXeq)
−1.2.1.3 Fast System Voltage Stability Index (FSVSI)
Let us again consider the two-bus system shown as in Figure 1. This is an equivalent of a multi bus power system at a certain operating point. From the basic voltage-current relationship between sending end and receiving end it may be written that
∴ Vr2+
(
P Rr eq+Q Xr eq) (
+ j P Xr eq−Q Rr eq)
= V Vs r(
cosδ + j sinδ)
(12)Separating the real and imaginary part of this equation, the following two equations can be obtained.
(
)
2
r r eq r eq s r
V + P R +Q X =V V cosδ (13a)
and P Xr eq−Q Rr eq= V V sins r δ (13b)
By substituting the value of Pr from equation (13b) in equation (13a), we get
2 2
0
eq r eq
r s r r eq
eq eq
R sin Q R
V V V cos Q X
X X
δ
δ
+ − + + =
(14)
For simplicity, let us consider that the transmission line resistance has very small value; thus gives Req2 ≅0 and thus equation (14) reduces to
2
0 eq
r s r r eq
eq R sin
V V V cos Q X
X δ
δ
+ − + =
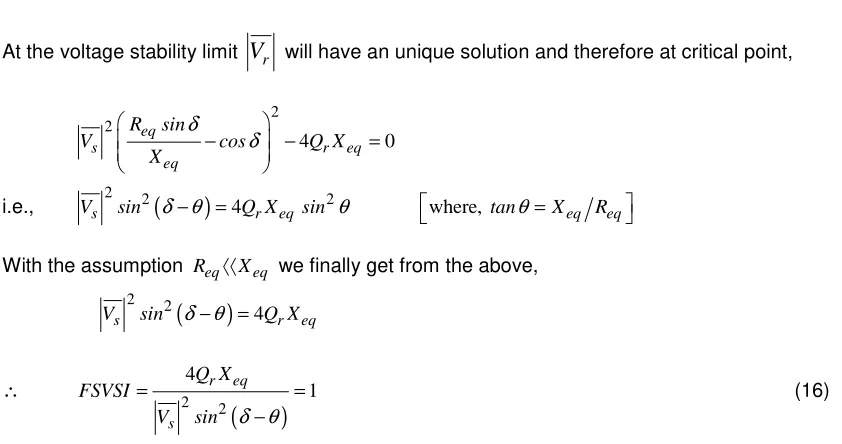
At the voltage stability limit
V
r will have an unique solution and therefore at critical point,2 2
4 0
eq
s r eq
eq R sin
V cos Q X
X δ
δ
− − =
i.e., Vs2sin2
(
δ θ−)
=4Q Xr eq sin2θ where, tanθ=Xeq ReqWith the assumption Req〈〈Xeq we finally get from the above,
Vs2sin2
(
δ θ−)
=4Q Xr eq∴
(
)
2 2
4
1 r eq
s Q X FSVSI
V sin δ θ
= =
−
(16)
At critical loading, the value of FSVSI should be 1 and at normal loading condition the value of FSVSI should be less than 1. Therefore FSVSI is an index to assess the level of voltage stability of the multi-bus system as a whole.
2.1.4 System Transmission Quality Factor (STQF) Eliminating δ from equations (13a) and (13b), we have
(
) (
2)
2 2 2 2
s r r r eq r eq r eq r eq
V V =V + P R +Q X + P X −Q R
With the assumption, Req=0 as in equation (15), above equation reduces to
(
)
4 2 2 2 2 2
2 0
r r r eq s r r eq
V +V Q X −V + P +Q X =
At critical point of voltage stability, we then have
(
)
2
2 2 2 2
2Q Xr eq Vs 4 Pr Qr Xeq 0
− − + =
i.e., STQF=4XeqQr+Pr2 Vs2 Vs2=1
(17)
From equation (17) it is clear that as the power demand increases STQFapproaches 1 as there will be no possible value of δ in equivalent network for safe power transmission. Actually STQF reflects total transmission quality of the interconnected power system.
2.2 FACTS Controllers 2.2.1 TCSC
Figure 2 shows a schematic representation of a TCSC, which consists of a series capacitor in parallel with a Thyristor Controlled Reactor (TCR) and connected in a transmission line between bus n and m of a power system. The equivalent reactance of TCSC being a function of the firing angle α of the TCR and can represented by the following equation [5],
(
)
(
(
)
)
{
}
2(
)
{
(
(
)
)
(
)
}
1 2 sin 2 2cos tan tan
TCSC C
where C1=
(
XC+XLC)
π; C2=4XLC2(
πXL)
; ω ω ω ω= 0 ; 0 =1 LC; and XLC =X XC L(
XC−XL)
; ω=2πf and 900≤ ≤α 1800The impedance of the transmission line between buses n and m with TCSC thus is modified as, Znm=RLINE+ j X
(
LINE+XTCSC)
. The corresponding elements of [YBus] matrix between buses n and m are modified to include new values of Znm to include the effect of the TCSC. The TCSC’s firing angle α is considered as a system variable to implement it in Newton-Raphson load flow program and at the end of the ith iteration, the variable firing angle α is updated as, αi+1 = αi + ∆αi. The elements of the admittance matrix are modified accordingly for the new value of XTCSC which depends upon the firing angle α. If α is withinlimits (900≤α≤ 1800), the specified active power flow is attained. However, if αgoes beyond limits, it is fixed at the violated limit and the active power flow through the line is uncontrolled and determined by the fixed reactance of the TCSC.2.2.2 STATCOM
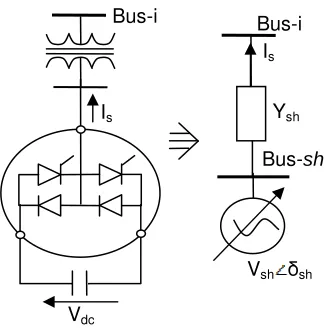
Figure 3 shows a schematic representation of a STATCOM connected with i-th bus of a power system and it consists of a coupling transformer, a converter and a DC capacitor. STATCOM regulates the terminal voltage by changing the reactive power injected or absorbed by it. In order to implement the STATCOM in Newton Raphson power flow equation, a separate bus i.e., a controllable voltage source with controllable voltage magnitude and angle (Vsh δsh) is assumed to be connected to the bus of the power network via an impedance due to the coupling transformer Zsh=Rsh + jXsh, where Vsh is proportional to Vdc (capacitor voltage) of the STATCOM [7]. The bus of the power network to which the STATCOM is connected is modelled as a specially controlled PV bus where the active and reactive power injections and the voltage magnitude are specified, while the voltage phase angle of ac system bus, control angle and ac voltage of STATCOM are treated as state variables in the linerised power flow equation. The performance of STATCOM depends upon the ac current injection (Is) from STATCOM to system bus-i. If the ac current Is is not within the specified limits, then Is will be kept fixed at the respective limits in the modified power flow equation
3. Algorithm of the proposed method
An algorithm for system simulation is given below:
1. Solve Newton-Raphson load flow for base case load and determine the weakest bus of the given multi-bus system.
2. Make necessary changes in the admittance matrix and Jacobian for incorporating TCSC or STATCOM.
Is
Ysh Is
Bus-i
Vsh δsh
[image:6.595.319.482.136.300.2]Vdc
Figure 3. STATCOM connected to the power system bus via a step down
transformer Bus-i
Bus-sh Bus-n
XTCSC RLINE+ j XLINE
Bus-m XC
ILOOP
XL
[image:6.595.87.286.153.251.2]3. Solve load flow problem to obtain the system states. Go to step 7 if the load flow iterative process does not converge.
4. Calculate the total generation, load and transmission line loss of the system. Then calculate equivalent resistance (Req) and reactance (Xeq) for the two-bus equivalent model and using them finally calculate DSVSI, FSVSI and STQF to assess overall system voltage stability. 5. Calculate L-index and DVSI of the weakest bus to assess local voltage stability.
6. Increase the load of weakest bus by a small step at a constant power factor and go to step-2.
7. Stop.
The developed concept has been applied to a practical 203 bus India Eastern Grid (WBSEB system) using a computer software developed in MATLAB including TCSC and STATCOM model in load flow computation. The WBSEB system has 24 generators, 35 three-winding transformers, 37 two three-winding transformers and 108 load buses which are interconnected by 267 transmission lines. The STATCOM has been assumed to be installed at the weakest bus of the system. It should be noted here that only one FACTS controller has been considered at a time for simulation. Reactive power sensitivity analysis [3] reveals that bus no. 172 is the weakest bus of the WBSEB system. It is found that there is only one transmission line connected to the weakest bus (bus no. 172) of system. Therefore two other transmission lines i.e., line 12 and 13 have been selected here to examine the performance of TCSC.
4. Results and Analysis
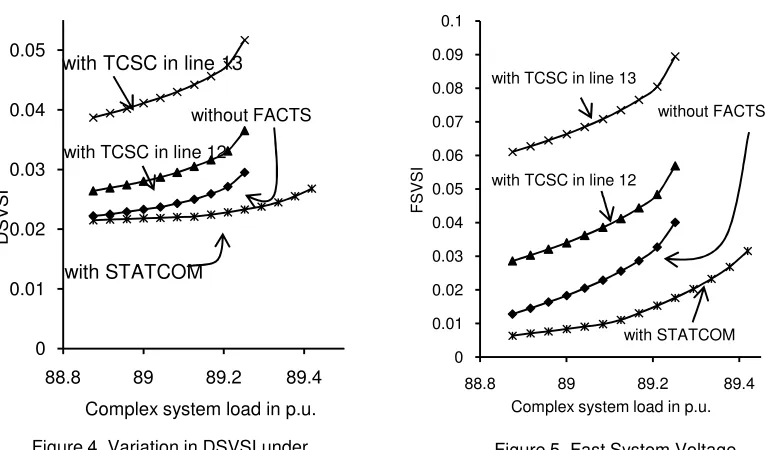
Figure 4 exhibits the profiles for Direct System Voltage Stability Index (DSVSI) under different operating condition. It has been observed that system crawls towards voltage instability with enhancement in system load and STATCOM is able to maintain the system voltage stability in a better way than TCSC. It is observed from Figure 5 that FSVSI provide in-depth information about the system voltage stability status and STATCOM is the best FACTS controller to ensure voltage stability of the system. The variation in FSVSI is more noticeable than DSVSI and thus use of FSVSI is more fruitful than DSVSI.
The profile of Direct Voltage Stability Indicator (DVSI) for weakest bus has been shown in Figure 6. It has been observed the system approaches towards voltage instability with increase in load as well as it is clear STATCOM improve system voltage stability along with better load catering capability. It is also clear from Figs. 5 and 6 that voltage stability status can
0 0.01 0.02 0.03 0.04 0.05
88.8 89 89.2 89.4
D
S
V
S
I
[image:7.595.101.485.439.664.2]Complex system load in p.u.
Figure 4. Variation in DSVSI under different operating condition
without FACTS
with TCSC in line 12 with TCSC in line 13
with STATCOM
0 0.01 0.02 0.03 0.04 0.05 0.06 0.07 0.08 0.09 0.1
88.8 89 89.2 89.4
F
S
V
S
I
Complex system load in p.u.
Figure 5. Fast System Voltage Security Index (FSVSI) of the system
with TCSC in line 12 with TCSC in line 13
[image:7.595.307.485.445.645.2]be asses in more clear way with the help of two bus network equivalents of the multi-bus power system.
The power ansmission quality of the system for different operating condition has been depicted by STQF in Figure 7. It is observed that power transmission quality deteriorates as the system get stressed i.e., the system approaches it voltage stability limit. It has been observed that TCSC in line 12 provides better transmission quality than TCSC in line 13. STATCOM ensure best quality of power transmission to maintain voltage stability.
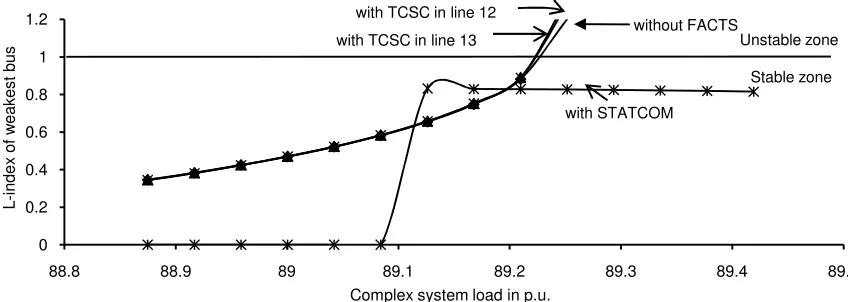
The proposed methodology has been verified by well known L-index of weakest bus as shown in Figure 8. It has been observed here that STATCOM can maintain L-index as zero by maintaining rated voltage at the weakest load bus which ensures best voltage stability.
5. Conclusion
Application of network equivalent of multi-bus power system has been found to be very helpful for direct assessment of voltage stability. Direct System Voltage Stability Index (DSVSI) and Fast System Voltage Stability Index (FSVSI) both provide the overall system voltage stability status at a glance. FSVSI is found to be more suitable for fast assessment of voltage stability as it provides more distinct information for different operating condition. The quality of power transmission can be directly assessed using System Transmission Quality factor (STQF) which directly reflects the stress on transmission lines of the system in terms of voltage stability. Thus present study may be helpful to
0 0.1 0.2 0.3 0.4 0.5 0.6 0.7 0.8
88.7 88.9 89.1 89.3 89.5
D V S I o f w e a k e s t b u s
Complex system load in p.u.
Figure 6. Direct voltage stability index (DVSI) of weakest bus
without FACTS
with TCSC in line 12
with STATCOM with TCSC in line 13
0 0.01 0.02 0.03 0.04 0.05 0.06 0.07 0.08 0.09 0.1
88.8 89 89.2 89.4
S
T
Q
F
[image:8.595.99.478.188.378.2]Complex system load in p.u.
Figure 7. System Transmission Quality Factor (STQF)
with TCSC in line 12 with TCSC in line 13
without FACTS with STATCOM 0 0.2 0.4 0.6 0.8 1 1.2
88.8 88.9 89 89.1 89.2 89.3 89.4 89.5
L -i n d e x o f w e a k e s t b u s
[image:8.595.89.513.481.632.2]Complex system load in p.u.
Figure 8. Variation in L-index of weakset bus under different operating condition Unstable zone
Stable zone with TCSC in line 12
with TCSC in line 13
obtain a quick overview regarding voltage stability status of a multi-bus power network on on-line basis as the proposed network equivalent can easily be derived from the oad centre database.
References
[1] Morison GK, Gao B, Kundur P. Voltage Stability Analysis using Static and Dynamic Approaches. IEEE Transactions on Power Systems. August’1993; PWRS-8(3).
[2] Ferdinando H, Pasila F, Kuswanto H, Paul S. Enhanced Neuro-Fuzzy Architecture for Electrical Load Forecasting, TELKOMNIKA Indonesian Journal of Electrical Engineering, 2010; 8 (2): 87-96.
[3] Yome A, Mithulananthan N, Le KY. A Maximum Loading Margin Method for Static Voltage Stability in Power Systems. IEEE Transactions on Power Systems. February 2006; 21(2): 799-808.
[4] Sauer PW, Pai MA. Power System Steady State Stability and the Load Flow Jacobian. IEEE Transactions on Power Systems. 1990; 5(4): 1374-1383.
[5] Dey S, Chanda C K, Chakrabarti A. Development of A Global Voltage Security Indicator (VSI) and Role of SVC on It Longitudinal Power Supply (LPS) System. Electric Power System Research. 2003; 68(1): 1-9.
[6] Hamada MM, Wahab MAA, Hemdan NGA. Simple and Efficient Method for Steady-State Voltage Stability Assessment of Radial Distribution Systems. Electric Power Systems Research. 2010; 80(2): 152–160.
[7] Nagendra P, Datta T, Halder S, Paul S. Power System Voltage Stability Assessment Using Network Equivalents - A Review, Journal of Applied Sciences. 2010; 10(18): 2147-2153.
[8] Sen S, Roy P, Chakrabarti A, Sengupta S. Generator Contribution Based Congestion Management using Multiobjective Genetic Algorithm. TELKOMNIKA Indonesian Journal of Electrical Engineering. 2011; 9(1): 1-8.
[9] Chanda CK, Dey S, Chakrabarti A, Mukhopadhyay AK. Determination of Bus Security Governed by Sensitivity Indicator in A Reactive Power Constraint Longitudinal Power Supply (LPS) System. Indian Journal of Engineering and Materials Science. 2002; 9(4): 260-264.
[10] Fuerte-Esquivel CR, Acha E, Ambriz-PBrez H. A Thyristor Controlled Series Compensator Model for the Power Flow Solution of Practical Power Networks. IEEE Transactions on Power Systems. February’ 2000; 15(1): 58-64.
[11] Zhang Y, Zhang Y, Wu B, Zhou J. Power Injection Model of Statcom With Control and Operating Limit for Power Flow and Voltage Stability Analysis. Electric Power Systems Research. 2006; 76(12): 1003–1010.