CHAPTER II
THEORETICAL BACKGROUND
2.1 Theoretical Background
Corporate failure is situation when company faced crisis in terms of financial and do not take proper actions that can avoid bankruptcy.
According to (Bryan, 2012), financial distress in firms that lead to bankruptcy is generally evident long before the event. Based on that study,
Author believes that predicting bankruptcy is necessary to investigate.
2.1.1 Financial Distress
Financial distress is a situation where a firm’s operating cash
flows are not sufficient to satisfy current obligations (such as trade credits or interest expenses), and the firm is forced to take corrective
action. According to Platt and Platt (2012), financial distress may lead a firm to default on a contract, and it may involve financial restructuring between the firm, its creditors, and its equity investors.
Usually the firm is forced to take actions that it would not have taken if it had sufficient cash flow.
a. Asset Expansion Policies
When company faced difficulty in terms of financial, usually the
managers of the firm try to take some actions to reduce that risk. One of the actions is increasing the size of its business or familiar with the asset expansion policy. Asset expansion policy
is policy that make by the managers of the firm to reduce the risk that company faced. Asset expansion policies include the
full of acquisition of another firm, a partial acquisition, setting up a new joint venture, increasing capital expenditure, higher levels of production, or expansion of existing facilities.
b. Operational Contraction Policies
Contraction is the opposite of expansion which means the
company which faced difficulty tries to keep and maintain its business by itself. Firm managers will focus on the most profitable business during a downturn situation.
c. External Control Activity
External control activity is the situation when the company has been taken over or the major business of the company is
handling by outside investors. d. Changes in Managerial Control
Changes in managerial control means the company changes their high staff position (Chairman, Chief Executive, Directors,
e. Wind up Company
The last and final strategy is to wind up its operations and go
2.1.2 Bankruptcy
a. Definition of Bankruptcy
Financial distress may or may not lead into Bankruptcy. A firm is in financial distress when it is having trouble paying its debts as they come due. On the other hand, a firm is bankrupt when it
has filed a petition for relief from its creditors under the bankruptcy codes, or when it has consented to a filing by its
creditors (Chang, 2000). In Indonesia, Indonesia Bankruptcy system regulated by Undang Undang Republic Indonesia No. 37 Tahun 2004 Tentang Kepailitan dan Penundaan Kewajiban
Pembayaran Utang. (BPKP, 2004). According to the UU No. 37 Year 2004 Bankruptcy process is performed in the Commercial
b. Sources of Bankruptcy
Sources: Emery & Finnerty (1977)
1. External Factors 1.1Market Condition
Market condition is related with business cycle. Usually
customers want something that in the trend situation, they do not want to buy something that out of trend. For
example, recently people more likely to bring their phone to take pictures rather than bring camera, this situation lead companies that produce camera faced difficult
situation. If they do not make an innovation immediately, the decreasing amount of sales may lead the company
into bankruptcy. 1.2Intense Competition
In this tight competition directly forced the companies to
be more creative and innovative, especially for the small companies which don’t have strong financial condition yet. Usually, this competition is focus on the price and
1.3Other causes
Bankruptcy can result from a host of other underlying
problems that inhibit profitability. Some other factors that can contribute to bankruptcy include poor business location, loss of key employees, lawsuits raised by
competitors and personal issues like illness or divorce. Unforeseen disasters and criminal activities like floods,
storms, theft, and fraud can also cause hardships that lead to bankruptcy.
2. Internal Factors
2.1Poor Management
According to Dun & Bradstreet survey, 94 percent of
business failure was caused by lack of management experience, unbalanced experience, or outright managerial incompetence. For the additional information,
based on the book of RE-CODE YOUR CHANGE DNA by Rhenald Kasali (2007), the author motivates managers in the companies to change if they want to improve the
condition of their companies to avoid bankruptcy. 2.2Unwise Expansion
This situation happened when the company only focus to expand the company without consider other negative
bad; expansion is good and profitable if the company consider all possibilities wisely.
2.3Too Much Debt
When company faced too much debt, it makes the amount of interest payment also huge and decrease the
profit which company can get. If the company has higher debt than profit (negative profit) it makes company
difficult to pay other obligations and lead it into bankruptcy.
In this study, author only focus on the internal sources of
bankruptcy which is related to the financial statement. c. How to detect bankruptcy?
One indicator to consider that company will faced bankruptcy is financial distress. Financial distress is the situation when the company faced difficulty in terms of financial which
means the company difficult to meets its obligation. Company which faced financial distress does not faced bankruptcy yet but if the company does not take any proper strategies to handle its
condition, it will lead into bankruptcy.
Company which has good financial condition has small
probability to faced financial distress which lead into bankruptcy. In other word, the author concludes that the better
good or bad financial condition in its financial statement. Financial Statements represent a formal record of the financial
activities of an entity. These are written reports that quantify the financial strength, performance and liquidity of a company. Financial Statements reflect the financial effects of business
transactions and events on the entity (Ammar Ali, 2010).
2.1.3 Financial Ratios
One of the measurements to detect financial distress is the calculation of financial ratio from the data in the financial statement of the company. Financial ratio simplifies the process of determining
the health of a listed company and make reported financial information more meaningful and useful for investors. Financial
a. Financial Ratio Classification
According to Australian Shareholders’ Association, there are top
15 financial ratios which are classifying four groups: Sources: (ASA, 2010)
1) Liquidity Ratio
Liquidity Ratio indicate whether a company has the ability to pay off short-term debt obligations (debts due to be paid
within one year) or not. Generally, higher value indicates that the company ability to pay off its debt obligation is greater. Liquidity Ratios include:
a) Current Ratio
Current ratio measures a company’s ability to repay
short-term liabilities such as account payable and current debt using short-term assets such as cash, inventory, and receivables. In the table below, there is a formula to
calculate current ratio. If the result is less than one means that the company may not have sufficient resources to pay its short-term debt obligations on the due date.
b) Profit Before Depreciation and Amortization to Current Liabilities (PDACL)
Profit before depreciation and amortization to current liabilities is defined as net operating profit before tax plus non-cash charges in relation to short-term debt
obligations. This is a powerful ratio because it shows a company’s margin of safety to meet short-term
commitments using cash flow generated from trading operations.
c) Operating Cash Flow to Current Liabilities (OCFCL) Operating Cash Flow to Current Liabilities is related to
cash generated from the operations of a company (revenues less all operating expenses plus depreciation) in relation to short-term debt obligations. Operating cash flow is a more accurate measure of a company’s
profitability than net income because it only deducts
actual cash expenses and therefore demonstrates the strength of a company’s operations. In the table below,
there is a formula to calculate OCFCL. The higher the
sufficient cash from its operations to cover short-term liabilities.
d) Cash Balance to Total Liabilities (CBTL)
Cash Balance to Total Liabilities shows a company’s cash balance in relation to its total liabilities. Cash
indicates assets in the business. A negative cash balance increases a negative signal to the company. In the table
below, there is a formula to calculate CBTL. Based on the calculation, the higher value of CBTL means that company has lower risk because the company has more
cash that can be used to pay suppliers, banks, or any other party that has provided the company with a product
or service.
2) Leverage Ratios
Leverage ratio provides an indication of a company’s long
-term solvency. Leverage ratio used to de-termine about the companies’ financing methods, or the ability to meet the
obligations. There are many ratios to calculate leverage but
the important factors include debt, interest expenses, equity and assets (Ratios, 2011)
e) Debt to Equity Ratio (DE RATIO)
The debt to equity ratio provides an indication of a company’s capital structure and whether the company
Is more reliant on borrowings (debt) or shareholder capital (equity) to fund assets and activities. Debt is not
necessary a bad thing. Debt can be positive, such as for purchasing assets and providing processes to increase net profits. In the table below, there is a formula that can be
used to calculate DE Ratio. The higher the DE Ratio the higher the risk.
f) Total Liabilities to Total Tangible Assets (TLTAI)
Total Liabilities to Total Tangible Assets provides the relationship between a company’s liabilities and tangible
considers only tangible assets that can be easily valued and liquidated to cover liabilities. Table below shows the
formula to calculate TLTAI. The higher the value of TLTAI ratio, the higher the level of risk.
g) Interest Cover Ratio
Interest Cover Ratio measures company’s ability to meet
interest expenses on debt using profits. Table below shows the formula to calculate Interest Cover. When the
result is greater than two means the company has healthy position to cover interest.
3) Profitability Ratio
Most studies said that companies with low profitability are
likely to become less liquid (Morris, 1997). Profitability ratios measure a company’s performance and provide
indication of its ability to generate profits. As profits are used
to fund business development and pay dividends to shareholders, a company’s profitabitility and how efficient it
h) Earnings Per Share (EPS)
Earnings per Share ratio used to measure earnings in
relation to every share on issue. This ratio is important because it is indicates how much each share that you own has earned or will earn. In the table below, there is a
formula that can be used to calculate EPS.
i) Gross Profit Margin
Gross Profit Margin tells us what percentage of a company’s sales revenue that company can get (after
decrease by the cost of goods sold). This information is
important because we can know whether the company has enough funds to cover operating expenses (such as employees’ salary, lease payments, advertising, etc) or
not. Table below shows a formula that can be used to calculate Gross profit margin. Company which has
higher gross profit margin than its industry or competitors can classify as efficient company in terms of
productivity.
j) Net Profit Margin
Net Profit Margin indicates what percentage of a company’s sales revenue that company can get after
deduct with all costs. Table below shoes the formula that can be used to calculate the Net profit margin. If the
result of net profit margin is decline, it may indicate there is an increasing costs or competitions.
k) Return on Assets (ROA)
Return on Assets is used to measure the performance of the management in the company. ROA tells the investor how well a company uses its assets to generate income.
Table below shows the formula that can be used to calculate ROA. A higher ROA indicates higher level of management performance.
[image:15.595.83.509.206.748.2]l) Return on Equity (ROE)
Return on Equity also used to measure the performance
of management in the company. ROE tells the investor how well a company has used the capital from its shareholders to generate profit. Table below shows a
formula to calculate ROE. A higher ROE indicates a higher level of management performance.
4) Valuation Ratios
Valuation ratios are used as an indicator whether the current
share price of the company is high or low in relation to its true value. Valuation ratios also help investors to know whether the company is good or bad in terms of earnings,
growth prospects and dividend distributions. m) Price to Earnings Ratio (PE)
The price to earnings ratio (PE) shows the number of times the share price covers the earnings per share over a 12 month period. It is measured by taking a company’s current share price and dividing this by earnings per share (EPS). PE may also be interpreted as how much an
ratio, PE Ratio cannot determine and classify by the number of the result. PE Ratio may be interpreted by
compare the result with industry PE or market PE.
n) Price/Earnings to Growth Ratio (PEG)
Price/Earnings to Growth Ratio are the continuation of
PE Ratio. If the company has higher PE than its industry average or when the company’s stock consider as a
growth stock, we have to calculate PEG ratio in order to
assess whether the premium price paid is justified given the current level of earnings growth. Table below shows
formula that can be used to calculate PEG. If the value of PEG is less than one, it indicates that the stock may be
undervalued and may have further potential for increasing share prices. But if the PEG is more than one implies the stock is overvalued at current prices.
o) Dividend Yield
The dividend yield is a calculation of the dividends paid over the last 12 months as a percentage of a company’s
current share price. This dividend yield ratio is expressed
determine whether the annual return is attractive to income seeking investors.
b. Relationship Between Financial Ratios to the Bankruptcy
(Conceptual Framework)
(1) Liquidity Ratio has negative relationship to Bankruptcy
According to ASA (2010), the higher value of liquidity ratio indicates that the company ability to pay off its debt obligation is greater. Based on that theory, Author makes a
conclusion that Liquidity ratio has negative relationship to bankruptcy because the higher the value of liquidity ratio, the
lower the probability of the company faced bankruptcy.
(2) Leverage/ solvency ratio has positive relationship to
Bankruptcy
According to ASA (2010), the higher the value of leverage ratio, the more debts than assets that company has. It means
that the more value of leverage ratio of the company the higher risk that company has. Based on that theory, Author concludes that the leverage or solvency ratio has positive
(3) Profitability ratio has negative relationship with
Bankruptcy
According to the theory of ASA (2010), Profitability ratios measure a company’s performance and provide indication of
its ability to generate profits. The higher the value of
profitability ratio, the higher the ability of the company to generate the profit. Based on that theory, Author concludes
that profitability ratio has negative relationship to the bankruptcy because the higher the value of profitability ratio the lower the probability that company to faced bankruptcy.
(4) Valuation ratio has negative relationship with
Bankruptcy
According to the ASA (2010), Valuation ratios are used as an indicator whether the current share price of the company is high or low in relation to its true value. Based on that
definition, Author concludes that company which has high value of valuation ratio is become more profitable to invest. Usually, company with high share price than its competitors
and industry average has a good performance. Author concludes that the higher the value of valuation ratios the
2.2 PREVIOUS RESEARCH
Since the failure prediction become important and untended topic
among researchers, a lot of researchers try to develop models that can predict failure accurately. Models for predicting corporate distress has shifted from traditional ratio analysis in the early 1930’s to single ratio developed from univariate studies to today’s multivariate predictive
models. Basically, models for predicting corporate failure using
financial ratios can be classified into two major sub-types; univariate analysis and multivariate models (Gilbert Mbanwie, Financial Rations as Bankruptcy Indicators; The case of Financial Distressed Firms in
Sweden, 2009).
Ika Yuanita (2009) is the researcher who try to identify empirical
evidence in the prediction of financial distress within textile and garment industries that listed by Indonesia Stock Exchange in 2005-2008 using logistic regression model. This study was used four ratios
(CA/CL, NI/Sales, CL/TA, and NI/TA) as independent variables and eight textile mill products and apparel and other textile products as sample. The results prove that all four independent variables have been
found to be significant and useful for corporate failure prediction in textile and garment industries in Indonesia. The overall predictive
accuracy is 75 percent and it shows that the logistic regression analysis is a reliable technique for financial distress prediction. (Yuanita,
Mbanwie and Edmond (2009) tried to predict financial distress using in Swedish using the cross sectional analysis. They used eight ratios
(current ratio, quick ratio, debt to equity ratio, gearing ratio, operating margin, return on capital employed, and day’s receivable outstanding and sales-total assets ratio) as independent variables and 179
companies as sample. The results prove that four independent variables (return on capital employed, operating margin, quick ratio,
and debt to equity ratio) have been found to be significant. (Gilbert Mbanwie, Financial Ratios as Bankruptcy Indicators: The case of
Financially Distressed Firms in Sweden, 2009).
Shuk-Wen Ong (2011) tried to develop a model that can predict financial distress amongst public listed companies in Malaysia using
the logistic regression analysis. Shuk-Wen Ong (2011) used eleven financial ratios (quick asset turnover, current asset turnover, asset turnover, days sales in receivable, sales to fixed assets, cash flow to
assets, cash flow to total debt, total liabilities to total assets, debt to equity, current ratio, and return on equity) as independent variables,
and 105 companies as sample. The results prove that five financial ratios (current asset turnover, asset turnover, day’s sales in receivables,
cash flow to total debt, and total liabilities to total assets) have been
found to be significant and useful for corporate failure prediction in Malaysia. The overall predictive accuracy is 91.5 percent and it shows
distress prediction. (Shuk-Wern Ong, A corporate failure prediction: a study of public listed companies in Malaysia, 2011)
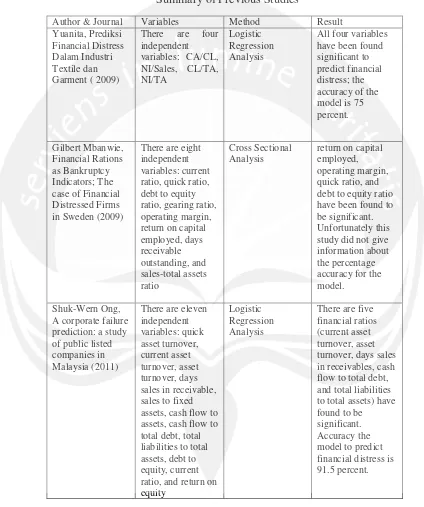
Table 1
Summary of Previous Studies
Author & Journal Variables Method Result
Yuanita, Prediksi Financial Distress Dalam Industri Textile dan Garment ( 2009)
There are four
independent variables: CA/CL, NI/Sales, CL/TA, NI/TA
Logistic Regression Analysis
All four variables have been found significant to predict financial distress; the accuracy of the model is 75 percent.
Gilbert Mbanwie, Financial Rations as Bankruptcy Indicators; The case of Financial Distressed Firms in Sweden (2009)
There are eight independent variables: current ratio, quick ratio, debt to equity ratio, gearing ratio, operating margin, return on capital employed, days receivable outstanding, and sales-total assets ratio Cross Sectional Analysis
return on capital employed, operating margin, quick ratio, and debt to equity ratio have been found to be significant. Unfortunately this study did not give information about the percentage accuracy for the model.
Shuk-Wern Ong, A corporate failure prediction: a study of public listed companies in Malaysia (2011)
There are eleven independent variables: quick asset turnover, current asset turnover, asset turnover, days sales in receivable, sales to fixed assets, cash flow to assets, cash flow to total debt, total liabilities to total assets, debt to equity, current ratio, and return on equity
Logistic Regression Analysis
Therefore, the objective of this paper is to develop a model that can predict failure amongst listed companies in the Jakarta Stock Exchange (IDX)
2.3 Hypotheses
In conducting research about failure prediction, Author is immediately
confronted with one hypothesis:
Logistic Regression Analysis can be used to predict financial distress amongst public listed companies in Indonesia Stock Exchange (IDX)