STANDARDS ON CANNED TUNA TRADE
KHAIRUNNISA NUR RAHMAH
GRADUATE SCHOOL
BOGOR AGRICULTURAL UNIVERSITY
BOGOR
STATEMENT OF THESIS, SOURCE OF INFORMATION
AND COPYRIGHT
I hereby declare that thesis titled Trade Flows Analysis and the Role of Standards on Canned Tuna Trade, was independently composed by me under the advisory committee supervision and has not been submitted to any other universities. Source of information derived or quoted from works published and unpublished from other writers have been mentioned in the text and listed in the references at the end of this thesis.
I hereby assign the copyright of my thesis to the Bogor Agricultural University.
Bogor, April 2016
SUMMARY
KHAIRUNNISA NUR RAHMAH. Trade Flows Analysis and the Role of Standards on Canned Tuna Trade. Supervised by ANDRIYONO KILAT ADHI, DWI RACHMINA and BERNHARD BRÜMMER.
Tuna is one of most important commodity traded in the world fish industry. International trade of tuna is mainly taking form in canned tuna. Like other traded goods, canned tuna trade can potentially be hindered by international trade rules. The presence of trade barriers can affect the trade flow of tuna by affecting its price and availability in specific regions. Trade barriers in tuna trade are including: tariff measures, non-tariff measures and different standards imposed across countries. This study analyzes trade flows and the role of standards on the international canned tuna trade from three largest exporters in Asia: Thailand, the Philippines and Indonesia. The study used annual export value of tuna from Thailand, the Philippines and Indonesia to 50 export destinations for 14 years, 2000 to 2013. In the data set, accounted 21 percent of the trade data were zero trade observations.
The gravity model with Ordinary Least Squares (OLS) and Poisson Pseudo Maximum Likelihood (PPML) estimation with fixed effect are utilized to determine factors affecting trade flows of canned tuna and whether standards act as barriers to canned tuna trade from Thailand, the Philippines and Indonesia. The regression results from both estimations then compared. Variables included in the model are canned tuna production from each exporters, Gross Domestic Product (GDP) of importing countries, remoteness, exchange rate, participation in free trade agreements (FTAs) and standards. Standards are captured by dummy variables which categorized on how strict export destination established its standards. Three standards were obtained: (1) if a country imposed national standards; (2) if a country established more restrictive standards; and (3) if a country required not only national standards but also specific certification.
As a result, based on the magnitude of the coefficient, the economic implications and the explanatory ability of the model, the PPML estimation provides a better approach to quantifying the changes in canned tuna trade flows. The regression result shows that factors that significantly affecting the canned tuna export are the canned tuna production, GDP of importing countries, exchange rate, participation in FTAs and standards. Canned tuna production, GDP of importing countries and participation in FTAs showed positive impact to canned tuna trade which imply that those variables enhance canned tuna trade. All standards variables have a negative and significant impact on canned tuna trade, which means the imposition of stricter standards hinder trade by reducing canned tuna export from Thailand, the Philippines and Indonesia. The imposition of standards by the foreign countries is likely to stricter due to growing concern of health and environmental awareness for better-off consumers. It implies that Thailand, the Philippines and Indonesia have to prepare to comply with this requirement by increasing its national standards to improve market access.
RINGKASAN
KHAIRUNNISA NUR RAHMAH. Analisis Aliran Perdagangan dan Peran Standar dalam Perdagangan Tuna Kaleng. Dibimbing oleh: ANDRIYONO KILAT ADHI, DWI RACHMINA dan BERNHARD BRÜMMER.
Tuna adalah salah satu komoditas utama yang diperdagangkan dalam industri perikanan dunia. Pada perdagangan internasional, umumnya tuna dipasarkan dalam bentuk kemasan kaleng. Seperti produk lain yang diperdagangkan di pasar dunia, aliran perdagangan tuna kaleng berpotensi terhambat oleh aturan perdagangan internasional. Hambatan yang ditemui dalam perdagangan tuna meliputi: penetapan tarif, hambatan non-tarif dan perbedaan standar yang dikenakan oleh negara-negara tujuan ekspor. Studi ini menganalisis aliran perdagangan dan peran standar pada perdagangan tuna kaleng dari tiga eksportir besar di Asia yaitu: Thailand, Filipina dan Indonesia. Data yang digunakan berupa nilai perdagangan tuna kaleng antara Thailand, Filipina dan Indonesia dengan 50 negara tujuan ekspor selama 14 tahun, yaitu dari tahun 2000 sampai dengan 2013. Ditemukan sebanyak 21 persen data tanpa perdagangan.
Metode analisis yang digunakan untuk mengetahui aliran perdagangan dan peran standar dalam perdagangan tuna kaleng dari Thailand, Filipina dan Indonesia, yaitu model gravitasi melalui pendekatan metode kuadrat terkecil dan Poisson Pseudo Maximum Likelihood (PPML), dengan menggunakan efek tetap. Kedua pendekatan kemudian dibandingkan untuk diteliti lebih lanjut. Variabel yang digunakan dalam model diantaranya produksi tuna kaleng, pendapatan domestic bruto (PDB), jarak, nilai tukar, partisipasi dalam kesepakatan perdagangan dan standar. Standar ditangkap dengan variabel dummy yang dikategorikan berdasarkan keketatan penetapan standar dalam negara tujuan. Terdapat tiga kategori standar, dimana: (1) jika negara menerapkan standar nasional; (2) jika negara menerapkan standar yang lebih kompleks; dan (3) jika negara tidak hanya menerapkan standar nasional tapi juga menyertakan sertifikasi khusus sebagai suatu persyaratan untuk memasuki negara tersebut.
Berdasarkan besarnya koefisien, implikasi ekonomi dan kemampuan penjelas dari model, hasil analisis model gravitasi menggunakan estimasi PPML memberikan pendekatan yang lebih baik untuk mengetahui perubahan dalam aliran perdagangan tuna kaleng. Hasil regresi menunjukkan faktor yang mempengaruhi perdagangan ekspor tuna kaleng adalah produksi tuna kaleng, PDB negara tujuan ekspor, nilai tukar dan partisipasi dalam perjanjian perdagangan bebas. Produksi tuna kaleng, PDB negara tujuan ekspor dan pasrtisipasi dalam kesepakatan perdagangan menunjukkan koefisien estimasi positif. Semua variabel standar memiliki dampak negatif dan signifikan terhadap ekspor tuna kaleng dari Thailand, Filipina dan Indonesia. Artinya, penerapan standar keamanan pangan bertindak sebagai hambatan dalam perdagangan tuna kaleng. Menghadapi semakin rumitnya standar pangan yang diterapkan negara-negara importer, Thailand, Filipina dan Indonesia diharapkan dapat meningkatkan standar nasional sehingga memudahkan dalam mengakses pasar.
© All Rights Reserved by Bogor Agricultural University, 2016
Copyright Reserved
It is prohibited to quote part or all of this paper without including or citing the source. Quotations are only for purposes of education, research, scientific writing, preparation of reports, critics, or review an issue; and those are not detrimental to the interest of the Bogor Agricultural University.
TRADE FLOWS ANALYSIS AND THE ROLE OF
STANDARDS ON CANNED TUNA TRADE
KHAIRUNNISA NUR RAHMAH
Master Thesis
as one of requirements to obtain a degree of Master Science
in
an Agribusiness Study Program
GRADUATE SCHOOL
BOGOR AGRICULTURAL UNIVERSITY
BOGOR
External Examiners Commission : Dr Ir Suharno, M.Adev
ACKNOWLEDGMENT
All praise is due to Allah, the lords of the world, the beneficent, the merciful, for his blessing on everything in my life. This research would have been impossible without the support from many people. I would like to appreciate everyone who encouraged me.
I would like to express my gratitude to the supervisory committee, Dr. Ir. Andriyono Kilat Adhi who supports me academically in thesis writing from the beginning until the last step. It is a pleasure to acknowledge the support and help from my second supervisor Dr. Ir. Dwi Rachmina, MSi. I am grateful to the examiner of this thesis, Dr. Ir. Suharno, M.Adev for his critiques and advices which richen this study. I would like to to express gratitude to the Head of Agribusiness Study Program, Bogor Agricultural University, Prof. Dr. Ir. Rita Nurmalina, MS for her advices. I would also like to thank my supervisors from Georg-August Göttingen University Germany, Prof. Dr. Bernhard Brümmer and Prof. Dr. Stephan von Cramon Taubadel for their support and assistance in this research. I am grateful to the Faculty of Agricultural Sciences of the Georg-August Göttingen University, especially Frau Thinggaard for all support. I would like to express my gratitude to the Indonesia-Germany Joint Degree Scholarship program from Beasiswa Pendidikan Pascasarjana Luar Negeri (BPPLN) Directorate General of Higher Education and Beasiswa Unggulan - Biro Perencanaan dan Kerjasama Luar Negeri, the Ministry of National Education Republic of Indonesia for funding my study.
I am also grateful to my beloved family: my husband, my lovely parents, my dearest sister and my grandparents, who always encourage, support and love me unconditionally. To them I dedicated this thesis.
Last but not least, I would like to thank all friends and new family I met both in Bogor and in Göttingen. My special thanks go to The Intan, Dhea, Maika, Irfan, Mbak Wida, Rizah, Asih, Liza, Afni and everybody else who help and support me throughout my master study.
Bogor, April 2016
CONTENTS
CONTENTS viii
LIST OF TABLES x
LIST OF FIGURES x
LIST OF APPENDICES x
LIST OF ABBREVIATIONS xi
1 INTRODUCTION 1
Background 1
Problem Statement 3
Research Objectives 4
Benefits of the Study 4
Scope and Limitation of the study 4
2 LITERATURE REVIEW 4
Gravity Model Approach in Trade Flow Analysis 5
Variables Construct Gravity Model 5
Definition of Standards and Motivation for Developing Standards 7
Food Safety Standards and Seafood Trade 8
3 FRAMEWORK 9
The International Trade Theories 9
Barriers on Trade 11
Trade Flow Analysis Using Gravity Model Approach 13
The Exchange Rate and Trade 15
Operational Framework 16
4 RESEARCH METHODOLOGY 17
Types and Sources of Data 17
Panel Data Analysis Using Gravity Model 18
Ordinary Least Square (OLS) 18
Poisson Pseudo Maximum Likelihood Estimation 20
Model Formulation of Canned Tuna Trade 20
Hypotheses Testing and Goodness of Fit 21
5 GENERAL OVERVIEW OF CANNED TUNA INDUSTRY 22
Description and History of Canned Tuna 23
Development of Canned Tuna Industry in Thailand, the Philippines and
Indonesia 24
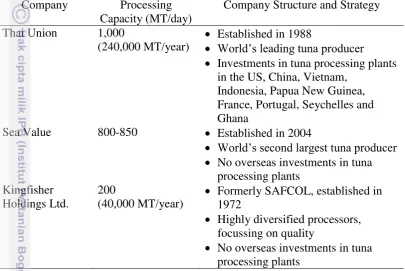
Thailand 24
The Philippines 26
Indonesia 27
6 RESULTS 28
Trade Flows of Canned Tuna 29
Standards on Fish and Fishery Trade 30
Factors Affecting Trade Flows of Canned Tuna 33
Comparison of OLS and PPML Result 36
7 CONCLUSIONS AND RECOMENDATIONS 43
Conclusions 43
Recommendations 43
REFERENCES 45
APPENDICES 51
x
LIST OF TABLES
1 Data Sources 18
2 The Dummy Categories of Standards 19
3 Overview of Major Tuna Processors in Thailand, 2010 25
4 Overview of Major Tuna Processors in the Philippines, 2010 26
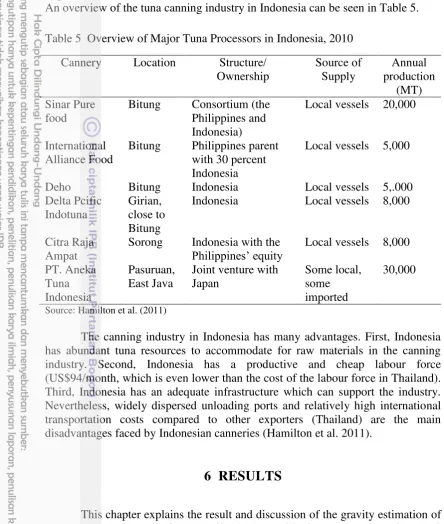
5 Overview of Major Tuna Processors in Indonesia, 2010 28
6 List of Standards Imposed by Importing Countries 31
7 Summary and Descriptive Statistics 33
8 OLS and PPML Estimation Results 37
9 The Change in Canned Tuna Exports due to Establishment of Standards and
FTAs 41
LIST OF FIGURES
1 Fish and fishery export by region, 2000-2011 1
2 Canned tuna exports by region, 2011 2
3 Canned tuna exports by Asian countries in thousand MT, 1976-2011 2
4 International trade 10
5 The economic effect of trade barriers 12
6 The impact of exporter currency appreciation on trade 15
7 Operational framework 16
8 Worldwide catches of commercial tuna, 1950-2012 22
9 Thailand, the Philippines and Indonesia canned tuna production, 1976-2011 24 10 Thailand, the Philippines and Indonesia canned tuna export performance
by value, 1996-2013 29
11 World canned tuna importers by value, 2012 29
12 Canned tuna importers for each exporter by value, 2012 30 13 The export value (US$) of Thailand, the Philippines and Indonesia canned
tuna, 2000-2013 34
14 The tuna production (MT) of Thailand, the Philippines and Indonesia,
2000-2013 35
15 The exchange rate of Thailand, the Philippines and Indonesia in US$,
2000-2013 35
16 The development of standards imposed by importing countries, 2000-2013 36 17 The average export value (Million US$) and production (thousand MT) of
Thailand, the Philippines and Indonesia canned tuna, 2000-2013 39
18 GDP of main export destination countries, 2000-2013 40
LIST OF APPENDICES
1 List of Exporting and Importing Countries 51
2 Hausman test result 51
LIST OF ABBREVIATIONS
ARIC : the Asia Regional Integration Center
AvW : Anderson and van Wincoop
CAC : the Codex Alimentarius Commission
CFIA : the Canadian Food Inspection Agency
CEPII : the Centre d'Études Prospectives et d'Informations Internationales
CES : Constant Elasticity Substitution
EC : European Commission
EEZ : Economic Exclusive Zone
EU : The European Union
FAO : Food and Agriculture Organization
FDA : Food and Drug Administration
FEM : Fixed Effect Model
FMA : Fishery Management Area
FTA : Free Trade Agreement
GDP : Gross Domestic Product
HACCP : Hazard Analysis of Critical Control Point
HO : Heckscher-Olin
HS : Harmonized System
IUU : Illegal, Unreported and Unregulated MMAF : Ministry of Marine Affairs and Fisheries
MRL : Maximum Residual Limit
MT : Metrics Ton
NTT : New Trade Theory
OECD : Organization of Economic Cooperation and Development
OLS : Ordinary Least Squared
PPML : Poisson Pseudo Maximum Likelihood
REM : Random Effect Model
SEAFDEC : the Southeast Asian Fisheries Development Center
SPS : Sanitary and Phytosanitary
TBT : Technical Barriers to Trade
UNCOMTRADE : the United Nations Commodity and Trade
US : The United States
USDA : the United States Department of Agriculture
WCPO : Western and Central Pacific Ocean
1 INTRODUCTION
Background
Fish and fishery products have long been traded internationally. Over the last several decades, trade in the fish industry products has grown tremendously by 121 percent worldwide, with export values increasing from US$58.2 billion in 2002 to US$129.1 billion in 2012. Asia, among other regions, has had a significant role in fish and fishery trade by contributing US$50 billion, or 39 percent, to the total export in value in 2011 alone (Figure 1). The fisheries sector
has also provided substantial employment opportunities to the world’s population. By 2012, 10 to 12 percent of people’s livelihoods depended on this sector
globally, with 84 percent of people in Asia being employed within the sector (FAO 2012).
Figure 1 Fish and fishery export by region, 2000-2011
Source: Author’s elaboration with data from FAO FishstatJ (2015)
Tuna is the third of most important commodity traded in the fish industry. Tuna trade reached US$ 6.2 billion and accounted for 8.7 percent of the total value of the fish trade in 2004. Tuna consumption is popular worldwide because it is relatively low in calories, low in fat, high in protein and high in Omega-3. Moreover, tuna has also been marketed as a canned product, which not only offers its standard advantages, but is also convenient for being added to other foods for an increased usefulness. In 2005, nearly 82 percent of the world tuna supply was consumed as a canned product rather than fresh (Gilman 2009). Thus, a high demand for canned tuna encourages tuna producing countries to produce tuna as a canned variety.
2
million MT, or 45 percent of total canned tuna traded globally; a figure which is almost 4 times larger than any other exporters. Meanwhile, the Philippines and Indonesia contributed 8 percent and 6 percent in net weight, respectively.
Figure 2 Canned tuna exports by region, 2011
Source: Author’s elaboration with data from FAO FishstatJ (2015)
The time trend in exports (Figure 3) reveals that Thailand, the Philippines and Indonesia experienced a rapid growth in exporting canned tuna from the
beginning of 1980’s to 2000. The average growth rate of canned tuna exports during this period was highest in Indonesia at roughly 29.8 percent, followed by Thailand (21.9 percent) and the Philippines (14 percent). According to the United Nations Commodity Trade Statistics Database (2013), canned tuna from Thailand, the Philippines and Indonesia was dispersed globally with more than 100 countries listed as export destinations.
Figure 3 Canned tuna exports by Asian countries in thousand MT, 1976-2011
Source: Author’s elaboration with data from FAO FishstatJ (2015)
Indonesia Philippines China Viaetnam Others
Problem Statement
The canned tuna trade, however, can potentially be hindered by international trade rules. The presence of trade barriers can affect the trade flow of tuna by affecting its price and availability in specific regions. Several trade barriers in the fish trade are addressed by the Organization of Economic Cooperation and Development (OECD) Committee on Fisheries, primary topics include: tariff measures, non-tariff measures (quota restriction, anti-dumping policies), government financial transfers and different standards imposed across countries (Hannesson 2001).
Ensuring that different standards requirements met in the target market are becoming the main challenge for exporting fish and fishery products in the last decades (Ababouchi et al 2005). The World Trade Organization (WTO) through the Agreement on the Application of Sanitary and Phytosanitary Measures (SPS) and the Agreement on Technical Barriers to Trade (TBT), have given more concise guidance with respect to international trade. The aim of these agreements is to restrict the use of standard requirements that are stipulated in globally traded goods as non-tariff barriers (Grote and Kirchhoff 2001; Bostock et al 2004). To avoid the use of standards as a non-tariff barrier, the WTO has suggested defined international standards such as The Codex Alimentarius as a global reference. Nevertheless, the WTO allows its members to impose their own standards as a precautionary policy, as long as they are based on scientific evidence, limit trade restrictions and are not discriminatory. There are various reasons behind an
importing country’s imposition of food safety and quality requirements, including
the development of technology in the food industry, growing consumer awareness, and an increased demand for safe, high quality and sustainable foods (Ababouchi et al 2005).
In the canned tuna trade, there are several requirements imposed by importing countries with the intention of protecting consumer health and the sustainability of fishery resources. It is known that tuna and other marine animals are exposed to and accumulate residue and heavy metal contaminants, such as cadmium, mercury, arsenic and lead, which are extremely toxic to humans (Khansari et al 2005). Taking into consideration the demand for safe and healthy food, several countries have established its maximum residual limits for chemical contaminants and drug residues. Furthermore, increasing concerns regarding environmental and sustainable fishing have led some countries to establish mandatory regulation and standards requirements, such as traceability and dolphin safe label. Based on the description above, the research questions for this study are:
1. What factors affect the trade flow of canned tuna from Thailand, the Philippines and Indonesia?
4
Research Objectives
According to the aforementioned problem statement, the objectives of this study are:
1. To determine factors that may affect the trade flow of canned tuna from Thailand, the Philippines and Indonesia.
2. To analyze whether standards act as a barrier to canned tuna exports from Thailand, the Philippines and Indonesia.
Benefits of the Study
The benefits of this study are:
1. As an information in order to improve export performance of canned tuna industry.
2. As a reference and consideration in setting policy related to canned tuna industry, particularly in terms of increasing standards regulation in importing countries.
3. As a reference and information for further study in more depth approach or different production technology for academics and researchers.
Scope and Limitation of the study
This research was using secondary data that consist of annual canned tuna export from Thailand, the Philippines and Indonesia to 50 importing countries for 14 years, 2000 to 2013. The following limitations are to be considered with this research:
1. The type of tuna used in this research is tunas, skipjack, bonito prepared/preserved, not minced in accordance with the harmonized system (HS) 1996 code 160414.
2. Standards imply any regulation relating to chemical contaminants, drug residues and mandatory certifications in the tuna sector.
2 LITERATURE REVIEW
Gravity Model Approach in Trade Flow Analysis
Gravity models have long been used in explaining bilateral trade. This model itself is based on Newton's law of gravity, where the predicted trade volume between two countries increases with the size of the economy (GDP) and decreases with the cost of transportation as measured from the economic distance between trading partners (Yamarik and Ghosh 2005). The use of this model in bilateral trade analysis is quite popular for several reasons.
First, the gravity model has proven quite successful in predicting bilateral trade flows and giving consistent results (Kepaptsoglou et al 2010). In the traditional gravity model, many studies from the literature have shown that countries with a larger economic size trades more and countries that have a great distance from one another trade less as a result of higher transportation costs.
Second, many researchers are interested in developing gravity models with respect to theoretical justification and estimating techniques. Even though excellent in determining trade flow patterns, the traditional gravity model has been criticized for not being able to provide strong theoretical foundation. Anderson (1979) was the first who derived the gravity model from economic theory with the assumption of each country specializing in the production of one good. Other alternative theoretical foundations of the gravity model are suggested by Bergstrand (1990) with the employed factorial model, Deardoff (1998) with the Heckser-Ohlin model approach, and Anders and van Wincoop (2003) who
followed Anderson’s assumptions and also take into account multilateral
resistance terms as a proxy for unobserved trade barriers of trading countries; etc. As the theoretical justification has been developed, other studies shifted their interest in choosing the best technique for estimating the gravity model. Santos Silva and Tenreyro (2006), for example, suggested using Pseudo Poisson Maximum Likelihood (PPML) instead of using OLS methods which converted the multiplicative form of gravity estimation into logarithms. By taking logarithm, the presence of zero observations, that is likely to occur on trade data, is not taken into consideration in OLS estimation. He argued that by reducing or eliminating the zero trade value, a biased estimation would likely occur.
Third, there has been increasing interest in empirically testing the trade effects of related policies (participation in trade agreement/imposing standards on specific commodities) in international trade. Most topics of interest in recent studies refer to whether the policy implementation is actually creating or diverting trade (Kepaptsoglou et al 2010).
Variables Construct Gravity Model
6
Gross Domestic Product (GDP) and Total Production
GDP is a measure that is used to portray a country’s economic state by
showing the production capacity of all available goods and services in that country over a specific period of time. GDP plays a substantial role in the estimation of the gravity model, since it acts as an indicator of a country’s supply and demand (Tinbergen 1962). For the importing country, GDP portrays the purchasing power and the market size or absorptive capacity of the country. As for the exporting country, GDP typically represents the potential capacity for exports (Chen et al 2008). In the case of single or specific commodity trade,
instead of using GDP, the commodity’s output (total production) is more
appropriate for capturing the effect of the supply side on the export of a commodity (Evans 2001; Hillberry 2002; Chen et al 2008; Pujiati 2014; Sudiyana 2014).
The present study uses the GDP of importing countries and the total canned tuna production for exporting countries to represent supply and demand. These variables are expected to have a positive effect on canned tuna exports.
Distance and Remoteness
Distance between trading countries is commonly used as the main resistance factor in the gravity model. This variable indicates transportation costs faced by trading countries (Salvatore 1997). Typically, distance is calculated by
the geographical measure between the countries’ two economic centers. The study
of transportation cost on trade flows by Martinez-Zarzoso and Suarez-Burgue (2005) showed that distance and poor infrastructure increase transportation costs.
As country’s become further apart, transportation cost becomes higher, resulting
to a decrease in trade volume. Some studies, however, use economic distance rather than geographical distance. Economic distance is calculated by multiplying the distance between the countries with respect to world oil prices (Meiri 2013).
In the present study, remoteness is used as a measure of hindrance rather than distance. Remoteness not only takes into account how far a country is from others, but also the level of economy activities in each country (Ewing and Battersby 2003). Remoteness can be used as a proxy for multilateral trade resistance which is a bilateral trade resistance term of each country (Herrera 2010). Calculation of remoteness can be written as follows:
wheredij denotes the bilateral distance between countries i and j, weighted
by the share of each country’s GDP share with respect to world GDP.
Exchange Rate
Exchange rate is the price that a country pays for trading with another country. The volatility of exchange rates between trading countries over time are expected to affect trade flows (Rose 2000 in Kepaptsoglou et al 2010). Several studies have been conducted in attempt to explain the relationship between international trade and the exchange rate. The main discussion is that an increasing in the exchange rate volatility led to a lower international trade. This condition occurs because variability in the exchange rate is associated by risks and transaction cost in which reduce the incentives to trade. As a result, risk-averse
agents reduce their international trade activity and shift their production into the domestic market (Dell 1998). In addition, Broda and Romalis (2010) in Nicita (2013) stated there could be a reverse causality between volatility and international trade, which means international trade help stabilize the fluctuations of exchange rate.
Regional Trade Agreements
A country’s participation in regional trade agreements can also have an
effect on the trade flows between countries. By participating in a trade agreement, a country will benefit from decreasing tariffs that are imposed by trading partners, which means that trade costs will be minimized. A study by Caporale et al (2008) examined bilateral trade effects of free trade agreements (FTAs) between the Central and Eastern European (CEEC-4) and the European Union (EU-15) countries. The result indicated that the presence of FTAs leads to a significantly positive impact on trade flows. This variable is commonly expressed through the use of dummy variables, which are utilized (value =1) if the country belongs to a trade agreement.
Definition of Standards and Motivation for Developing Standards
Standards, refer to Directives No. 28/19941 regarding safety and food standards, can be determine as specifications or technical requirements that established, including procedure and method which is based on the consensus of all the parties concerned by observing requirements for safety, security, health, environment, development of science and technology, as well as the experience of the development of the present and future to benefit as much as possible. The objectives of standards are to raise the quality of output, to protect workers, consumer or the environment from potential hazard, or to ensure compatibility among products or intermediates (Moenius 2004). The Organization of Economic Cooperation and development (OECD 1994) suggested that there are two groups of environmental standards: 1) Product standards, and 2) Production and Process Methods (PPMs). Product standards relate to the technical characteristics of the product, as an example performance, quality and safety, while PPMs focus on production and process related standards alluding to the life cycle of a product and highly depending on natural, climatic, technical or economic factors (Stevens 1994).
Motivation for developing standards can be derived from several aspects: preference, environmental and economics. Motivation may be mainly driven by changed preferences (with raising income and a more densely populated world), and better information and communication about production and consumption externalities. In environmental aspects, standards can be motivated by employee protection and animal welfare protection. Environmental measures may be taken on a moral basis, rather than to solve a specific environmental problem. Motivations for setting trade-restricting standards based on values and preferences usually aim at the production process in exporting countries and may example
8
include the imports of cosmetics which are tested on animals or other goods which damage the environment in any way.
Economic motivations are generally based on achieving increased transparency, reduced transaction costs and food safety. The economic debate often focuses on compliance cost and competitiveness effects of standards. On the one hand, it is feared that the introduction of costly environmental standards puts the producers and the country as a whole into a disadvantaged competitive situation. On the other hand, there are concerns that environmental standards are motivated by reasons of protectionism to reduce market access for potential competitors (Grote and Kirchhoff 2001).
Standards in product export can drive benefit and loss in a way. Moenius (2006) suggested that standards are helpful for coordinating economic agents’ activities within a unified national or regional market, but are a barrier to imports from others. For agricultural standards, it either increase costs of trade or hinder trade directly. In his findings, Moenius (2004), however, standards of importer countries can have either a negative or a positive effect on trade, and the same is true for harmonized standards. More specifically, importer standards tend to hinder trade in simple goods (including agricultural products) and promote trade in complex goods (like machinery). This happens as standards increase costs of adapting products to foreign markets or meeting process requirements. But they also lower search costs both for producers who want to adapt their products to a specific market as well as for consumers who would otherwise have to search for a certain minimum quality. Moreover, harmonization reduces both product adaptation costs as well as variety, and it depends on which effect dominates in each of these two cases whether standards are trade creating or trade reducing.
Food Safety Standards and Seafood Trade
Growing concerns regarding food standards for better-off consumers and environmental awareness has encouraged countries to implement stricter food safety standards on the products they consume, coming from both local and imported products (Grote and Kirchhoff 2001). Food standards are usually implemented by a developed nation as an import requirement before a product can be brought into the country. In some cases, higher food standards may create a new form of trade barrier.
implementation of HACCP. This result is supported by Norbert et al (2010) who conducted similar research and also suggested that smaller traders may suffer more with the implementation of the United States’ HACCP.
Nguyen & Wilson (2009) conducted similar research regarding the establishment of more stringent food safety standards in the seafood trade. The study attempted to capture the impact of food safety standards on three of the largest seafood importers, the US, the EU and Japan. The impact on the top importers was measured by three different standards: the HACCP which was imposed by the US in 1997, the MRPL (Minimum Required Performance Limits) which was imposed by the EU in 2002 and the Food Safety Basic Law which was imposed by Japan in 2003. These three regulations are more stringent than the implemented standards that previously existed. Applying the gravity model with panel data from 123 exporting countries and 17 importing countries (Japan, the US, and 15 member states of the EU), the result showed that food safety regulations have affected seafood exports. All three food safety standards led to significant losses in seafood trade.
Several other studies have also tested the impact of food safety regulation on seafood trade by referencing standards on specific chemicals rather than on dummy regulation, as in the aforementioned studies (Kareem; Chen et al 2008; Tran et al 2013).These studies showed similar results which implied that food safety regulations imposed by a country may affect trade flow to the country, regardless the development status of nations. Furthermore, the more stringent the standard, the more the standard acts as a barrier to trade.
As the imposition of standards become more stringent, there are several consequences that must be considered by trading countries. The standards differ across trading countries which imply increasing compliance cost to meet the requested standards. Moreover, government role in ensuring the domestic production to meet the international standards are important.
3 FRAMEWORK
This chapter provides the theoretical foundation and operational framework for this research. The first section discusses the development of international trade theories developed with respect to why it is beneficial for a country to trade and the evolution of trade theory. The second section focuses on the theory underlying the gravity model. The last section provides the operational framework for this study.
The International Trade Theories
10
infrastructure development through technology transfer; (iii) gain from specialization and market expansion (Auerbach 1996).
Figure 4 portrays the mechanism of international trade between countries. A country tends to export a commodity when its domestic price in autarchy is relatively lower than the price of the same commodity in other country. The relatively low price in a country can reflect a surplus supply of a commodity. As a result, the country (country A) may export its production surplus to other country (country B). On the other hand, country B faces an excess supply in the respective commodity caused by the domestic consumption is higher than its production. The excess supply in country B leads to a high domestic price of the respective commodity. In order to fulfill domestic demand, country B tends to import a relatively low price commodity from other country (in this case country A).
Panel A and C in Figure 4 show the market of a commodity in country A and B. Country A exports its surplus production if its price is higher than Pa while country B imports if its price is lower than Pb. Thus, the difference prices in both countries lead to international trade between country A and B. As a result, the commodity price in the international market will be balanced in world equilibrium price Pe. In thisPe (Pb>Pe>Pa) level, country A export as much as q2a-q1a and country B import q2b-q1b which is proportional with country A export quantity.
Figure 4 International trade
Source: Salvatore (1997)
where:
Pa = Autarchy price in country 1, qea = Consumption in country 1, q2a-q1a = Surplus supply in country 1, Pb = Autarchy price in country 2, qeb = Consumption in country 2, q2b-q1b = Surplus demand in country 2,
Pe = Equilibrium price on international market, qe = Export quantity,
The theory of international trade is highly developed. The general economic theory is comprised of three main objectives: (1) to describe the flow of
Exports Imports
Panel B
Panel A Panel C
Price Price Price
Quantity Quantity
trade between at least two countries; (2) to measure gains or losses from the trading countries; and (3) to analyze the impact of policy on trade (Morgan and Katsikeas 1997).Classical theories indicate that each country should consider having a trading partner so that it will benefit by exporting goods at a level that achieves economic advantages.
Adam Smith was the first who developed international trade theory, based on the absolute advantage concept. A country has an absolute advantage when it can produce goods more efficiently than another country. This theory emphasizes that the country that is producing a good with an absolute advantage exports the surplus to gain from trade. Trade will occur when another country has an absolute advantage in the production of a different good.
Another classical theory developed by David Ricardo improved upon
Adam Smith’s theory. Ricardo’s theory states that international trade will occur when the opportunity cost of producing a good is lower than in other countries. Even though there is no absolute advantage in producing any good, a country will still gain from trade if it can produce the product at a lower autarky price, i.e., at a lower opportunity cost. This theory stresses that a comparative advantage arises from technological differences between countries (Feenstra 2002). Trade occurs as a result of differences in productivity between countries.
In 1933, Eli Heckscher and Bertil Ohlin developed another international trade theory that builds on Ricardian theory. This theory, which is commonly known as the Heckscher-Ohlin (HO) model, or the factor-proportional theory, emphasizes that a country tends to specialize in producing and exporting the good which can be more abundantly produced in accordance with its plentiful factors, while importing products that they have limited production factors. Moreover, the HO model shows that trade flows are driven by differences in factor endowments, i.e., what resources are available in a specific country. This model is based on some basic assumptions: factor productions move freely between sectors, there are differences in factor endowments between trading countries, identical technology exists across countries, and there is a constant return to scale.
The development of the new trade theory (NTT) argued that comparative advantage can be generated separately from factor endowments. This theory, introduced by Paul Krugman, is based on the assumptions of monopolistic competition and increasing returns to scale. In monopolistic competition, all firms
produce a unique variety of a differentiated product in order to capture the “love of variety” in consumer demand (Feenstra 2002). Each firm maximizes its profit and increases its production to reduce the average marginal cost. In a monopolistic competition situation, when countries engage in international trade, each country will be importing and exporting differentiated products. Other trade theories can be derived from the monopolistic competition model; an example of this is the gravity model that has been employed to examine the flows of international trade in recent years.
Barriers on Trade
12
trade barriers, which including tariff and non-tariff barriers. Trade barriers may raise price higher than they would be in the home country when free trade occur. It enhances the market shares of protected domestic producers and limits the volume of exported products into the country.
Figure 5 The economic effect of trade barriers
Source: EMAI (2000)
Figure 5 above depicts the economic effect of trade barriers. In no barriers condition, the world price of P1 would prevail in the market. Country A's domestic producers would supply Q1, and the country would import Q4-Q1 from the rest of the world. Trade barriers restrict the world supply in Country A, and raise the price to P2. Domestic production increases to Q2, and imports are reduced to Q3-Q2. The total area (a+b+c+d) is a loss in consumer welfare due to the higher prices. The red area (a) is called the redistribution effect because domestic producers gain at the expense of domestic consumers. The yellow area (c) is called the revenue effect. If the trade barrier is a tariff, then the government collects area c in the form of tax revenue. If the trade barrier is a quota, then area c may accrue either to the government, domestic importers, or foreign producers. It depends on the circumstances and relative powers in the market. The combined gray areas (b+d) are known as the "deadweight loss" of trade barriers. The consumer loss of areas (b+d) accrues to no one! If trade barriers are prohibitive, the price would rise to P3 and Country A would have no imports. All production and consumption would be domestic (Emerging Market Access Index, EMAI 2000).
Tariff is a tax imposed on foreign goods as they enter a country, while non-tariff barriers are non-tax measures imposed by governments to favor domestic over foreign suppliers (Coughlin and Wood 1989). Non-tariff barriers (NTBs) cover a wide range of measures, such as: (1) quotas, which is a limit on the quantity that could be imported; (2) excessive customs formalities, which may delay the imports of goods; (3) voluntary export restraints, where bilateral agreements whereby one country voluntarily agrees to restrict the volume of its exports to other country; (4) subsidies, which is a payment by the government to the producers to lower the price of domestic goods and encourage consumers to buy them instead of imports; (5) excessive standard requirements, which could be taking form in health and safety standards, or other standards requirements. In the
Price
excessive standard requirements case, imports are restricted by imposing high standards that could only be met with difficulty by the exporters. This study main focus is in understanding standards as non-tariff measures.
There are different measures to identify NTBs to trade and to estimate their impact on trade (Disdier et al 2007). Four groups can be derived from these measures. (1) Frequency and coverage type measures. The frequency index only accounts for the presence or absence of an NTB. This index does not provide any information on the relative value of affected products. This could be acquired through the coverage index that would be computed using the value of imports occurred in the absence of NTBs as weight. This value is unobservable and therefore imports (home or world imports) are usually used as alternative weights.(2) Price-comparison measures. The purpose of this approach is to observe the effects of NTBs on domestic prices of imported goods by comparing these prices with some reference prices.(3) Price effect measures using import demand elasticities. (4) Quantity-impact measures. This method estimates trade flows mainly by using gravity equation. Information regarding NTB is brought in as explanatory variables. Comparison between actual trade flows and predicted trade flows in the absence of NTBs then provides some indication of the trade restrictiveness of these barriers. Evaluations of trade barriers included in these models are usually based on frequency or coverage indexes. To identify whether standards act as NTB in the canned tuna trade from Thailand, the Philippines and Indonesia, the approach utilized in this study is quantify-impact measures by using gravity equation.
Trade Flow Analysis Using Gravity Model Approach
Since its initial introduction by Tinbergen (1962), the gravity model has been widely utilized to determine patterns of international trade. The concept of the gravity model is based on Newton's gravity law which states that the physical force between two objects (F) is proportional directly to the object's mass (M1, the distance between countries (r). The gravity equation is initially formulated as follows: unobserved parameters. Several studies also account for other variables which may affect trade flows, such as geographical factors, population, common language, historical ties, the exchange rate, regional trade agreement and food standards (Frankel 1997; Rose 2000). These variables can be included in the
………..…...… (2)
14
model as a control (Tran et al 2013). The equation (3) estimated using log-linear form:
Despite having empirical success in predicting trade flows between countries, the gravity model of trade flow analysis have been doubted by many economists due to its lack of theoretical justification (Kepaptsoglou et al 2010). Several researchers have attempted to establish theoretical justification for gravity model analysis. Anderson (1979) provided the initial economic theory by using a Cobb-Douglas function with the following assumptions: (i) identical homothetic or constant elasticity substitution (CES) preference, and (ii) goods are differentiated by place of origin. Moreover, Bergstarnd (1990) and Deardoff (1998) developed theoretical foundation using CES preference and to explain specialization, added monopolistic competition or a HO models. By applying the assumptions from the Anderson and Deardorff theories, Anderson and van Wincoop (2003) derived the gravity equation by adding trade resistance (trade cost) into the original gravity formulation. Trade resistance in the Anderson and van Wincoop (AvW) model can be intuitively divided into three components: (i) trade barriers between region i and j, (ii) resistance of region i to trade with other regions, and (iii) resistance of region j to trade with other regions.
The gravity model by AvW is derived from demand function. The
structure for the consumer is based on CES preference. Consumers have “love of variety”, indicating that their utility increase by consuming more products as well as consuming a wider variety of products. Meanwhile on the production side, each
region is specialized in producing only one good. In order to fulfill consumers’
demand for product varieties, the producers sell its products across the region. However, by exporting the products it means the producers face trade cost including information costs, legal and regulation costs and transport cost as well. This trade cost is passed by the exporter to the importer. As a result, price differs
across the region. Based on these assumptions (consumers’ preference and
specialization in the production), the equilibrium can be derived: firms produce goods for domestic and international market, and consumers consume accordingly. In aggregate, these foundations derive the gravity model. The AvW gravity equation can be written as follows:
Taking a logarithm of the equation (5).
where, Yw indicates global income (world GDP), tij indicates all bilateral resistance that is assumed to be symmetric tij= tji, iand Pj are the multilateral
resistance variables, with iis the outward multilateral variable that captures exports from country i to j relying upon trade cost across all possible export market, while Pjis the inward multilateral resistance that captures imports from country i to j relying upon trade cost across all possible suppliers, and σ is the
equation implies "trade between region is determined by relative trade barriers" (AvW 2003). Anderson and van Wincoop have suggested using a non-linear regression or OLS with a fixed effect to capture multilateral resistance.
The Exchange Rate and Trade
The exchange rate of an economy affects aggregate demand through its effect on export and import prices. Figure 6 below portrays the impact of exporter currency appreciation on trade. The four-panel diagram shows the United States as an exporter on the left panel, trade on the second panel, exchange rates on the third panel, and the rest of the world on the last panel. A stronger dollar increases the relative price of the product in the rest of the world, decreasing demand for and reducing exports from the US.
The initial quantity traded before the appreciation of the US dollar is at point Qt, and the price of the good at this quantity traded is at P. The strengthening of the dollar is illustrated by a downward shift in the exchange rate line (1:1), effectively depreciating the importer currency. After shifting the currency line, begin at the equilibrium of the import market, point B, and move left until reaching the original currency line at point C. Take that line down to the new currency line, point D. Continue left from point D to the US price axis. This line is the new price level for the exporter, increasing quantity demanded by J and
decreasing quantity supplied by K in the export country’s market. At point E,
where the new price intersects the trade price axis, the new Excess Demand line is drawn by connecting point E to the intercept point on the horizontal axis of the original ED. Point F is the new quantity traded, with a decrease in the amount of L. from point F, a line is drawn back to the new currency line (point G) up to point H on the 1:1 line and to the right through the importer supply and demand axis. This show that the impact of the currency appreciation in the export market is a decrease in quantity demanded and an increase in quantity supplied in the amount of M (Kristinek& Anderson 2002).
Figure 6 The impact of exporter currency appreciation on trade
16
In other words, appreciation of an economy will induce: (1) an increase in foreign price of exports which implies exports become more expensive. Therefore a decrease of export quantity can be expected; (2) imports become cheaper as the consumers can afford a greater quantity of the imported goods. Therefore an increase of import quantity can be expected; (3) lower economic growth. As export demand decrease and import spending increase, domestic aggregate demand can be expected; (4) lower inflation caused by a decrease in import prices, lower aggregate demand and greater incentives to manufacturers as the export prices become expensive (Goldberg and Knetter 1996; Anonymous 2014).
Operational Framework
Tuna is one of a most important commodity traded in fish and fishery products, which majorly traded in canned. Thailand, the Philippines and Indonesia are three main exporters from Asia which contributes more than 60 percent of world canned tuna supply. Demand for canned tuna is globally dispersed and likely to increase each year.
Several factors may affect the trade flows of canned tuna trade, namely canned tuna production in the exporting countries, GDP of the importing countries, remoteness, exchange rate, participation in the free trade area and food standards. The canned tuna production in the exporting countries and GDP of the importing countries portray the supply and demand of traded countries. As the production increases, the ability to export increases as well. For the importing countries, as the GDP increases, the ability to absorb canned tuna export increases. Both the production of canned tuna and GDP is expected to have positive effect to canned tuna export.
Figure 7 Operational framework
On the other hand, remoteness acts as trade resistance between the exporting and importing countries. As the remoteness of the exporting countries increases, the canned tuna export tends to decrease. Thus, remoteness is expected to have a negative effect to canned tuna export. The increasing of exchange rate
encourages country to export more. In other words, the exchange rate is expected is expected to have a positive effect to canned tuna export. Similarly, participation in trade agreement is expected to have a positive effect to canned tuna export. Engage into trade agreements may support international trade since it minimizes trade resistance between countries. In contrast, food standards are expected to have a negative effect to canned tuna export. As the required standards to enter foreign market become tighter, the canned tuna export from Thailand, the Philippines and Indonesia tends to decrease.
This study aim is to analyze whether those factors above are affecting trade flow of canned tuna by utilizing gravity model of trade. The operational framework of this research is portrayed in Figure 7. Based on explanation above, hypothesis of this study are:
1. Canned tuna production has a positive effects on canned tuna trade 2. GDP of importing countries has a positive effects on canned tuna trade 3. Remoteness has a negative effects on canned tuna trade
4. The exchange rate has a positive effects on canned tuna trade
5. Participation in free trade agreements (FTAs) has a positive effects on canned tuna trade
6. Standards has a negative effects on canned tuna trade
4 RESEARCH METHODOLOGY
This chapter describes the methodological approach of this research. The first part gives a description of the type and source of data used in the study. The second part portrays the data analysis using the gravity model and the estimation techniques. The third part provides the gravity model formulation as utilized in the canned tuna trade.
Types and Sources of Data
The secondary data used in this research consists of both time series and cross-sectional dataset, with an observational period of 14 years, 2000 to 2013. The cross-sectional data consists of an annual export value of three exporting countries (Thailand, Indonesia and the Philippines) paired with 50 importing countries. A list of the importing countries is available in Table A1 (Appendix).
18
journal articles and books related to this topic. Table 1 below shows the sources for various factors needed in the model.
Table 1 Data Sources
Data Unit Source of Data
Export value of tuna US$ UN Comtrade
Total production of tuna
MT FAO - Fisheries and Aquaculture Information and Statistics Service
GDP US$ World Bank
Real exchange rate US$ World Bank
Distance Kilometer CEPII
Trade Agreement ARIC
Food Standards CFIA, Global Agriculture
Information Report (GAIN) USDA, SEAFDEC
Source: Author’s elaboration
Panel Data Analysis Using Gravity Model
The data analysis is conducted using gravity model estimation. This method is used here to analyze trade flows of canned tuna and whether the implementation of food standards in a destination country has a significant influence on the international trade flow in Thailand, the Philippines and Indonesian tuna exports to 50 destination countries. Data is processed using Microsoft Excel and Stata version 13.0. In this research, two approaches are used in estimating the gravity model: (1) Ordinary Least Squares (OLS) and (2) Pseudo Poisson Maximum Likelihood (PPML).
There are different standards imposed by destination countries, that are: (1) using the international standards (CAC) and (2) using national standards that stricter than the CAC. In order to capture how the different standards imposed by the destination countries affecting Thailand, the Philippines and Indonesia canned tuna exports, the dummy variables are used by categorizing the standards. This approach is used by Pelletiere and Reinert (2006) to measure the level of protection in used automobiles. Table 2 presented the category of standards.
Ordinary Least Square (OLS)
In this study, factors affecting trade flows of canned tuna and impact of the implementation of food safety standards is analyzed. The gravity equation can be written as follows:
To estimate equation (7), the multiplicative gravity model transforms into a log-linear model: (Thailand, the Philippines and Indonesia). Prodi indicates annual tuna production in country j. GDPj is real GDP of country j. Rij measures remoteness of county i to
……….… (7)
country j. ERij is the exchange rate between country i and country j. FSj is a dummy variable which is valued at 1 if country j has imposed food standard regulations. FTAij is a dummy variable which is valued at 1 if both countries i and j participate in free trade agreements.
Table 2 The Dummy Categories of Standards
Categories Standards Description Number of Countries
2000 2013 chemical contaminants and drug residues that are stricter than international standards
26 8
2 A country establishes a more
restricted maximum limit of chemical contaminants and drug residues than it was in the previous years
0 1
3 A country not only establishes maximum limit of chemical contaminants and drug residues but also requires specific certification (catch certificate and/or eco-labeling) improves the efficiency of econometric estimation by providing a large number of observations, increasing the degree of freedom and diminishing collinearity among dependent variables. Moreover, panel data can be used to explain economic questions that time series and cross-sectional data cannot describe, such as variables that change over time but not across entities (Hsiao 2003).
20
can be used in testing this assumption. According to Anderson and van Wincoop (2003), the initial gravity model failed to consider multilateral resistance terms that may lead to biased estimation results. To take the multilateral resistance into account, they suggested using OLS estimation with a fixed effect approach. The fixed effect is employed by put the dummy of country-specific effect into the estimation. This dummy is used to capture all source of unobserved heterogeneity, that constant for a given exporter across all importers as well as constant for a given importer across all exporters.
Poisson Pseudo Maximum Likelihood Estimation
Estimating the gravity model with the logarithmic transformation may lead to certain problems, particularly when trade data contains observations with zero values. A zero value may occur for several reasons, such as no trade condition existing in a given period, rounding the errors due to trade values which did not reach a minimum value, or missing observations (Santos Silva and Tenreyro 2006). Various methods have been used in dealing with zero trade observations: (i) utilization of the truncation method by completely deleting the zero trade observation, and (ii) adding a small value to the zero observation before taking the logarithmic transformation (Kareem et al). Moreover, applying these methods may result in a loss of information and lead to inconsistent estimates as the data would potentially suffer from a sample selection biased (Heckman 1979; Linders and de Groot 2006; Herrera 2010).
Empirical studies have provided other estimation techniques for dealing with zero-value observations. An approach proposed by Santo Silva and Tenreyro (2006) is to employ the Pseudo Poisson Maximum Likelihood (PPML) estimator. They suggested rather than using log-linear gravity equation, estimated in its multiplicative form by using PPML would lead to a better result. Not only does this approach overcome the zero value trade observation problems, but also this technique also consistent in the presence of heteroskedasticity. Furthermore, interpretation of PPML follows OLS estimation although the dependent variable in PPML is in levels. The coefficient of the independent variables can be interpreted as elasticities and semi-elasticities depending on whether the independent variables are entered in logarithms or not (Shepherd 2013). The PPML estimator can be written as below:
exp( )
0Model Formulation of Canned Tuna Trade
This study analyzes canned tuna trade flows and how food standard regulations affect trade through the utilization of gravity models. Independent variables used in this model include: annual tuna production in exporting countries, GDP of importing countries, the distance between countries/remoteness, exchange rate, dummy variables of food standards imposed by destination countries, and participation in free trade agreements.
For the purpose of comparison and to obtain a better solution, there are two model formulations used in this research, the OLS and PPML estimations. The model equations can be written as follows:
lnYijt = β0 + αi + αj + β1lnProdit + β2lnGDPjt + β3lnRij + β4lnER + β5D_FS1jt + β6D_FS2jt+ β7D_FS3jt+ β8FTAijt+ εijt………...(10) Yijt = exp{β0 + αi + αj + β1lnProdit+ β2lnGDPjt+ β3lnRij+ β4lnER + β5D_FS1jt
+ β6D_FS2jt+ β7D_FS3jt+ β8FTAijt+ εijt+ εijt}………...(11)
where:
Yij = annual export value of exported tuna from country i to country j (US$),
Prod = annual production of tuna in country i (MT), GDPj = GDP of country j (1000US $),
Rij = remoteness of country i from country j,
ERij = real exchange rate between country i to j (US $), D_FS1jt = dummy variable of FS1 imposed by country j in year t, D_FS2jt = dummy variable of FS2 imposed by country j in year t, D_FS3jt = dummy variable of FS3 imposed by country j in year t, FTAijt = dummy variable of trade agreement between country i and
j,
αi = importer specific effects,
αj = exporter specific effects,
β0 = intercept,
βn = estimated parameter (n=1,2,..8) with β1, β2, β4, β8>1 and β3, β5, β6, β7<1,
i = exporting countries (Thailand, the Philippines, Indonesia), j = destination countries.
Hypotheses Testing and Goodness of Fit
The purpose of hypothesis testing is to determine whether the regression coefficients are statistically significant (Nachrowi and Usman 2006). There are two common methods used of testing hypotheses, namely:
F-test
This test is intended to determine whether the independent variables in the model jointly affect the dependent variable. The formulation of the F-test is as follows (Anderson et al. 2009):
H0: β1= β2= β3= ……= βk = 0
H1: There is at least one β value that is not equal to zero
The test criteria is if Fstatistic>Ftable,α,(k-1)(n-k), then H0 can be rejected, where k is the number of variables and the number of observations is denoted with n. Additionally, if the probability (p-value) < significance level, then there is adequate evidence to reject H0. Rejecting H0 indicates that the independent variables in the model jointly have a significant effect on the dependent variable at the significance level of α %.
22
This test is intended to determine whether the independent variables individually have a significant effect on the dependent. The formulation of the T-test is as follows (Anderson et al 2009):
H0: βj = 0
H1: βj≠ 0; where j = 0, 1, 2,….., k, with k representing slope coefficient The test criteria is to reject H0 if |tstatistics|>tα/2;n–k-1or P<α, which implies that independent variables significantly affect the dependent variable.
Goodness of Fit
The goodness of fit (R2) aims to measure the variation amongst the independent variables that can be explained by the dependent variable. The formula for goodness of fit is expressed in the following equation (Anderson et al. 2009):
2
2
2 1 ˆ
Y Y
Y Y R
i i
The result of the goodness of fit estimation ranges from zero to one (0<R2<1). If the value of R2 is close to one, it indicates that much of the variation of the independent variables in the model can be explained by the dependent variable.
5 GENERAL OVERVIEW OF CANNED TUNA INDUSTRY
Tuna is a highly migratory species that are widely spread throughout all oceans in the world, especially in tropical warm temperature oceans. According to the FAO (2014b), from 1950 to 2012 the global amount of tuna captured commercially increased from 415,000 MT to 4.8 million (Figure 8). The majority of this catch occurs in three regions: the Pacific, Indian, and Atlantic Oceans. The Pacific Ocean contributes the largest share of global tuna yields at approximately 64 percent, while the Indian and Atlantic Oceans contributes 25 percent and 11 percent, respectively (Miyake et al 2010).
Figure 8 Worldwide catches of commercial tuna, 1950-2012
Source: Author’s elaboration with data from FAO-FishstatJ (2015)