CONTRIBUTION OF
HETEROTROPHIC RESPIRATION TO TOTAL SOIL
RESPIRATION FROM PEAT SWAMP FOREST AND OIL
PALM PLANTATIONS IN CENTRAL KALIMANTAN,
INDONESIA
DEDE HENDRY TRYANTO
GRADUATE SCHOOL
BOGOR AGRICULTURAL UNIVERSITY
BOGOR
STATEMENT OF THESIS, SOURCES OF INFORMATION
AND COPYRIGHT*
I hereby declare that the work in this thesis entitled “Contribution of heterotrophic respiration to total soil respiration from peat swamp forest and oil palm plantations in Central Kalimantan, Indonesia” is my original work under the supervision of academic committee members. Any contribution made to the research by others, with whom I have worked at Bogor Agricultural University or Center for International Forestry Research is explicitly acknowledged in the thesis.
Materials previously published or written by other person mentioned in the text and listed in the bibliography at the end of this thesis. I declare that no part of the thesis submitted has been used for any other paper in another higher education institution, research institution or educational institution. I agree that the copyright of this article is owned by Bogor Agricultural University.
Bogor, February 2016
Dede Hendry Tryanto
RINGKASAN
DEDE HENDRY TRYANTO. Kontribusi respirasi heterotrofik dari respirasi tanah total dari hutan rawa gambut dan perkebunan kelapa sawit di Kalimantan Tengah, Indonesia. Dibimbing oleh CECEP KUSMANA, KRISTELL HERGOUALC’H dan YADI SETIADI.
Dalam cadangan karbon global, hutan rawa gambut di kawasan Asia Tenggara memegang peranan penting sekaligus sebagai mitigasi terkait perubahan iklim di masa yang akan datang. Hutan gambut tropis menyimpan karbon dalam jumlah besar di dalam tanah dalam ekosistem tanah gambut. Konversi hutan rawa gambut menjadi perkebunan kelapa sawit merubah fungsi alami dari ekosistem hutan sebagai penyerap dan penyimpan karbon akan menjadi sebagai sumber penghasil karbon (Hergoualc’h & Verchot 2013). Laju kerusakan hutan rawa gambut di Indonesia sangat tinggi (1.5 - 2.2% per tahun) dibandingkan dengan type hutan lainnya selama kurun waktu 2000 - 2010 (Miettinen et al. 2012b), Sebagai akibat pembangunan perkebunan kelapa sawit di ekosistem tanah gambut. Konversi hutan rawa gambut menjadi perkebunan kelapa sawit berakibat pada kenaikan emisi dari gas rumah kaca ke atmosfir terutama emisi CO2.
Respirasi tanah sangat penting dalam perhitungan perubahan dalam stock C atau dalam perubahan C dalam suatu ekosistem (IPCC 2006). Respirasi tanah merupakan penjumlahan dari respirasi autotrofik (akar dan rizosfir) dan respirasi heterotrofik (mikroba dan hewan tanah) (Ryan & Law, 2005, Dalun et al 2011). Akan tetapi, hanya respirasi heterotrofik yang berkontribusi terhadap peningkatan CO2 terakumulasi di atmosfir (Hergoualc’h & Verchot 2013, Murdiyarso et al.
2010). Dalam penelitian ini metode trenching digunakan untuk mengukur respirasi heterotrofik (SRh) di hutan gambut dan perkebunana kelapa sawit. Penelitian ini dilakukan di dua tipe penggunaan lahan yaitu hutan rawa gambut yang berada di dalam Taman Nasional Tanjung Puting dan dua perkebunan sawit milik masyarakat dengan perbedaan umur [1 tahun (OP1) dan 5 tahun (OP5)] dalam kawasan penyangga kawasan taman nasional.
Tujuan utama dari penelitian ini adalah menghitung seberapa besar kontribusi dari repirasi heterotofik dari respirasi tanah total. Mengetahui hubungan faktor yang mempengaruhi dari respirasi tanah dari hutan rawa gambut dan perkebunan kelapa sawit. berkontribusi sebesar 89% dari respirasi tanah total sebelum re-trenched dan 123% setelah re-trenched. Di OP5, kontrbusi respirasi tanah heterotrofik yang dihasilakan sebesar 87% dari respirasi tanah total.
Kata kunci
SUMMARY
DEDE HENDRY TRYANTO. Contribution of heterotrophic respiration to total soil respiration from peat swamp forest and oil palm plantations in Central Kalimantan, Indonesia. Supervised by CECEP KUSMANA, KRISTELL HERGOUALC’H and YADI SETIADI
In a global carbon store, tropical peat swamp forests in Southeast Asia play an important role in future global climate change. Tropical peatlands store a huge amount of carbon in belowground ecosystem as peat soil. Conversion of peatswamp forest to oil palm plantation shifts the function of the natural state of forest from carbon sink to carbon source (Hergoualc’h & Verchot 2013). The rate of peatswamp forest deforestation in Indonesia has been higher (1.5-2.2% per year) than that of other forest types during 2000-2010 (Miettinen et al. 2012b), which mainly due to establishment of oil palm plantation on peat. Consequently, the conversion of primary peat swamp forests to oil palm plantations is believed to increase emissions of GHG especially CO2 emission into the atmosphere.
Soil respiration is very important for quantifying either the change in C stocks or in C fluxes in the ecosystem (IPCC 2006). Soil respiration is the sum of autotrophic respiration (root and rhizosphere) and heterotrophic respiration (microbes and soil fauna) (Ryan & Law, 2005, Dalun et al 2011). It should be noted that only the heterotrophic respiration contributes peat C loss into the atmosphere (Hergoualch’h & Verchot 2013, Murdiyarso et al. 2010). Trenching methods was applied to measure heterotrophic respiration (SRh) in this study. Soil flux rates of carbon dioxide (CO2) were studied under a primary peat swamp forest inside Tanjung Puting National Park and two smallholder oil palm plantations [1 year (OP1) and 5 years old (OP5)] in a buffer area of the park.
The main objective of this study was to quantify the contribution of heterotrophic component to total soil respiration. In addition, we also determined controlling factors of soil respirations from peat swamp forest and oil palm plantation ecosystems.
Mean heterotrophic respiration rate before re-trenched in the forest 8.8 ± 0.3 Mg C-CO2 ha-1 yr-1), amounted to 57% of total respiration (15.4 ± 0.4 Mg C-CO2 ha-1 yr-1). After re-trenched heterotrophic respiration rate in the forest increased to 9.0 ± 0.4 Mg C-CO2 ha-1 yr-1, or 88% of total respiration (10.3 ± 0.4 Mg C-CO2 ha-1 yr-1). In the OP1, heterotrophic respiration contributed to 89% of total soil respiration before re-trenched and 123% after re-trenched. In the OP5, 87% of total soil respiration was derived from heterotrophic component.
Keyword
© Copy Right of IPB, 2016
All right reserved
CONTRIBUTION OF
HETEROTROPHIC RESPIRATION TO TOTAL SOIL
RESPIRATION FROM PEAT SWAMP FOREST AND OIL
PALM PLANTATIONS IN CENTRAL KALIMANTAN,
INDONESIA
DEDE HENDRY TRYANTO
Thesis
Submitted in partial fulfillment of the requirements for the degree of Magister of Science at Natural Resources and Environmental
Management
GRADUATE SCHOOL
BOGOR AGRICULTURAL UNIVERSITY
BOGOR
Thesis Title : Contribution of heterotrophic respiration to total soil respiration from peat swamp forest and oil palm plantations in Central Kalimantan, Indonesia
Name : Dede Hendry Tryanto
ID : P052130551
Approved by
Supervising committee
Prof Dr Ir Cecep Kusmana, MS Head
Dr Kristell Hergoualc’h Dr Ir Yadi Setiadi, M.Sc
Member Member
Endorsed by
Head of Natural Resources and Dean of Graduated School Environmental Management
Prof Dr Ir Cecep Kusmana, MS Dr Ir Dahrul Syah, MSc.Agr
FOREWORDS
Praise and gratitude to Allah Subhanahu wa ta’alla and prophet Muhammad SAW that have provided all the best time in my life. I would like to thanks my supervisors, Prof. Dr. Ir Cecep Kusmana, MS, Dr Kristell Hergoualc’h and Dr. Ir. Yadi Setiadi, MSc for their guidance, invaluable suggestions, constructive comments for my thesis entitled Contribution heterotrophic respiration to total soil respiration from peat swamp forest and oil palm plantations in Central Kalimantan. I thank Dr. Ir. Iwan Hilwan, MS as an external examiner for suggestions and comments on my final defense. I would like to thank Prof. Daniel Murdiyarso, Prof. Lou Verchot, Prof. Boone J Kauffman, and Prof. Dudung Darusman for extraordinary supports for this research.
I would also like to thank my parents for their support and best wishes, my brothers (Tryan Budiarna and Aa Denny Budiarna), who always support me in any condition. Thank you very much for my beloved wife (Nisa Novita), your patience, support and motivation give me an extra energy to finish this study. Thanks to Desti Hertanti for your kindly help for this research. I thank Tanjung Puting National Park officers for permissions to work on Tanjung Puting National Park territory. I thank the owners of oil palm plantations (Mr. Marhatab and Mr.Kero) for allowing me to work on their properties. Finally, I appreciate all field assistants from Sekonyer village.
The research study is part of a large research SWAMP (Sustainable Wetlands Adaptation and Mitigation Program), is a collaborative by the CIFOR (Center for International Forestry Research), the USFS (United State Development Agency Forest Services) and OSU (Oregon State University) with support from USAID (United States Agency of International Development) with (Grand Agreement # MTO 069018).
Bogor, February 2016
Dede Hendry Tryanto
TABLE OF CONTENTS
LIST OF TABLES vi
LIST OF FIGURES vi
1 INTRODUCTION
Background 1
Scope of Study 2
Objective Study 2
Research Benefits 3
Hyphotesis 3
Research Framework 4
2 LITERATURE RIVIEW
Tropical Peat Swamp Forest 5
Oil Palm Plantations 7
Soil Respiration 9
3 MATERIAL AND METHOD
Site Description 11
Experimental Design 13
Soil CO2 respiration measurement 14
Environmental variables 15
Statistical Analysis 16
4 RESULT AND DISCUSSION
Result 17
Soil Properties 19
Soil Respiration 20
Relationship CO2 Fluxes and Enviromental Variable 24
Discussion 26
Environmental variables 26
Contribution of SRh to SRt 27
5 CONCLUSION AND SUGGESTION
Conclusion 29
Suggestion 29
6 REFERENCES 30
LIST OF TABLES
1 Soil physical and chemical properties in the forest, OP1 and OP5 during the sampling period in Tanjung Puting, Central Kalimantan,
Indonesia. Mean ± SE (n) 20
2 Monthly average of and annual soil respiration before and after re-trenching in the forest and 10 month (OP1), 5 year old (OP5) didn’t included because no apply re-trenching. Total respiration (SRt) was measured at two distinct spatial position (close to tree - CT and far from tree - FT); heterotrophic respiration (SRh) was monitored in plot without trees. Data are presented as
mean ± SE (n) 23
3 Cumulated soil total (SRt) and heterotrophic (SRh) respiration rates (Mg CO2-C ha-1 y-1) and contribution of SRh to SRt (% SRh) during the whole monitoring period (13 months) and
during the before and after re-trenching periods. The land-uses are forest (F), one (OP1) and five (OP5) year old oil palm plantations
on peat in Kalimantan, Indonesia 23
LIST OF FIGURES
1 Research framework 4
2 Global distribution of tropical peatland in the world
(Page et al. 2011) 5
3 Oil palm distributions in Sumatra and Kalimantan
(Sources: Miettinen et al. 2012a) 7
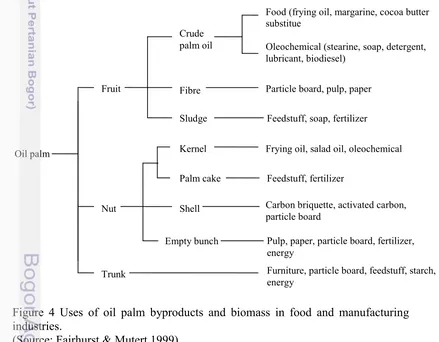
4 Uses of oil palm byproducts and biomass in food
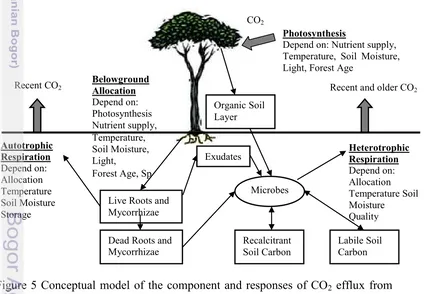
and manufacturing industries (Source: Fairhurst & Mutert 1999) 8 5 Conceptual model of the component and responses
of CO2 efflux from soil. (Sources: Ryan & Law 2005) 9 6 Research study in a primary peat swamp forest in national park
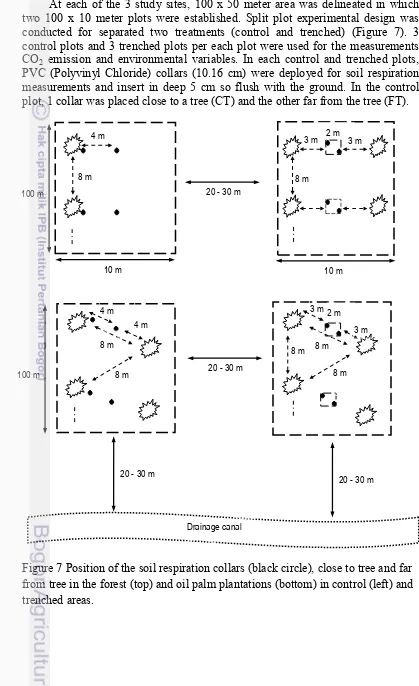
area and oil palm plantation in a border national park 11 7 Position of the soil respiration collars (black circle),
close to tree and far from tree in the forest (top) and
oil palm plantations (bottom) in control (left) and trenched areas 13 8 Monthly mean air temperature (a), soil temperature (b),
in the forest (dashed line, solid triangle), OP1 (solid line,
open circle) and OP5 (solid line, solid diamond) 17
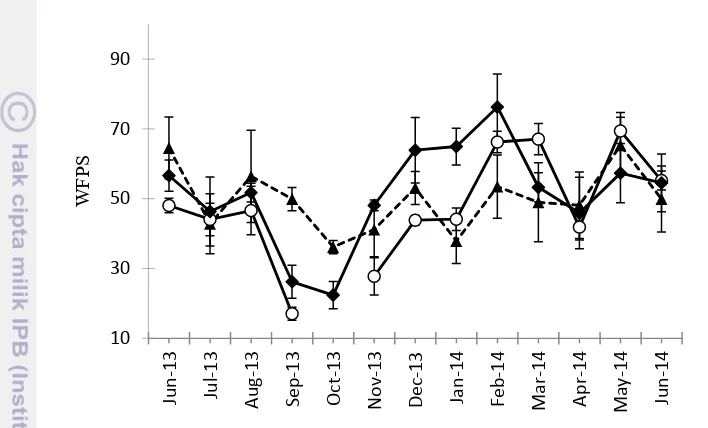
9 Monthly mean WFPS (water-filled-pore space) in the forest (dashed line, solid triangle), OP1 (solid line, open circle)
and OP5 (solid line, solid diamond) 18
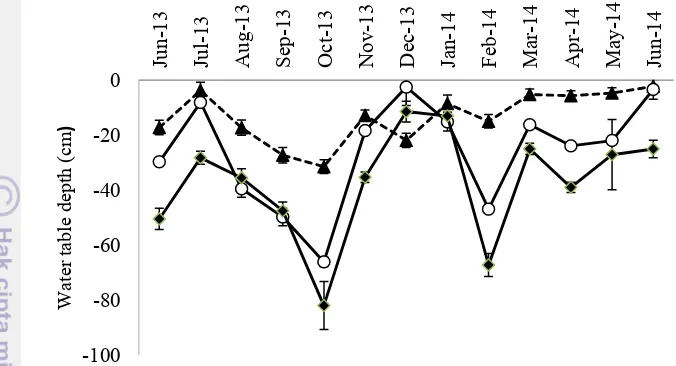
10Monthly mean range water table depht in 2 in the forest (dashed line, solid triangle), OP1 (solid line, open circle)
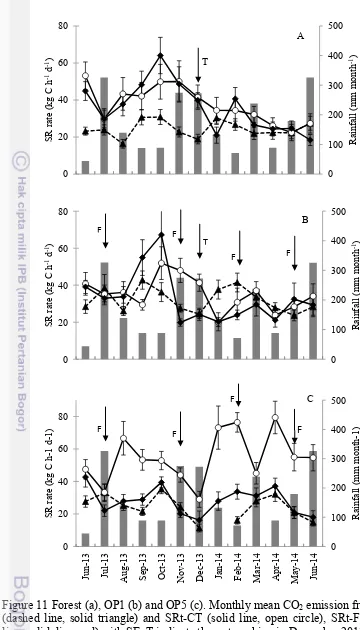
11Forest (a), OP1 (b) and OP5 (c). Monthly mean CO2 emission from SRh (dashed line, solid triangle) and SRt-CT
(solid line, open circle), SRt-FT (solid line, solid diamond)
with SE. T indicate the re-trenching in December 2013 21 12Relationship soil respiration and environmental variable
(Data show with P-value < 0.05) 25
13Relationship soil respirations and soil temperature (A),
1
1
INTRODUCTION
Background
The largest area (68%) of tropical peatlands is located in Southeast Asia (Yu et al. 2010). Indonesia alone hosts 15-21 million hectares of peatlands and about 14-18% of them are located in central Kalimantan (Wahyunto et al. 2003, 2004, 2006, Haryono et al. 2011). Peat swamp forests have significant global carbon (C) pools and store most of their C in the peat (Murdiyarso et al. 2009). These large amounts of C in the peat have accumulated over millennia as the result of a simultaneous high primary productivity but low decomposition rates in waterlogged conditions. Peat C stores of Indonesia, Kalimantan and Central Kalimantan were recently estimated to amount to 28.1, 9.4 and 6.1 Pg C, respectively (Warren et al. 2015).
Southeast Asian peat swamp forests are under being converted to agriculture at high rates. Peat swamp forest deforestation rate has been higher than that of other forest types during 2000-2010 (1.5-2.2% per year) (Miettinen et al. 2012b). In comparison, during the same period, annual deforestation rates of mangrove, lowland evergreen forests, lower and upper montane forests were 1.3, 1.2, 0.2 and 0.4%, respectively. At such a rate of deforestation, Southeast Asian peat forests may disappear by 2030. In Kalimantan, 51% of peatlands were forested in 2005 but the proportion decreased to 48% in 2010 (Miettinen & Liew 2010, Miettinen et al. 2012a). Limitations for land and increasing demand for agricultural development especially oil palm plantations are the main reasons driving the high rates of peat swamp forest conversion. The expansion of industrial oil palm plantations on peat in Malaysia and Indonesia between 1990 and 2010 was approximately 2.15 million ha (Miettinen et al. 2012b). In Kalimantan, peat forest conversion to oil palm plantation increased from 3% in the 1990s to 16% in the 2000s (Carlson et al. 2013).
Peat forest conversion to oil palm plantation implies drastic vegetation cover changes and drainage of the land, which turns the carbon sink into a source (Hergoualc’h & Verchot 2013). The conversion is estimated to release as much as 427 Mg C ha-1 over 25 years (Hergoualc’h & Verchot 2011, Hergoualc’h & Verchot 2013, Drösler et al. 2014). Fires used for land-clearing are sometimes uncontrolled and release massive emissions of greenhouse gases to the atmosphere which is the cause of major international concern (Gaveau et al. 2014).
2
soil fauna) (Ryan & Law, 2005, Dalun et.al. 2011) however only the second component of the respiration contributes to peat C loss to the atmosphere (Ryan & Law. 2005, Hergoualc’h & Verchot 2011). Determining the contribution of autotrophic and heterotrophic respiration to total soil respiration is difficult. For this various methods have been developed and used under both laboratory and field conditions. These include root trenching, root biomass regression, tree girdling, measuring respiration of excised or living roots and incubation of root-free soil. Isotopic methods include continuous or pulse labelling of shoots in 14
CO2, air CO2 enrichment, radiocarbon dating of soil CO2, bomb-14CO2, and 18O of CO2 (Kuzyakov, 2006). All methods present biases and uncertainties. Isotopic methods allow non-destructive partitioning but are expensive and not always applicable (Ryan & Law 2005). Among the non-isotopic methods available only the trenching and soil incubation methods are adequate for comparatively evaluating the components of soil respiration in a peat swamp forest and an oil heterotrophic CO2 soil respiration. We combined the trenching method with the dynamic closed chamber technique to measure total and heterotrophic soil respiration over a year (from June 2013 to June 2014). We also examined inter-relationships between soil respiration and environmental variables, including climatic variables, physicochemical soil properties and root density.
Scope of Study
This research focused on the contribution of heterotrophic component to total soil respiration (microbes and soil fauna) from tropical peat swamp forest and oil palm plantation ecosystems. The influence of environmental variables such as soil moisture, air and soil peat temperature, water table depth and litterfall on heterotrophic and total soil respiration was also assessed. Heterotrophic respiration (SRh) is important C source, which directly related to CO2 concentration in the atmosphere. Soil respiration or CO2 emissions were measured with two treatments (total respirations and heterotrophic respirations), using a trenched method.
Objective Study
The objectives in this research were:
1. Quantify heterotrophic and total soil respiration associated with conversion peat swamp forest to oil palm plantation.
3
Research Benefits
The benefits in this research were :
1. Input to the IPPC report to update CO2 emissions factor peat swamp forest and oil palm plantations.
2. As a robust scientific reference to estimate the contribution of heterotrophic component to total soil respiration in both land use types.
Hyphotesis
The hypothesis in this research were
1. Contribution heterotrophic respiration in the peat swamp forest is lower than that in the oil palm plantation.
2. CO2 emissions are strongly related with water table depth in both ecosystems (tropical peat swamp forest and oil palm plantations).
4
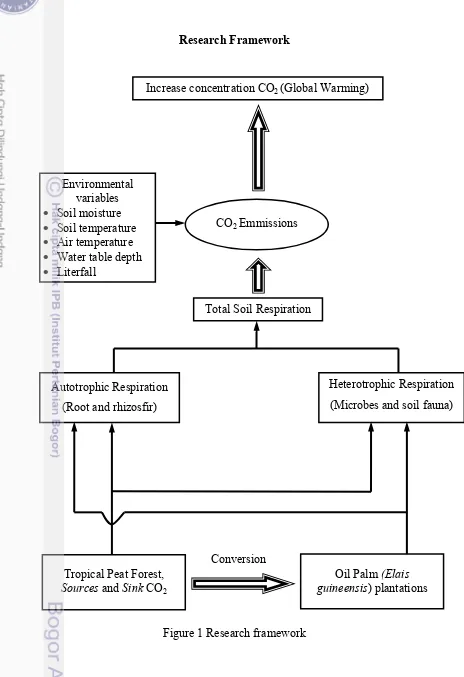
Research Framework
Figure 1 Research framework
Increase concentration CO2 (Global Warming)
Environmental variables Soil moisture Soil temperature Air temperature Water table depth Literfall
CO2 Emmissions
Total Soil Respiration
Autotrophic Respiration
(Root and rhizosfir)
Heterotrophic Respiration
(Microbes and soil fauna)
Tropical Peat Forest,
Sources and Sink CO2
5
2 LITERATURE REVIEW
Tropical Peat Swamp Forest
The presence of peatlands in Southeast Asia was first reported by John Andersen in 1974. In the report, he described the peat deposits in the Riau region of Sumatra, Indonesia. In the 19th century reported extensive peatlands in other parts of Sumatra, as well as in Kalimantan and Sarawak (Page et al. 2006). Most peatlands in Southeast Asia is found in Indonesia 83.5% (206.950 km2), following Malaysia 10.4% (25.889 km2), Papua New Guinea 4.4% (10.986 km2) and others such as Philippines 0.3%, Thailand 0.3%, Vietnam 0.2% and Brunei 0.4% (Page
et al. 2011). Southeast Asia have 56.2% from the total global tropical peatland, followed by South America 24.4%, Africa 12.7%, Central America and Caribbean 5.3% and other Asia 1.4%.
Figure 2 Global distribution of tropical peatland in the world (Page et al. 2011) Peatlands are important terrestrial wetland ecosystems in which the production of organic matter exceeds its decomposition. Tropical peatland have stored a large amount carbon in the world because contains biomass highest more than mineral soils. Moreover, tropical peatland play a significant role in supporting biodiversity included unique and endemic species. Ecosystem peatland have developed over millennial time scale and the natural state support a vegetation cover peat swamp forest (Page et al. 2006). Several factors influence peat formation and preservation, including a positive climatic moisture balance (precipitation minus evaporation), high-relative humidity, topographic and geological conditions that favor water retention, and low substrate pH and nutrient a viability (Page et al. 2006).
6
Undisturbed, lowland ombrogenous peatlands support peat swamp forest, freshwater swamp forest are associated with geogenous peatlands. Tropical peatlands is the large area and carbon storage, although found in all humid tropical regions (Page et al. 2011).
In Southeast Asia, peatlands in this region cover an area about 247.778 km2 and store approximately 68.5 Gt carbon in the peat, and peat carbon store is estimated to be 77% of the carbon in all tropical peatland an about 11-14% of the global peatland carbon pool (Page et al. 2011). Peat swamp forest usually are found in the lowlands, low altitude in sub coastal zone, are aligotrophic terrestrial wetland ecosystem and have high soil acidity (pH less than 4) and low nutrient. Water and nutrient supply to the ecosystem only from rainfall (ombrogenous), peat swamp forest usually waterlogged conditions represent soil provent dead leaves and wood from fully decomposing.
Tropical peat swamp forest in Southeast Asia cover very large area at altitude from sea level to about 50 meter above mean sea level, especially near to the coast of East Sumatra, Kalimantan, Timor Leste, papua New Guinea, Brunei, Malaysia and Thailand (Rieley et al. 1996). Peat swamp forest have a unique characteristic, high rainfall rates, hig temperature, high relative humidity, high water table during the periode will promote anaeorobic decomposition and peat breakdown will be slowly (Rieley et al. 1996). Peat swamp forest is formed from the decay of organic matter, in the field of scence know as a peat soil Histosols, or popularly known as a peat. According to the Soil Survey Staff (2003), organic soil materials with a diameter <2 mm and comply with one of the following:
1. Saturated water less than 30 days (cumulative) and contains C-organic by 20% or more.
2. Saturated water less than 30 days or more than per year (cumulative) and contains C-organic (not included life root) as a 18% or more (equal with 30% organic matter or more) fraction mineral soil contains clay 60% or more.
3. 12% or more (equal with 20% organic matter or more) fraction mineral soil without clay contains.
4. 12% add (clay percent x 0.1) fraction mineral soil contain less than from clay 60%.
In global soil classification, peat soil popularly known as a organosol or histosols its is soil layer organic material with specific gravimetric in moisture conditions <0,1 g cm-3 with thickness >60 cm or with organic layer >0,1 g cm-3 with thickness >40 cm (Soil Survey Staff, 2003). Classification peat can know from maturity level soil:
1. Sapric (mature) its decaying peat already advance and original material not recognized, dark brown to black, and when crushed fiber content <15%.
2. Hemic (half mature) its decaying a half-otten, a half original material recognized, brown color, when crushed fiber content 15-75%.
7
Oil Palm Plantations
Oil palm has a Latin name is “Elaesis guineensis” it’s originated from in
West and Central Africa. Oil palm is a native habitat of oil palm in tropical rainforest with 1780-2280 mm annual rainfall and temperature range of 24-30°C. Production or grow of Oil palm 3-8 time more oil from a given area than any other tropical or temperate oil crop and most of crude palm oil is used in foods. In scale of agricultural, established oil palm usually spacing for planted at a 9 m by 7.5 m and resulting 148 palms per ha and produce one new frond every 3 weeks (Sheil et al. 2009). Oil palm introduced to Southeast Asia in 1917, and in 1966 Indonesia and Malaysia began to dominate world trade in palm oil taking over from Nigeria and Congo (Poku, 2002). Southeast Asia is an ideal condition for productions oil palm because seasonal droughts at highest tropical latitudes greatly reduce yields (Basiron, 2007).
The first oil palm established in Peninsular Malaysia in 1917 (Sheil et al.
2009). Industry oil palm plantations a threat to the existence and was destroyed tropical peat forest in Indonesia and Malaysia, profitable businesses values was contribute essentially to increasing economic, where the NPV (net present values) of oil palm agriculture reach about $3835-9630 per ha and it is much more profitable than conserving forest stand (Murdiyarso et.al. 2010). Globally, Indonesia and Malaysia accounts about 90% of the 36 million tones of CPO produced per annum (USDA 2008). In 1967 production oil palm in Indonesia more or less 168.000 tones with lands 105.808 ha, and in 2006 production oil palm increase 16.4 million tones with land 6.2 million ha. Industry oil palm growing up following demand to product from palm oil, but the problems arises when the forest is converted to oil palm plantations especially in peat forest. A major driver of deforestation peat forest in Indonesia it’s easier to get permit from government for oil palm development. In figure 3 below showed land use change from affect oil palm plantations development in peat forest in Sumatra and Kalimantan.
8
Oil palm industry increasing faster because many products depend of palm oil, product included fruit, nut and trunk with good management would be to multiple use of byproduct and can increase the value, profit and reduce waste.. Oil palm industry can achieve almost zero pollution discharge, not disturbance environmental condition with a combination of reuse, recycling, using solid and liquid wastes, and appropriate energy management (Chavalparit et al. 2006). Product of palm oil divided into 3 parts it’s a fruit, nut and trunk show in figure 4. Fruit from oil palm produce crude palm oil, fibre and sludge where the products use for food, oleochemichal, particle board and feedstuff. Other part such a nut produce kernel, palm cake, shell and empty bunch. Trunk with is considered as a waste can use be a value commodity such as furniture and other.
9
Soil Respiration
Soil respiration is very important for quantifying either the change in C stocks or in C fluxes in the ecosystem (IPCC 2006). Soil respiration is the sum of autotrophic respiration (root and rhizosphere) and heterotrophic respiration (microbes and soil fauna) (Ryan & Law, 2005, Dalun et al 2011) however only the heterotrophic respiration contributes peat C loss into the atmosphere (Hergoualch’h & Verchot 2013, Murdiyarso et al. 2010). Heterotrophic respiration in each land use change may be assessed by applying to soil respiration rates a percentage attributed to organic matter decomposition (Hergoualch’h & Verchot 2013). In terrestrial ecosystems, soil respirations are the major pathway for carbon loss and input from and to the atmosphere, because we know that plant metabolism or the decomposition of recently produced organic material. In the carbon cycle change the belowground carbon pools can have a major impact on carbon storage and change carbon flux to the atmosphere (Ryan & Law. 2005).
Indicator of ecosystems metabolism and fine-scale process can estimate with measurement soil respiration. To estimate belowground carbon allocation required integrated measurement (Ryan & Law. 2005). Soil respiration and aboveground processes are strongly linked, but the links can be complicated (Figure 5). Photosynthesis supply carbon substrate for root metabolism and growth and a decrease in substrate supply can decrease soil respiration within days (Hogberg et. al. 2001). Production of litter, timing and allocation to roots, mycorrhizae and exudates can also alter soil respiration and carbon storage belowground. Soil respiration measurement themselves are poorly linked to changes in belowground carbon pools or to the controls such change.
Figure 5 Conceptual model of the component and responses of CO2 efflux from
Recent CO2 Recent and older CO2
10
Soil respiration (autotrophic and heterotrophic respirations) represents biological production in the ecosystems for the CO2 fluxes from the soil surface and released to the atmosphere (incresases or decreases) from interval time. Quantify carbon balance of ecosystems is important, the rate that litter (including large wood componenets), decomposes (above and belowground) can be estimated (Waring & Running 2007). Tropical peat forests absorb CO2 from the atmosphere and store in tree biomass, above and below grounds in the peat ecosystem, but can be sinks for the Green House Gass (GHG) emissions when the forest converted to other land use change. Forest degradation, deforestation, land-use change and forest fires are main reasons of increasing of CO2 emissions from tropical peatlands.
CO2 is the most abundant trace gas in the atmosphere (401.30 ppm, parts per million or μl per liter) in July 2015, (NOAA, 2015). CO2 is produced in soil by microbial metabolism during organic matter decomposition. Thus the major controls on its productions are essentially those that influence general heterotrophic microbial activity (Schimel & Holland 1998). In the context of understanding CO2 dynamic from a global perspective, climate is the most important factor, with substrate quality second. Decomposition is slow in cool, water logged environment, leading to the buildup of thick layer of decaying material, or peat. Peat accumulation reduces the amount of CO2 returned to the atmosphere, and peat account for roughly 24 of total soil carbon storage worldwide (Schimel & Holland. 1998).
Carbon begins its cycle throught forest ecosystem when plant assimilate atmospheric CO2 through photosynthesis into reduced sugar. Usually about half the gross photosynthesis products produced (GPP) are expended by plants in autotrophic respiration (Ra) for the the synthesis and maintenance of living cells, releasing CO2 back into the atmosphere. The remaining carbon products (GPP -
11
3 MATERIAL AND METHOD
Site Description
The research site was located in the province of Central Kalimantan (2’35’- 3’20’ S and 111’50 - 112’15 E) in Indonesia (Figure 6). It is situated about an hour from downtown in Pangkalan Bun, Kota Waringin Barat districts. Tanjung Puting National Park is bordered to Java Sea to the west and south, the national park covered approximately 400.000 ha. The climate categorized as humic tropical. Tanjung Puting National Park displays minimum and maximum temperatures of 18 - 21°C and 31 - 33°C (MoEF, 2015). The annual rainfall is around 2180 mm with a dry month occurring between May and September (MoEF, 2015).
The park was separated with local community by Sekonyer River to the north and Seruyan River to the east. Tanjung Puting National Park is a famous as a place protection, conservation and rehabilitation center for orang-utan (Pongo pygmaeus), in addition it was found gibbons (Hylobates spp) red langur (Presbytis rubicunda) and proboscis monkey (Nasalis larvatus).
12
Our study included 2 land use types: primary peat swamp forest and oil palm plantation. The forest site (2’49’21” S, 111’50’24” E) was inside the national park and the two oil palm sites (OP1, 2’47’33” S, 111’48’36” E; OP5, 2’47’28” S, 111’48’7” E) were located about 6 km away from the forest site across the Sekonyer river. The forest site, locally known as Pesalat, is dominated by Dipterocarpaceae (Shorea spp, vatica sp), Phyllanthaceae (Baccaurea macrophylla) and Lauraceae (Litsea sp).
Based on a 100 x 10 meter transect survey, Pesalat consisted of trees with diameter ranged from 8 cm to 60 cm with peat depths ranged from 115 cm to 280 cm. The forest floor is uneven with the presence of 20 - 30 cm tall hummocks around tree trunks and hollows in between hummocks. The hummocks which were formed of roots, accumulated decomposing litter and peat, remain above the water surface during most the year.
We selected 2 different ages of oil palm plantations: 10 months (OP1) and 5 years (OP5) old. Both plantations were classified as small-scale plantations (1 - 1.5 ha) and owned by farmers in the Bedaun village. Both plantations received an average fertilization rate of 97 kg N ha-1 in the form of urea or NPKevery three months, or with annual rates of 300 kg N ha-1 yr-1. Weeds and pests were controlled by regularly applying herbicides around of the palm with radius approximately 1 - 2 m from the palm.
We surveyed the study plots in the beginning of June 2012. The survey used transects methods by 100 x 20 m. Peat depth and composition of vegetation in this area were assessed. Location forests were chose represented the condition primary forest with high canopy cover. Characteristic of a primary peat swamp forest represented hollow and hummock spatial variability. Hummock represented a drier condition because of root existence around tree that created a highest elevated area. In addition, hollows are usually saturated during the rainy season.
13
Experimental Design
At each of the 3 study sites, 100 x 50 meter area was delineated in which two 100 x 10 meter plots were established. Split plot experimental design was conducted for separated two treatments (control and trenched) (Figure 7). 3 control plots and 3 trenched plots per each plot were used for the measurements CO2 emission and environmental variables. In each control and trenched plots, PVC (Polyvinyl Chloride) collars (10.16 cm) were deployed for soil respiration measurements and insert in deep 5 cm so flush with the ground. In the control plot, 1 collar was placed close to a tree (CT) and the other far from the tree (FT).
Figure 7 Position of the soil respiration collars (black circle), close to tree and far from tree in the forest (top) and oil palm plantations (bottom) in control (left) and trenched areas.
20 - 30 m 100 m
10 m 4 m
8 m
20 - 30 m
10 m 3 m 2 m 3 m
8 m
Drainage canal 20 - 30 m
20 - 30 m 100 m
8 m
8 m 4 m
4 m
8 m
3 m 2 m
8 m
8 m 8 m
14
In the forest, these 2 spatial positions coincided with a hummock and a hollow. In the plantations the CT position (about 0.3 m from the palm) is where the fertilizer is applied and the FT position was set at mid-distance between 2 palms (i.e. at about 4 m from the palm trunk). In the trenched plots the 2 spatial positions were chosen randomly, as these subplots were free of trees. In the oil palm plantations, the distance between the control subplots was about 8 m in accordance with palm spacing. A similar design was applied in the forest. The distance between a control subplot and its trenched pair was about 20-30 m. The plots were initially trenched in June 2012, 1 year prior to the beginning of the measurements (June 2013) and re-trenched in December 2013, with the exception of the OP5, which was not re-trenched because the plantation owner refused. The trenches were 1 meter deep (depth at which no coarse roots were observed) and 0.2 meter wide and were made using a chainsaw. We lined the inner side of the trenches with construction plastic and subsequently backfilled them. To minimize soil disturbance we built boardwalks to access each measurement point. All equipment was installed at least 1 month before the measurements started.
Soil CO2 respiration measurement
Total soil respiration (SRt) where SRt (SRt-CT and SRt-FT) and heterotrophic soil respiration (SRh) were monitored monthly from June 2013 to June 2014 (13 months period) using a portable infra-red analyzer (EGM-4 Environmental Gas Monitor) connected to a Soil Respiration Chamber (SRC-1) (PP System, Amesburry, USA). At each position a PVC collar (inner diameter of 10.16 cm, height of 5 cm) was inserted into the ground to a 5 cm depth. Before each measurement the collars were manually fanned in order to remove any accumulated CO2. Then the soil respiration chamber was placed on top of the collar and CO2 concentrations were recorded automatically at 4.5 seconds intervals for 80 to 124 seconds. The CO2 flux was calculated by the EGM from the linear increase of CO2 concentration in the headspace with time.
Mean monthly soil respiration rates were calculated for each spatial position (in the control plots only) in each treatment (control and trenched) of each land use. Annual total and heterotrophic soil respiration rates were calculated by integration of monthly fluxes using a linear interpolation between measurement dates (Hergoualc’h et al. 2008) for a 365 day year. Plot-scale monthly or annual total soil respiration rates were calculated as the average of the rate from the 2 spatial positions (FT, CT) in the forest.
15
Environmental variables
Rainfall data were monitored daily using weather station (Delta Ohm HD2013R, Padova, Italy) located in the OP1 and OP5. Annual rainfall was calculated as the average of cumulated annual rainfall rate from the 2 stations. Soil temperature at a 10 cm soil depth was measured using a soil thermometer probe (Reotemp Digital TM99-A, USA). Air temperature was recorded manually using a digital thermometer. The water table depth was measured in PVC tubes (2.5 cm in diameter, 2 m in length) inserted into the peat. Each of these parameters was measured at each respiration collar and concomitantly with CO2 fluxes. The gravimetric water content, bulk density and water-filled pore space (WFPS) were also determined monthly by collecting at a 10 cm depth six soil samples using a metallic ring (10.16 cm in diameter x 10 cm long). The samples were collected outside of the soil respiration subplots in order to not disturb long-term measurements and included 3 replicates located close to tree and 3 replicates located far from tree 3. The soil water-filled pore space (WFPS) was calculated based on Haney & Haney (2010):
S l wat nt nt ht t l ht n l ht n l
S l bul n t ht n l lu l
S l t S l a t l n t a u t b S l bul n t
lu t wat nt nt a t wat nt nt bul n t
S lu t wat nt ntS l t
16
root area. Root samples were separately into died-roots and living-roots, and then the samples were oven-dried at 60° for 2 - 3 days to determine the dry mass.
At each site, we collected 3 composite soil samples (CT and FT confounded) at a 10 cm depth for soil chemical analysis at the Forestry Faculty of Bogor Agricultural Institute (IPB). The soil pH was determined in potassium chloride (KCl) and water (H2O). Exchangeable cations (Ca, Mg, Na and Ka), Cation Exchange Capacity (CEC) and base saturation were determined by displacing these ions from the soil colloids with ammonium acetate adjusted to pH 7 (Chapman, 1965). Concentrations of C and N from dried peat samples were analyzed using an induction furnace C/N analyzer (LECO Corporation, St. Joseph MI, USA). In addition we collected 3 soil samples respectively from CT, FT and T plots to quantifiying microbial biomass. The microbial biomass was analyzed by the Indonesian Soil Research Institute (ISRI), Bogor using a plate-count method.
Statistical Analysis
Mean monthly soil respiration (SRt and SRh) and environmental parameters were compared according to their spatial position, treatment (control and trenched) and land use type. A probability threshold of 0.05 was used to determine the significance of the effects. Statistical analysis was performed using the software Infostat. All of the measured variables were tested for normality of distribution using the Shapiro-Wilks test.
For multiple comparisons, ANOVA and the non-parametric Kruskal-Wallis test were applied for normally and non-normally distributed data, respectivey. The t-test or non-parametric Mann Whitney test were applied for normal and non-normally distributed data, respectively, to compare variables between close tree (CT) and far tree (FT) treatments.
17
4 RESULT AND DISCUSSION
Result
18
The WFPS data was normally distributed. There was no significant different across sites ( P = 0.51) (Fig. 9). The spatial position influenced WFPS in the forest and OP5 sites. A significant higher WFPS was observed at FT than CT in forest ( P < 0.001) and OP5 (P = 0.001). In contrast, spatial positions (CT and FT) did not significantly affect WFPS at OP1 (P = 0.45). Across sites, the highest WFPS was recorded in the OP5 (51.4%), followed by the forest 49.8%, and OP1 (47.6%).
Figure 9 Monthly mean WFPS (water-filled-pore space) in the forest (dashed line, solid triangle), OP1 (solid line, open circle) and OP5 (solid line, solid diamond).
The annual rainfall during the monitoring period was high (2,112 mm y-1), and did not display any clear sesonal pattern. The wet months (monthly rainfall > 200 mm) occured in July, November and December 2013; March,and June 2014 based on Oldeman climate classification. The dry months (monthly rainfall < 100 mm) were recorded in June, September and October 2013; February and April 0.0001). The water table depth was not influenced by spatial positions at OP1 (P = 0.1).
19
forest (0.56 ± 0.09 kg/ha) and then in the OP5 (0.15 ± 0.04 kg/ha). Furthermore, the highest dead root density was found in the OP5 (0.44 ± 0.10 kg/ha), followed by OP1 (0.40 ± 0.04 kg/ha) and in the forest (0.35 ± 0.08 kg/ha).
Figure 10 Monthly mean range water table depht in 2 in the forest (dashed line, solid triangle), OP1 (solid line, open circle) and OP5 (solid line, solid diamond).
Soil Properties
The peat thickness was significantly deeper in the forest than in the oil palm plantation (Table 1). Similar to other tropical peat swamp forests, the soil in both land use types displayed a low pH, as typically reported in ombrotrophic peat ecosystem with 3.8 - 3.9 (H2O) and 2.8 - 2.9 (KCl). The Cation Exchange Capacity (CEC) values were high in all sites ranged from 80.67 to 98.32 cmolc kg-1, as commonly found in organic soil. The base saturation was significantly higher in the forest ecosystem than in the OP1 but similar to the OP5. The carbon content in the forest (48.50 ± 1.18 %) was slightly higher than those in the plantations (45.79 ± 1.86 % at OP1 and 47.38 ± 5.27 % at OP5, respectively), but the values were not significantly difference across sites (P = 0.435).
The N content in the forest ecosystem (1.62 ± 0.08 %) was significantly higher than the overall one in the oil palm plantations (P = 0.0003). The lower N content in the oil palm plantations were observed with 1.10 ± 0.19 at the OP1 and 0.90 ± 0.16 at the OP5. The C/N ration exhibited significantly higher value in the plantations as compared to the forest. Higher N content in the forest resulted in a lower C/N ratio (31.52 ± 2.27) compared to those in the OP1 (41.21 ± 3.56) and OP5 (52.96 ± 12.10), (P = 0.0006), respectively.
20
density in oil palm plantations is higher compared to the forest due to soil compaction (Couwenberg et al. 2010; Hooijer et al. 2012).
Table 1 Soil physical and chemical properties in the forest, OP1 and OP5 during the sampling period in Tanjung Puting, Central Kalimantan, Indonesia. Mean ±
The residuals of soil respiration rates in the forest and oil palm plantations during the monitoring period were not normally distributed. The highest monthly SRt rate in the forest (57 ± 6.8 kg C-CO2 ha-1 d-1) was measured in October 2013 (Fig. 11) when the rainfall rate was low (89 mm month-1), the water table and WFPS were at their lowest level (-31.5 ± 2.5 cm and 36.2 ± 1.9%) and the air temperature was at its highest value (31.9 ± 0.7 °C). In contrast, the lowest monthly SRt rate occurred in June 2014 (22.9 ± 3.0 kg C-CO2 ha-1 d-1), when the highest rainfall rate (326 mm month-1) during the monitoring period was recorded and the highest water table level was reached (-2.2 ± 2.6 cm).
21
Figure 11 Forest (a), OP1 (b) and OP5 (c). Monthly mean CO2 emission from SRh (dashed line, solid triangle) and SRt-CT (solid line, open circle), SRt-FT (solid line, solid diamond) with SE. T indicate the re-trenching in December 2013.
22
In the oil palm plantations, the highest SRt were recorded when the rainfall rates were < 100 mm month-1, at rates of 59.6 ± 9.4 kg C-CO2 ha-1 d-1 at the OP1 in October 2013 and 58.3 ± 7 kg C-CO2 ha-1 d-1 at the OP5 in April 2014. The lowest SRt occurred in January 2014 at the OP1 (20.2 ± 4.7 kg C-CO2 h-1 d-1) and in December 2013 at the OP5 (22.6 ± 3.9 kg C-CO2 h-1 d-1) when the rainfall was high. With respect to SRh, the highest rates were measured during months of low rainfall (88-89 mm month-1) in September 2013 at the OP1 (42.8 ± 4.9 kg C-CO2 h-1 d-1) and in October 2013 at the OP5 (35.3 ± 2.8 kg C-CO2 h-1 d-1). The lowest rates were observed at the OP1 (23.7 ± 2.9 kg C-CO2 h-1 d-1) and OP5 (11.4 ± 2.4 kg C-CO2 h-1 d-1) in the wet months of May 2014 (rainfall 179 mm month-1) and December 2013 (rainfall 273 mm month-1), respectively. The highest rates of SRt-CT and FT were found when rainfall rate were < 100 mm month-1, at rate 51.9 ± 8.8 kg C-CO2 ha-1 d-1 in October 2013 and 54.9 ± 9.7 kg C-CO2 ha-1 d-1 September 2013 in OP1, respectively. Similar to OP1, SRt-CT and FT rates were influenced by the rainfall rate in OP5, which the highest was found in April 2014 and June 2013 and the lowest rate SRT-CT and FT was found in December 2013.
23
Contribution of SRh to SRt was higher in wet months i.e in June 2014, compared to other months. In OP1, contribution SRh to SRt ranged from 71 to 151%. In the OP5, contribution SRh to SRt ranged from 29% to 119 %. The annual SRt rate was higher in the forest than in the OP plantations. Using the contribution of SRh to SRt before re-trenching period in the forest (57%) and in the OP1 (89%) and for the whole monitoring period in the OP5 (87%), we estimate annual SRh rates of 7.5 ± 0.3, 10.3 ± 0.3 and 9.2 ± 0.4 Mg CO2-C ha-1 y-1 in the forest, OP1 and OP 5, respectively.
Table 2 Monthly average of and annual soil respiration before and after re-trenching in the forest and 10 month (OP1), 5 year old (OP5) didn’t included because no apply re-trenching. Total respiration (SRt) was measured at two distinct spatial position (close to tree - CT and far from tree - FT); heterotrophic respiration (SRh) was monitored in plot without trees. Data are presented as mean ± SE (n)
24
Relationship CO2 Fluxes and Environmental Variable
We observed CO2 fluxes (SRt and SRh) in three study sites and its correlations with environmental variables such as, mG: Gravimetri soil moisture, BD: Bulk density, WFPS: Water filled-pore space, WT: Water table depth, soil and air temperature, and litterfall (only forest site). We presented correlation if it is significant at the P < 0.05 from monorelationship between soil respiration and environmental variable, liner or no linear.
In the forest, SRt had a strong positive correlations with WT (R2 = 0.77, P = 0.000) respectively. The SRh in forest and oil palm plantations did not show any significant correlations with environmental variables. At the OP1, SRt had a positive correlation with BD (R2 = 0.51, P = 0.023), WT (R2 = 0.64, P = 0.013), air temperature (R2 = 0.65, P = 0.009) and soil temperature (R2 = 0.61, P = 0.012). The SRh did not show any significant relationship with environmental variables. At the OP5, SRt has a positive correlation with rainfall (R2 = 0.65, P = 0.001), while SRh did not show any correlation with environmental variables.
25
Figure 12 Relationship soil respiration (SRt and SRh) and environmental variable (data show with P-value < 0.05).
* F-C (forest control), OP1-C (oil palm 10 month control) and OP5-T (oil palm 5 years old control).
26
Figure 13 Relationship soil respirations and soil temperature (A), soil respiration and water table depth (B).
Discussion
Environmental variables
The highest air temperature was recorded in OP1 because relatively smaller vegetation cover areas at OP1 compared to other sites. Vegetation cover is not only influenced air temperature but also peat soil temperature (Rieley et al. 1992). A dense forest canopy cover in the forest reduces penetration of solar radiation into the forest floor, so that the peat temperature in this ecosystem is constantly low, about 25.5°C.
Precipitation influenced the fluctuation of water table depth especially in the fores site. The lower bulk density in the forest compared to those OP1 and OP5 was expected as a result of drainages or canals establishment and soil compaction in the agricultural sites. The higher bulk density reduces water absorption in the oil palm plantation and it also contributes to accelerate microbial decomposition due to lowered water level. Bulk density in oil palm plantations was higher compared to forest site, because peat soil conversion by clear cutting, burn and drainage led to soil subsidence such as a compaction (Couwenberg et al. 2010; Hooijer et al. 2010).
27
nutrient, although they have no correlation between CO2 flux with the rainfall, but rainfall is correlated to water table.
The air temperature controls SRt at forest and OP1 sites. Relationship between SR and air temperature was also observed in temperate deciduous and coniferous forests (Raich & Potter, 1995), but the relationship was not found in the tropical oil palm plantation ecosystem in Riau, Indonesia (Marwanto & Agus 2014). Increase of air temperature affects photosynthesis rates leading to higher exudation which serve as a C sources for microbes and improve soil microbial activity CO2 production correlation with decomposition process (Yuste et al. 2007).
Contribution of SRh to SRt
SRh is an useful indicator of peat C loss into the atmosphere and necessary for understanding the implication of land-use change on soil carbon cyling (Hergoualc’h & Verchot. 2011, Wösten et al. 1997, Rieley et al. 2008, Couwenberg et al. 2010, Hooijer et al. 2010). Developing oil palm plantations is more profitable than conserving forest stands (Murdiyarso et al. 2010) for the Indonesian economy however the long term ecological and economical implications of such a conversion in peatlands has not been addressed and evaluated. We measured SRt and SRh from conversion peat swamp forest into oil palm plantations until 13 months, and separated before and after re-trenched.
Soil CO2 emissions in the forest, the value SRt 15.4 ± 0.5 Mg C-CO2 h-1 yr-1 before re-trenching, and decreased after re-trenching 10.7 ± 0.4 Mg C-CO2 h-1 yr-1, but SRh before re-trenching 8.8 ± 0.3 Mg C-CO2 h-1 yr-1 and increased 9.0 ± 0.4 Mg C-CO2 h-1 yr-1 after re-trenching. At OP1, SRt 13.5 ± 0.7 Mg C-CO2 h-1 yr -1
before re-trenched and 9.6 ± 0.6 Mg C-CO2 h-1 yr-1. Simillar with SRh, before re-trenching 12.0 ± 0.5 Mg C-CO2 h-1 yr-1 and after re-trenching decreased 11.7 ± 0.5 Mg C-CO2 h-1 yr-1. OP5 did not applied re-trenching because the owner disagree for this application.
In the annual soil CO2 emissions, higher SRt was found in the forest 13.1 ± 0.5 Mg C-CO2 h-1 yr-1, OP1 11.7 ± 0.5 Mg C-CO2 h-1 yr-1 and OP5 10.6 ± 0.4 Mg C-CO2 h-1 yr-1. The SRt at the OP sites are not comparable with previous studies i.e 15.4 ± 6.4 Mg C-CO2 h-1 yr-1 from oil palm plantation in Sarawak, Malaysia (Melling et al. 2005), for 6 and 15 years old palm plantation in Riau are comparable with value, 12.17 ± 3.05 and 13.02 ± 5.8 Mg C-CO2 h-1 yr-1 (Dariah
et al. 2013) and a meta-analysis by Hergoualc’h & Verchot (2011) which accounted for 12.7 ± 2.7 Mg C-CO2 h-1 yr-1 for oil palm plantation within various ages in Southeast Asia. However, the SRt from oil palm plantation in Tanjung Puting is lower than oil palm plantation in Jambi (28.4 ± 1.2 Mg C-CO2 h-1 yr-1) by Comeau (2013).
28
The contribution of SRh to SRt before re-trenched in the OP1 represented 89%, followed forest 57%, contribution after re-trenched show of SRh to SRt in the OP1 123%, followed forest 88%, in OP5 did not applied re-trenched because the owner disagree. Total contribution of SRh to SRt study periods, in the OP1 represented 89%, followed OP5 87% and forest 57% it contrast with result study in Sarawak, Malaysia when the forest showed contribution about 40% and oil palm 4 years old 38% (Melling et al. 2013). At the OP1, microbial decomposition is more active because the higher availability of labile carbon at the OP1 than OP5, where the older plantation contains a higher recalcitrant carbon (slow to decompose) is dominated. Labile carbon is significantly reduced during the first year of agricultural establishment (Schlesinger & Bernhard, 2013). In addition, the higher air and soil temperatures at the OPI 1 than OP5 will accelerate microbial decomposition. The higher contribution of heterotrophic respiration at the OP1 than OP1 is also affected by difference on roots biomass (Melling et al. 2013), followed OP5 and forest. In the forest with saturated condition, decomposition rate slowly although c source in the forest more than in OP.
The contribution of SRh was always lower than OP, although by the availability of source labile C in the forest is higher than OP, fresh litterfall is a major carbon input in the forest, while the litterfall at the OP is significantly reduced. This factor couldn’t compensate the effect of higher soil and temperatures effects on heterotrophic respiration. Microbial activity as a decomposer is largely limited by the supply of labile subsrate found in new detritus, such as foliage and fine root litter (Ryan & Law. 2005)
29
5
CONCLUSION AND SUGGESTION
Conclusion
Annual heterotrophic respiration (emissions) from oil palm plantations was 30-32% higher than the emissions produced from natural forests. Mean heterotrophic soil respiration rate in the forest were 7.5 ± 0.3 Mg C-CO2 ha-1 yr-1, amounted to 57% of total respiration (13.1 ± 0.5 Mg C-CO2 ha-1 yr-1). In the OP1, heterotrophic respiration rates were about 10.3 ± 0.3 Mg C-CO2 ha-1 yr-1 or 89% of total soil respiration (11.7 ± 0.5 Mg C-CO2 ha-1 yr-1). In the OP5, heterotrophic respiration rates were 9.2 ± 0.4 Mg C-CO2 ha-1 yr-1), or 87% of total soil respiration (10.6 ± 0.4 Mg C-CO2 ha-1 yr-1). Our results suggest that establishment of oil palm plantation in tropical peat swamp forest, leads to higher losses from heterotrophic respiration to the atmosphere.
In addition to increasing of decomposition rate, the conversion of primary peatswamp forest to oil palm plantation alters the climatic parameters (increasing of soil and air temperature and decreasing water table level), soil key properties (higher bulk density, lower WFPS). The primary forests is the most suitable ecosystem in the tropical peatland ecosystem, therefore, avoiding oil palm plantations establishment in this ecosystem is urgently required as one of climate change mitigation strategy
Suggestion
30
6
REFERENCES
Basiron Y. 2007. Palm oil production through sustainable plantations. European Journal of Lipid Science and Technology 109: 289-295.
Carlson KM, Curran LM, Asner GP, McDonald Pittman A, Trigg SN, Adeney JM. 2013. Carbon emissions from forest conversion by Kalimantan oil palm plantations. Nature Climate Change 3, 283-287.
Casson A, Tacconi L, and Deddy K. 2007. Strategies to reduce carbon emissions from the oil palm sector in Indonesia. Paper prepared for the Indonesian Forest Climate Alliance, Jakarta
Chavalparit O, Rulkens WH, Mol APJ, and Khaodhair S. 2006. Options for environmental sustainability of the crude palm oil industry in Thailand through enhancement of industrial ecosystems. Environment, Development and Sustainability 8: 271–287.
Comeau LP, Hergoualc’h K, Smith JU, and Verchot L. 2013. Conversion of intact peat swamp forest to oil palm plantation: Effects on soil CO2 fluxes in Jambi, Sumatra. Working Paper 110. CIFOR, Bogor, Indonesia.
Couwenberg J, Dommain R, & Joosten H. 2010. Greenhouse gas fluxes from
tropical peatlands in Southeast Asia. Global Change Biology, 16(6),
1715-1732.
Dariah A, Marwanto S, dan Fahmuddin A. 2014. Root-and peat-based CO2
emissions from oil palm plantations. Mitigation and Adaptation Strategies for
Global Change, 19(6), 831-843.
Dalun T, Guanhjun W, Yuanying P, Wende Y, Fa FXZ, Xiaoyong C. 2011. Contribution of Autotrophic and Heterotrophic to Soil CO2 Efflux in Chinese fir plantations. Australian Journal of Botany 59. Page 26-31.
Drösler M, Verchot L, Freibauer A, Pan G, Evans CD, Bourbonniere RA, Alm JP, Page S, Agus F, Hergoualc'h K, Couwenberg J, Jauhiainen J, Sabiham S, Wang C, Srivastava N, Borgeau-Chavez L, Hooijer A, Minkkinen K, French N, Strand T, Sirin A, Mickler R, Tansey K, Larkin N. 2014. Chapter 2 Drained inland organic soils. In: Hiraishi T, Krug T, Tanabe K, Srivastava N, Jamsranjav B, Fukuda M, Troxler T. (eds). 2013. Supplement to the 2006 guidelines for national greenhouse gas inventories: Wetlands. IPCC, Switzerland.
31
Hatano AR, Inoue AT, Darung BU, Limin BSH, Morishita AT, Takaki AF, & Yamada AH. 2010. Carbon dioxide and nitrous oxide emissions associated with tropical peatland degradation. In Proceedings of the 19th World Congress of Soil Science: Soil solutions for a changing world, Brisbane, Australia, 1-6 August 2010. Symposium 4.3. 1 Impact of land-use change in unsustainable ecosystem (pp. 13-16). International Union of Soil Science (IUSS), c/o Institut für Bodenforschung, Universität für Bodenkultur.
Hergoualc’h K, Skiba U, Harmand JM, & Hénault C. 2008. Fluxes of greenhouse
gases from Andosols under coffee in monoculture or shaded by Inga
densiflora in Costa Rica. Biogeochemistry, 89(3), 329-345.
Hergoualc'h K, and Verchot L. 2011. Stocks and Fluxes of Carbon Associated With Land-use change in Southeast Asian Tropical Peatlands: A review, Global Biogeochemical Cycles. 25 GB2001. doi: 10.1029/2009GB003718.
Hergoualc’h K, and Verchot L. 2013. Greenhouse Gas Emission Factors For Land Use and Land-Use Change in Southeast Asian Peatlands. Mitigation and Adaptation Strategies Global Change Biology 19, 789-807
Hirano T, Kusin K, Limin S, Osaki M. 2014. Carbon dioxide emissions through oxidative peat decomposition on a burnt tropical peatland. Global Change Biology, 20(2), 555-565.
Hooijer A, Page S, Canadell JG, Silvius M, Kwadjik J, Wosten H, & Jauhiainen J. 2010. Current and future CO [subscript 2] emissions from drained peatlands in Souteast Asia.
Hogberg P, Nordgren A, Buchmann N, Taylor AFS, Ekblad A, Nyberg G, Ottosson-Lofvvenius M. and Read DJ. 2001. Large-scale Forest Girdling Shows That Current Photosynthesis Drives Soil Respiration. Nature 411: 789-792.
Husnain AF, Wigena P, Maswar DA, Marwanto S. 2013. Peat CO2 emissions from several land-use in Indonesia. Submitted to Mitigation and adaptation strategies for global change.
[IPCC]. Intergovermental Panel on Climate Change. 2006. Guidelines for National Greenhouse Gas Inventories Volume 4 Agriculture, Forestry and Other Land Use. Published: IGES, Japan.
Ishida T, Suzuki S, Nagano T, osawa K, Yoshino K, Fukumura K, Nuyim T.
2001. CO2 emission rate from a primary peat swamp forest ecosystem in
Thailand. Environ Control Biologi 39:305-312.
Jauhiainen J, Hooijer A, & Page SE. 2012. Carbon dioxide emissions from an Acacia plantation on peatland in Sumatra, Indonesia. Biogeosciences.
Kuzyakov Y. 2006. Sources of CO2 efflux from soil and review of partitioning
methods. Soil Biol Biochem 38, 425-448.
[MoEF] Ministry of Environment and Forestry (ID). 2015. Climate in Tanjung
Puting National Park. [Internet] [October 15, 2015]. Available online: http://tanjungputing.dephut.go.id/index.php/geofisik/iklim
Marwanto S, & Agus F. 2014. Is CO2 flux from oil palm plantations on peatland
controlled by soil moisture and/or soil and air temperatures? Mitigation and
32
Melling L, Hatano R, & Goh KJ. 2005. Soil CO2 flux from three ecosystems in
tropical peatland of Sarawak, Malaysia. Tellus B, 57(1), 1-11.
Melling L, Goh KJ, Beauvais C, Hatano R. 2007. Carbon flow and budget in a young mature oil palm agroecosystem on deep tropical peat. Paper presented at the International symposium and workshop on tropical peatland, Yogyakarta, Indonesia, 27-31 August 2007
Melling L, Tan CSY, Goh KJ, & Hatano R. 2013. Soil microbial and root respirations from three ecosystems in tropical peatland of Sarawak,
Malaysia. J Oil Palm Res, 25(1), 44-57.
Miettinen J, Liew SC. 2010. Status of Peatland Degradation and Development in Sumatra and Kalimantan. AMBIO 39, 394-401.
Miettinen J, Hooijer A, Shi C, Tollenaar D, Vernimmen R, Liew SC, Malins C, Page S. 2012a. Extent of industrial plantations on Southeast Asian peatlands in 2010 with analysis of historical expansion and future projections. GCB
Bioenergy. doi:10.1111
Miettinen J, Hoijjer A, Tollenar D, Page S, Malins C, Vernimmen R, Shi C, Liew, SC. 2012b. Historical Analysis and Projection of Oil Palm Plantation Expansion on Peatland in Southeast Asia. International Council on Clean Transportation. Washington DC.
Murdiyarso D, Donato D, Kauffman JB, Kurnianto S, Stidham M, & Kanninen M. 2009. Carbon Storage in Mangrove and Peatland Ecosystems. A preliminary Account from Sites in Indonesia. Working Paper. CIFOR.
Murdiyarso D, Hergoualc’h K, and Verchot L. 2010. Opportunities for Reducing Greenhouse Gas Emissions in Tropical Peatlands. PNAS. November 16, 2010. Vol 17, No. 46. 19655-19660.
Murdiyarso D, Dewi S, Lawrence D, & Seymour F. 2010. Indonesia’s Forest Moratorium: A Stepping Stone to Better Forest Governence? (CIFOR). [NOAA] National Oceanic and Atmospheric Administration. 2015. [Internet]
[Sept, 7 2015]. Available online: http://www.esrl.noaa.gov/gmd/ccgg/trends/ Page SE, Rieley JO, Wüst R. 2006. Lowland tropical peatlands of Southeast Asia.
Developments in Earth Surface Processes, 9, 145-172.
Page SE, Rieley JO, Banks CJ. 2011. Global and Regional Importance of The Tropical Peatland Carbon Pool. Global Change Biology 17, Page 798–818. Poku K. 2002. Small-scale palm oil processing in Africa. FAO Agricultural
Services Bulletin 148. FAO, Rome.
Raich JW, & Potters CS. 1995. Global patterns of carbon dioxide emissions from soil. Global Biogeochemical Cycle, 9(1), 23-26.
Rieley JO, Ahmad-Shah AA, and Brady MA. 1996. The Extent and Nature of Tropical Peat Swamps. In: Maltby E, Immirxi CP, and Safford RJ (Eds), Tropical Lowland Peatlands of Southeast Asia. IUCN, Gland, Switzerland, pp. 17-53
Ryan MG, and Law BE. 2005. Interpreting, Measuring, and Modeling Soil Respiration. Biogeochemistry. 73: 3-27.
Schlesinger WH, and Bernhardt ES. 2013. Biogeochemistry: an analysis of global change. Academic press.
Schimel J, and Holland EA . 1998.”Global Gases”. Sylvia, D.M, Fuhrmann, J.J.,
Hartel, P.G and D.A. Zuberer, eds. Principles and applications of soil
33
Sheil D, Puri R, Wan M, Basuki I, Van Heist M, Liswanti N, Rukmiyati RI, and Samsoedin I. 2009. Recognizing local people’s priorities for tropical forest biodiversity. Ambio 35: 17–24.
Soil Survey Staff. 2003. Key to Soil taxonomy. 9th Edition. United States Department of Agriculture. Natural Resources Conservation Service.
[USDA] United States Department of Agriculture. 2008. Palm oil: world supply and distribution. Production, Supply and Distribution Online. http://www.fas.usda. gov/psdonline/psdHome.aspx.
Yuste J, Baldocchi DD, Gershenson A, Goldstein A, Misson L, Wong S. 2007. Microbial soil respiration and its dependency on carbon inputs, soil
temperature and moisture. Global Change Biology, 13(9), 2018-2035.
Yu Z, Loisel J, Brosseau DP, Beilman DW, Hunt SJ. 2010. Global peatland dynamics since the Last Glacial Maximum. Geophys Res Lett 37.
doi:10.1029/2010GL043584
Wahyunto, Ritung S, Subagjo H. 2003. Maps of Area of Peatland Distribution and Carbon Content in Sumatra, 1990-2002. Wetlands International-Indonesia Programme & Wildlife Habitat Canada (WHC), Bogor.
Wahyunto, Ritung S, Suparto, Subagjo H. 2004. Maps of Area of Peatland Distribution and Carbon Content in Kalimantan, 2000-2002. Wetlands International-Indonesia Programme & Wildlife Habitat Canada (WHC), Bogor.
Wahyunto, Heryanto B, Bekti H, Widiastuti F. 2006. Maps of Peatland Distribution, Area and Carbon Content in Papua, 2000-2001. Wetlands International-Indonesia Programme & Wildlife Habitat Canada (WHC), Bogor.
Warren MW, Murdiyarso D, Kauffman JB, Hergoualc'h K, Birdsey R, Kolka RK. 2015. An updated appraisal of Indonesia’s immense peat carbon stocks and its vulnerability. Global Change Biology In preparation.
Waring RH, Running SW. 2007. Forest Ecosystem: Analysis at Multiple Scale. Third Edition. Elsevier. USA.
34
BIOGRAPHY
The author was born in Lebak, Banten on 14th June 1984, as the second son of 3 siblings from Kanim Diarna (father) and Siti Badriah (mother).
The author graduated from senior high school at SMAN 1 Leuwidamar in 2003. At the same year, the author was accepted at Bogor Agricultural University through the invitation of selection IPB (USMI). The author received a bachelor degree from Forest Management Department, Faculty of Forestry in 2009. The author continued to graduate School of Bogor Agricultural University at Natural Resources Management and Environmental Department in 2013.