i
DEVELOPMENT OF DEPTH SENSOR SYSTEM FOR SEABED MAPPING USES ECHO SOUNDING TECHNIQUE
ANISAH BT MOHD NOOR
This report is submitted in partial fulfillment of requirements for the degree of Bachelor in electrical engineering (Control, Instrumentation and Automation)
Faculty of Electrical Engineering
UNIVERSITI TEKNIKAL MALAYSIA MELAKA
ii
“I hereby declare that I have read through this report entitle “Development of Depth Sensor System for Seabed Mapping uses Echo Sounding Technique” and found that is has comply that
fulfillment for awarding the degree of Bachelor of Electrical Engineering (Control, Instrumentation and Automation)”
iii
I declare that this report entitle “Development of Depth Sensor System for Seabed mapping uses Echo Sounding technique” is the result of my own research exceptas cited in the references. The report has not been accepted for any degree and is notconcurrently submitted
in candidature of any other degree.
Signature : … … … … Name : Anisah Bt Mohd Noor
iv
DEDICATION
Specially dedicated to my beloved family especially my husband, Saiful Bahari B Mohd Rasid and my kids, Faris and Sofiya whose very concern, understanding, supporting and patient.
v
ACKNOWLEDGEMENTS
Thanks to Allah S.W.T for giving me theenthusiasm for completing this PSM smoothly.
Special thanks to the important person, my supervisor who guides me in the thesis and project preparation, Puan Arfah Syahida Bt Mohd Nor. She gave me a lot of advices and guidelines to ensure the project can be completed smoothly without any problem and produce the best result and also sharing her knowledge and idea for completing this project and her constructive criticisms and suggestions to prepare a good and quality of report.
I would like to express my gratitute to my mother and whole family whom always motivate and encourage me to be smart in study because without their mental and physical support, it will not be easy for me to complete the project report.
Also not forget to all lecturers of Universiti Teknikal Malaysia Melaka (UTeM) and all of my friends for giving actuation, motivation and sharing information with me. Thank you for all the help and support that was given. Your help are really appreciated.
vi
ABTRACT
vii
ABSTRAK
Projek ini bertujuan untuk membangunkan satu sistem bagi mendapatkan bentuk muka bumi di Tasik Ayer Keroh, Melaka.Kajian bermula dengan mengenalpasti teknik yang sesuai dalam mencapai objektif kajian. Pelbagai teknik boleh digunakan untuk mengkaji kedalaman laut,
viii
TABLE OF CONTENT
CHAPTER TITLE PAGE
ACKNOWLEDGEMENT v
ABSTRACT vi
ABSTRAK vii
TABLE OF CONTENTS viii
LIST OF TABLES xi
LIST OF FIGURES xii
1 INTRODUCTION 1
1.1 Overview 1
1.2 Problem Statement 3
1.3 Objectives 3
1.4 Scope of Project 3
2 LITERATURE REVIEW 4
2.1 Overview 4
2.2 Fundamentals of underwater sound 4
2.3 Sensor of seabed mapping 5
2.4 Method of seabed mapping 7
2.5 Combination of underwater acoustic and radar instrumentation
8
2.6 Existing project 9
ix
3 METHODOLOGY 12
3.1 Overview 12
3.2 Flowchart 12
3.2.1 Select project and literature review 14 3.2.2 Sketch hardware for first draft 14
3.2.3 Identify the device 15 3.2.4 Hardware Installation 16 3.2.4.1 Assembling the transducer 16 3.2.4.2 Installing the transducer 17 3.2.4.3 Installing the swivel mount 18 3.2.5 Understanding the method in collecting the
data
19
3.2.6 Hardware testing 20
3.2.7 Determine the depth of Tasik Ayer Keroh 20 3.2.8 Data collected and analyzed 20
3.3 Sonar sensor works 21
3.4 Process of readings taken 23
3.5 Conclusion 23
4 RESULT AND DISCUSSION 24
4.1 Overview 24
4.2 Measure the accuracy of the device 24 4.2.1 Eagle Ranch Resort’s swimming pool 25 4.2.2 Casa Rachado Resort’s swimming pool 27 4.2.3 MBMB’s swimming pool 31 4.2.4 Calculate the overall of error 35
4.3 Find the seabed at research area 35 4.3.1 Size of research area 36 4.3.2 Line of data taken 38 4.3.3 Result of Tasik Ayer Keroh 39
x
5 CONCLUSION AND RECOMMENDATION 46
5.1 Overview 46
5.2 Conclusion 46
5.3 Recommendation 47
xi
LIST OF TABLE
TABLE TITLE PAGE
2.1 Different pressure in air and water 5
3.1 Garmin Echo 100 specification 15
4.1 Data taken at Eagle Ranch Resort’s swimming pool
26
4.2 Data taken at Casa Rachado Resort’s swimming pool
29
4.3 Data taken at MBMB’s Swimming pool 32 4.4 Length of every side of Tasik Ayer Keroh 37
xii
LIST OF FIGURE
FIGURE TITLE PAGE
1.1 This illustration depicts the principle of sediment echo sounding, which uses a narrow beam of high energy and low frequency
2
2.1 Transducer structure 6
2.2 Equivalent lumped-circuit of piezoelectric transducer considering the line losses
6
2.3 Collocation plan form of source and transducers 7 2.4 Echo shape of receive signal acquired at three
frequencies, 12kHz (left), 38kHz (middle), 200kHz (right) in three different areas; sandy gravel (thin solid line), sand (thick soled line) and sandy mud (thin dashed line)
8
2.5 GPR principle and installation 9
2.6 How EM 300 function 10
3.1 Methodology Flowchart 13
3.2 The sketch of depth masurement of water tank 14
3.3 Mounting bracket of transducer 16
3.4 Transducer 17
3.5 Swivel mount 18
3.6 Placing the device in the swivel mount 19
3.7 12V separated battery 19
3.8 The project line at Tasik Ayer Keroh 20
xiii
3.10 The right angle place the transducer 22
3.11 Coverage of sensor 22
3.12 Readings taken at every 4m 23
4.1 Eagle Ranch Resort’s swimming pool 25
4.2 Sensor in the pool 25
4.3 Real and Measured Data (m) VS Distance (m) at Eagle Ranch Resort’s Swimming Pool
26
4.4 Casa Rachado Resort’s Swimming Pool 28
4.5 At the depth of 1.2m 28
4.6 The device recorded 1.1m at 1.2m depth 29 4.7 Real and Measured Data (m) VS Distance (m) at Casa
Rachado Resort’s Swimming Pool
30
4.8 MBMB’s Swimming Pool 31
4.9 Sensor in the pool 31
4.10 The device recorded 3.8m at 3.8m depth 32 4.11 Real and Measured Data (m) VS Distance (m) at
MBMB’s Swimming Pool
33
4.12 Tasik Ayer Keroh 36
4.13 Measure taken using Google Earth 37
4.14 Digital Planimeter 38
4.15 The project line 39
1
CHAPTER 1
INTRODUCTION
1.1 Overview
The development of exploring the technique of seabed mapping started over 150 years ago [1]. The technique revolutionized over years. But some of the basic principle still remains until today. For example, the measurement call fathom which used weight that attached to a rope which were lowered to the bottom from the side of the boat. The weight had a hollow bottom so a sample of the sediment could be collected.
Echo Sounding took place in 1919 by French which also called fathometers [1]. As the ship travels on the surface of the water, a transducer on the hull of the ship emits a pulse of sound, a ‘ping’. Sound will reflected if hit by a hard surface. A receiver that placed on the ship’s hull will captured the ‘ping’ sound and the time taken for this to happen is recorded by the device. Then, the calculation of depth automatically measured using this equation:
Distance = speed x time (1.1)
2
Figure 1.1 shows how the depth is determine using 4kHz of frequency. The sensor was place at the bottom of the ship and emit the pulse. The coverage area is in only 4° from the transducer.The smaller value of frequency, the smaller coverage of transducer.
3
1.2 Problem Statement
Lakeis well knownas one of the source oflife. Sometimesit is usedas arecreation place, the source of drinkingand alsoas a source of income from life inside. But, some of the activities cannot be done because of the depth of the lake not clearly known. It isdifficultto
estimatethe depthof the lake caused by the uneven ground. Using Echo Sounding Technique,transmitter will transmit the sound to the seabed and the sound with bounced back to the receiver when it hit the seabed. The speed and time of the sound travel in this process is use to determine the depth of the seabed.
1.3 Objectives
There are four objectives of this projectwhich are:
1.3.1 To understand theechosoundingtechniques.
1.3.2 To develop a depth sensor system for seabed mapping using Echo Sounding Technique.
1.3.3 To analyze the accuracy of seabed mapping.
1.3.4 To determine the depth of the river using echo sounding technique.
1.4 Scope of Project
Techniques described in this project are used to map the shape of the seafloor. There are several methods to collect the data of the river’s depth. But the aim is to develop a Depth Sensor System using Echo Sounding Sensor. The transmitter of the transducer enable the system to generate a swath of sound. The sound is reflected by the seafloor at different angles
4
CHAPTER 2
LITERATURE REVIEW
2.1 Overview
This chapter reviews existing project created to get an idea about the project design, conception and any information that related to the project. There are many creations and innovations of projects that have been done by other researchers with differences concept and design. This chapter also covers the researches related to the subject. This will provide a clearer understanding of the system and its design. This chapter will discuss on overall theories and concept of the project. The purpose of this chapter is to explain the review of the theories used to in order to implement the project. The understanding of the basic theory is a very important as a guideline. This project is all about the development of Depth Sensor System for Seabed mapping uses Echo Sounding Technique.
2.2 Fundamentals of underwater sound
Human can covers frequencies from 20Hz to 20kHz but others species like marine mammals can extend outside the human hearing range. Sound below 20Hz is often referred as infrasound and sound above 20kHz referred as ultrasound. In order to measure the sound, several factors must be taken into account. The intensity, pressure, acoustic impedance and
5
characteristics of air and water, the measuring of sound also differs which is water have pesspressure 60 times larger than in the air[3].
Table 2.1: Different pressure in air and water [4]
Pressure in air re 20 µPa/Hz
Pressure in water re 20 µPa/Hz
Comments from Kinsler& Frey: Fundamentals of Acoustics
0 62 Lower limits of human hearing
60 122
120 182 Threshold of hearing
140 202 Threshold of pain
160 222 Threshold of direct damage
In areas with a very strong acoustics contras at the seabed, sound will be reflected back into the water column and not penetrate into the bedrock. Sound from several of sources can be recorded over great distances. Unfortunately, this sound will be attenuated when the distances increase.
2.3 Sensor of Seabed Mapping
6
Figure 2.1: Transducer structure [6]
Figure 2.1show the basic transducer structure made from 1to 3 composite ceramic matching with aluminium. In their experiment, the ceramic was replaced by piezocomposite materials due to its sensitivity[6].The aluminium placed at the middle of ceramic layer and not required in improving the performance but it is need to provide a mounting support. The acoustic waves which reach at the receiving transducer and change to electrical signal at the electrical port.
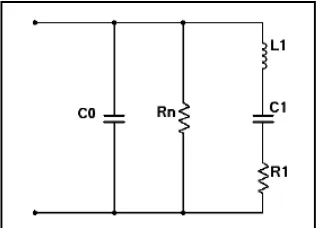
The acoustic transducer response characteristics and the effect of underwater sound pulse on receiving system are studied. In order to get the result, an equivalent circuit of acoustic transducer was constructed. A capacitor act as a piezoelectric transducer due to its electric dissipation. The impedance which is inductor, resistor and capacitor also added
because transducer radiates acoustic energy [7].
Figure 2.2: Equivalent lumped-circuit of
7
Meanwhile, by using electro hydraulic effect intense sound is produced. A charging-discharging circuit, trigger switch, discharge switch, transmission cables and control unit are use as sound source system.
Figure 2.3: Collocation plan form of source and transducers [7]
From the experiment, underwater countermeasure equipment can be developed from sound pulse generating system [7].
2.4 Method of Seabed Mapping
The seabed mapping using Single Beam Echo-Sounder (SBES) is the one useful method for seafloor characterization. In the SBES previous studied stated that the determination of the energy ratio of the first and second bottom return to characteristics of the seafloor [8]. Measure of theoretical and acoustic model was compared in the time domain and frequency [9] . The study of seafloor characterization was made by using neural network and seafloor classification method build upon the parameterization of the reverberation probability
8
Figure 2.4: Echo shape of receive signal acquired at three frequencies, 12kHz (left), 38kHz (middle), 200kHz (right) in three different areas; sandy gravel (thin solid line), sand (thick soled line) and sandy mud (thin dashed line) [9]
Multi-Beam Echo Sounders offer the hydrographic surveyor the ability to measure and record seabed bathymetry over a wide swath beneath the survey vessel. MESB is more expensive if compared to SESB system. The imaginary data available from multibeam echo sounders have improved in quality of imagery. The foot print size of the imagery data from the MESB is generally large [10].
2.5 Combination of Underwater Acoustic and Radar Intrumentation.
9
Rajah 2.5 : GPR principle and installation[11]
The acoustic pulses of the echo sounder are reflected at the sea floor and the reflected echoes are received by the transducer. The elapsed time between the outgoing pulse and the returning echo is a measure of the depth. At the same time, the data of seabed mapping were also taken by the GPR. The data then displayed as a sea bottom cross-section. From the research, it is proof that the combination of the two methods is a powerful technique for exploration the sea bottom [11].
2.6 Existing Project
10
Figure 2.6: How EM 300 function.[12]
Figure 2.6 explain how EM 300 function in collecting data to measure the seabed
mapping. The EM300 system has been used to map the seafloor widely around the world, from Vancouver Island, to the rift zones of Hawaii, to the Galapagos Islands.
2.7 Conclusion
11

![Table 2.1: Different pressure in air and water [4]](https://thumb-ap.123doks.com/thumbv2/123dok/558205.65841/18.612.79.547.151.332/table-different-pressure-air-water.webp)
![Figure 2.3: Collocation plan form of source and transducers [7]](https://thumb-ap.123doks.com/thumbv2/123dok/558205.65841/20.612.161.468.154.270/figure-collocation-plan-form-source-transducers.webp)
![Figure 2.4: Echo shape of receive signal acquired at three frequencies, 12kHz (left), 38kHz (middle), 200kHz (right) in three different areas; sandy gravel (thin solid line), sand (thick soled line) and sandy mud (thin dashed line) [9]](https://thumb-ap.123doks.com/thumbv2/123dok/558205.65841/21.612.85.555.70.274/figure-receive-signal-acquired-frequencies-middle-different-dashed.webp)
![Figure 2.6: How EM 300 function.[12]](https://thumb-ap.123doks.com/thumbv2/123dok/558205.65841/23.612.171.473.64.413/figure-how-em-function.webp)
