ISSN: 1992-8645 www.jatit.org E-ISSN: 1817-3195
136
DEVELOPMENT AND MODELING OF UNMANNED
UNDERWATER REMOTELY OPERATED VEHICLE USING
SYSTEM IDENTIFICATION FOR DEPTH CONTROL
1ARAS, M.S.M, 2ABDULLAH, S.S, 3RASHID, M.Z.A, 4RAHMAN, A. A, 5AZIZ, M.A.A
1
Lecturer, Department of Mechatronics, Faculty of Electrical Engineering, Universiti Teknikal Malaysia Melaka, Melaka, Malaysia.
2
Senior Lecturer, Department of Electric and Electronics, Malaysia-Japan International Institute of Technology, Universiti Teknologi Malaysia, Kuala Lumpur, Malaysia.
3
Lecturer, Department of Mechatronics, Faculty of Electrical Engineering, Universiti Teknikal Malaysia Melaka, Melaka, Malaysia.
4
Lecturer, Department of Power, Faculty of Electrical Engineering, Universiti Teknikal Malaysia Melaka, Melaka, Malaysia.
5
Postgraduate Student, Department of Electric and Electronics, Malaysia-Japan International Institute of Technology, Universiti Teknologi Malaysia, Kuala Lumpur, Malaysia
E-mail: [email protected] , [email protected] , [email protected]
, [email protected] , [email protected]
ABSTRACT
This paper presents the development and modeling of low cost underwater Remotely Operated Vehicle (ROV) for depth control using system identification technique. The ROV was developed by the Underwater Technology Research Group (UTeRG). For Unmanned Underwater Vehicle (UUV), the most crucial issue is the control system. It is needed for the ROV to perform several underwater applications and tasks. In this project, a prototype of the ROV will be developed first. The ROV will be tested on an open loop system to obtain measured input-output signals. Input and Output signals from the system are recorded and analyzed to infer a model. Then, system identification toolbox in MATLAB will be applied to generate a model of the ROV. The experimental testing of ROV only considered the vertical movement. The modeling obtained will be used to design the a suitable controller for depth control. The purpose of depth control is to ensure the ROV to remain stationary at a desired depth by utilizing the pressure sensor as feedback. The simulation studies have been carried out in order to obtain the controller of the ROV. This method is useful to obtain the model of the ROV to design the best controller for depth control. Conventional controller will be used in order to verify the modeling of ROV and gives acceptable performances of system response. Keywords: Remotely Operated Vehicle (ROV), System Identification, NI-DAQ card, Pressure Sensor
1. INTRODUCTION
Unmanned Underwater Vehicles (UUVs) are a grouping of Remotely Operated Underwater Vehicles (ROV), Autonomous Underwater Vehicles (AUV), and Underwater Glider [1] [2]. This UUV classification is shown in Figure 1. These three types of UUVs contributed to the same problems as mentioned in [3] [4]. These vehicles have existed for more than 100 years and they have attracted a lot of researchers and industries [5] [6]. Unmanned underwater vehicles (UUVs) have become a good platform for the underwater research areas since it can become an autonomous
system. These systems are crucial because of the varying operating range and depth posed by underwater areas. Moreover, rescue operations and risk free to human life are also important factors contributed to the necessity of this research. The applications of UUVs today mostly cover aspects such as surveillance, monitoring, inspection, recovery, repair and maintenance, as well as construction [7].
ISSN: 1992-8645 www.jatit.org E-ISSN: 1817-3195
137 ROV is also named as a Remotely Operated Underwater Vehicle to distinguish it from remote control vehicles that operate on underwater platform or surface vessel. The ROV system is unmanned, highly maneuverable and it is operated by a person on board of a vessel. It is linked to the ship by a tether or known as an umbilical cable, a group of cables that carry electrical power, video and data signals back and forth between the operator and the vehicle [9]. In this project, the focused area will be to control an ROV in a heave-axis motion in order to maintain its desired position. The integrated sensor combination has been developed and it consists of pressure sensor, Inertial Measurement Unit (IMU), digital compass and temperature sensor in a pressure hull that is purposely used to give a feedback to control the movement of the ROV. The target of heave-axis motion is to maintain its stationary and stabilize point or also called as “station keeping”.
Figure 1: Classification of Unmanned Underwater Vehicles
This paper is organized as follows. Section 2 describes a brief introduction of an ROV system
including application and classification of
underwater vehicles. The ROV developed by UTeRG from Universiti Teknikal Malaysia Melaka (UTeM) is presented in this section. Section 3 details out the methodology of this project which includes system identification and data acquisition technique. Section 4 describes mathematical modelling of an ROV for depth Control. Meanwhile, section 5 illustrates the field testing results. Finally, section 6 shows the final remarks
2. REMOTELY OPERATED VEHICLE
(ROV)
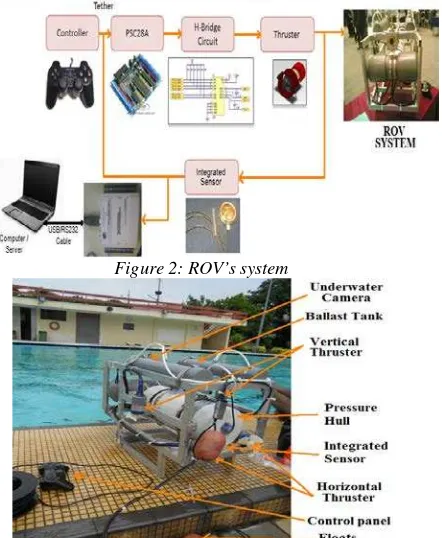
A complete Remotely Operated Vehicle (ROV) system developed by UTeRG Team is depicted in Figure 2 which gives an overview of closed loop control system for ROV while Figure 3 shows the final ROV frame with all components in accurate position including the integrated sensor attached
onto it. The pressure hull in the form of cylindrical PVC pipe with end cap is adopted as the systems frame since it is the easiest way to fabricate. The pressure hull needs to be sealed and the sealing method used is cable clamping with additional waterproof glues. From this ROV frame, the buoyancy force can be measured by finding the force of buoyancy acting on the object when in the air, as mentioned by the equation (1) below:
B = W empty – W absorbed
(1)
where
B = Buoyancy force
W empty = weight of object in empty space
W absorbed =weight of an object immersed in a fluid
In addition, another method used to calculate the buoyancy force is based on experiment on tank test. The aim of this method is to make sure ROV has residual buoyancy equals to 4% of the vehicle’s weight to effortlessly submerge and follows the set point set up. In order to eliminate the buoyancy force, a few experimental studies have been carried out by varying the weights of ROV [1]. This ROV system has two thrusters for vertical motion while
another two thrusters for horizontal motion with 45o
angle as shown in Figure 3.
Figure 2: ROV’s system
ISSN: 1992-8645 www.jatit.org E-ISSN: 1817-3195
138
Figure 4: ROV Will Be Tested On Swimming Pool And Lab Tank Test
The complete ROV that is ready to be tested in an open loop system in the pool shown in Figure 4 above to obtain measured input and output data . In this test, the depth of the pool is set and limits to only 12 feet. Data Acquisition Card DAQ 6009 USB NI was used to capture input-output signals.
3. METHODOLOGY
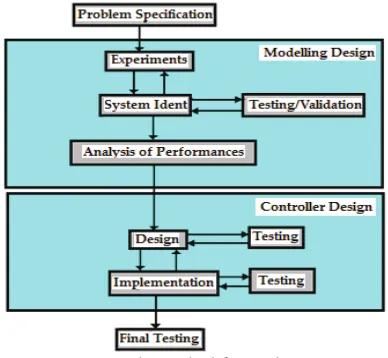
This section describes the methodology used in this research as shown in Figure 5. The problem specification will be identified first to have a clear view in order to overcome the limitations, weakness and to improve the systems. For the Unmanned Underwater Vehicle, the most crucial issue is the control system needed by the ROV to perform the underwater applications and tasks. A suitable controlling method of underwater vehicles is very challenging due to the nature of underwater dynamics and parameter uncertainties [10] [11]. Mathematical modeling of the ROV is such a complex problem because it is involved with
calculation of several different parameters [11]. Accurate dynamic model is also crucial to the realization of ROV because the system needs to be derived completely from (physical) laws [12] [13]. This methodology is divided in two phases namely; modelling and controller design. This paper covered and focused only on the modeling design. The ROV will be tested on an open loop system to get the measured input-output signals. Input and output signals from the system are recorded and analyzed by NI USB DAQ card to infer a model using a MATLAB system identification toolbox. An appropriate experimental condition must be designed in order to obtain the process response that sufficiently described the entire process behavior [14]. But if not possible, it is sufficient to obtain the process response that describes only the process dynamic of interest. The modelling will tested to validate to ensure the model obtained can be represented ROV. This part very important, once considered model is generated by System identification, it will be used for controller design.
Figure 5: The Methodology Of Project
3.1 System Identification
ISSN: 1992-8645 www.jatit.org E-ISSN: 1817-3195
139 shows a typical approach in implementing system identification to an observation of a dynamic system. Generally, the system identification
approach goes through five steps [10], such as (1)
design parameter, (2) platform design, (3) Sys. Ident. model selection, (4) model generated and (5) model verify. At step 4, if the model is not good enough, steps 3, 2 or 1 may need to be repeated. The first stage is design parameter that to decide on the design parameters, the dynamic motion equation must be familiarized. In this project, Mathematical Model of Vertical Movement (depth movement) is studied.
Figure 6: System identification approach
After identifying the design parameter, the next stage is platform development. In this stage, the prototype of an Unmanned Underwater Vehicle will develop based on design parameters. System identification will take place once the platform is ready to be tested to get input-output signals. The MATLAB System Identification Toolbox will be used to infer a model. Some theory for Sys. Ident. must be cleared so that the model obtained is acceptable. Then the model obtained from SI will be verified using a simple controller such as conventional PID controller, Pole placement and etc.
3.2 NI DAQ Card
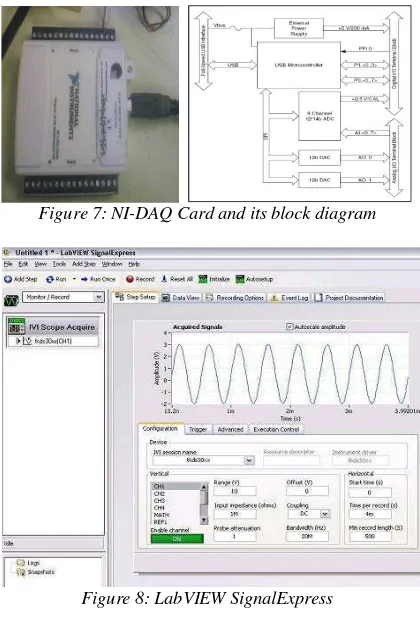
Data acquisition (DAQ) is the process of measuring an electrical or physical phenomenon such as voltage, current, temperature, pressure, or sound with a computer [16]. A DAQ system is a device consists of sensors, DAQ measurement hardware, and a computer with programmable software as shown in Figure 7. Compared to traditional measurement systems, PC-based DAQ systems exploit the processing power, productivity, display, and connectivity capabilities of industry-standard computers providing a more powerful, flexible, and cost-effective measurement solution. The NI USB-6009 provides connection to eight analogue inputs (AI) channels, two analogue outputs (AO) channels, 12 digital input/output (DIO) channels, and a 32-bit counter with a
Full-Speed USB interface as shown in Figure 7. All data from NI DAQ can be obtained from LabVIEW Signal Express software as shown in Figure 8 .
Figure 7: NI-DAQ Card and its block diagram
Figure 8: LabVIEW SignalExpress
4. MATHEMATICAL DYNAMIC MODELING OF ROV
Based on the several assumptions made, as well as measurements performed on the vehicle, the matrices of the dynamic model from [1] were simplified and adapted to the ROV. These simplified matrices are presented in this section. Note that since sway, roll and pitch are negligible, then the corresponding parameters in the following matrices have been set to zero since they are not required to be identified for controlling the ROV.
4.1 Mass and Inertia Matrix
With the vehicle frame positioned at the centre of gravity and since the vehicle is assumed fairly
symmetrical about all axes, then MRB can then be
ISSN: 1992-8645 www.jatit.org E-ISSN: 1817-3195
140 (2)
Since roll, pitch and sway are considered negligible, and then equation (2) can be further simplified to,
(3)
where the mass of the ROV was measured to be 18kg. It can be seen from equations (3) that the only parameter that needs identification for this matrix is the inertial moment about the z axis corresponding to yaw. Analogous to the
simplification of MRB, the added mass matrix, MA,
becomes,
(4)
4.2 Hydrodynamic Damping Matrix
The hydrodynamic damping matrix, D (V), simplifies to the equation (5),
(5)
4.3 Gravitational and Buoyancy Vector
The weight of the ROV was found to be 176.4N while the buoyant force was measured as 196N. Keeping in mind that roll and pitch are negligible, significantly simplifies to the equation (11),
(6)
The value of -19.6N implies that the vehicle has residual buoyancy just as it was designed to have. The residual buoyancy equates to 4% of the vehicle’s weight. Equation 6 shows that the gravitational and buoyant forces of the vehicle only affect the heave of the vehicle. This is expected given that the centres of gravity and buoyancy are aligned along the x and y axes, and hence, the gravitational and buoyant forces should then only affect vertical movement.
4.4 Forces and Torque Vector
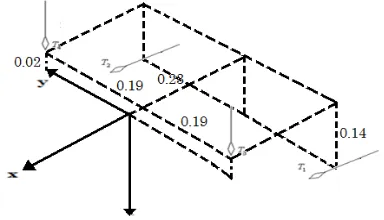
By measuring the positions of the motors on the ROV, a layout of the thrusters depicting their respective distances to the vehicle’s centre of gravity was attained. This can be seen in Figure 9. From Figure 9, the mapping matrix, L, for the ROV is given to a good approximation by,
(7) while the thrust vector is given by,
(8)
where T1, T2, T3, T4 represent the thrusts of
ISSN: 1992-8645 www.jatit.org E-ISSN: 1817-3195
141 signify whether or not a particular motor has an effect on the movement of the vehicle along the x, y and z directions. For instance, in the first row, the ones in the first two columns indicate that the horizontal motors are responsible for the surge. The last three rows of the mapping matrix denote the distances from the centre of gravity to the thrusters. These values are either positive or negative corresponding to anticlockwise or clockwise moments respectively. The moments that are produced are responsible for affecting the vehicle’s attitude. As can be seen in the fifth row of the mapping matrix, not only do the two vertical motors contribute to pitch, but so do the two horizontal motors. This implies that when the vehicle is surging either forwards or backwards, the horizontal motors will affect the pitch of the vehicle. However, when performing underwater manoeuvres, this effect was not observed, implying that the contribution to pitch by the horizontal motors is not significant. This is most likely attributable to the passive pitch control system. Also observed in the fifth row is the fact that each vertical motor is equidistant from the centre of gravity. Consequently, applying equal forces to these motors when diving, surfacing or hovering will maintain the vehicle in a reasonably horizontal posture.
Figure 9: The Mapping Matrix, L Thrust Position.
5 RESULTS AND DISCUSSION
The ROV will be tested on an open loop system to get the measured input-output signals. Input and output signals from the system are recorded and analyzed to infer a model as shown in Figure 10. Experiment open loop system done on ROV for depth control with set point is 5m. Two experiments will be considered. One input-output signal used for generating model ROV and another one for validate a model.
Figure10: Experiment Results Testing Open Loop System For ROV
By using the commands below on command window MATLAB, the input and outputs will be set then the system identification toolbox interface is opened as shown in Figure 11.
>> x=tg.OutputLog(:,1); >> y=tg.OutputLog(:,2); >> y1=tg.OutputLog(:,3); >> ident
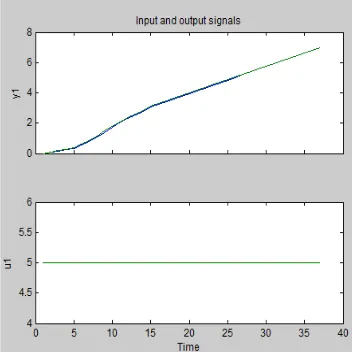
Where x, y and y1 where the input and outputs of the system respectively. Command “ident” was used to open the system identification toolbox. At the main system identification information window, click the Time plot checkbox. A time plot of input-output signals of the measured data will be displayed as shown in Figure 12. The data obtained from signal express LabVIEW using the USB NI DAQ card. As mentioned early in the ROV will tested in an open loop system whereas the set point of depth set at 5 meters.
ISSN: 1992-8645 www.jatit.org E-ISSN: 1817-3195
142 Under the Estimate drop list, the linear parameter model GUI was selected as shown in Figure 11. In Linear parameter model GUI other model than the state-space model such as an ARX model can also be selected. The range of order selected was from 1 to 10 orders then will be displayed. Normally the red lines are the default choice as shown in Figure 13. To infer the ROV modeling, third order was selected. The best fist of the measured and simulated model output is 89.46%. A Model Output window as shown in Figure 14 will be displayed. The Percent Best Fit value will be displayed in the Best Fits window. Clicking the Model resides checkbox will display Residual Analysis windows as shown in Figure 15. This action computes the residuals (prediction errors) e, from the model when input data is applied and also performs whiteness and independence analyses. The autocorrelation function of e and the cross-correlation function between e and u are computed and displayed. Click the Zeros and the poles checkbox as shown in Figure 16. A Poles- Zeros plot as shown in Figure 16 will be displayed. Double clicks the arx331 icon on the Model Views board will display the model info as in Figure 11. The model transfer function can be obtained from this window. The poles and zeros are properties of the transfer function, and therefore of the differential equation describing the input-output system dynamics. Together with the gain constant K they completely characterize the differential equation, and provide a complete description of the system. In general, the poles and zeros of a transfer function may be complex, and the system dynamics may be represented graphically by plotting their locations on the complex.
Figure 12: Input And Output Signals
Figure 13: Model Singular Values
Figure 14: Measured And Simulated Model Output
ISSN: 1992-8645 www.jatit.org E-ISSN: 1817-3195
143
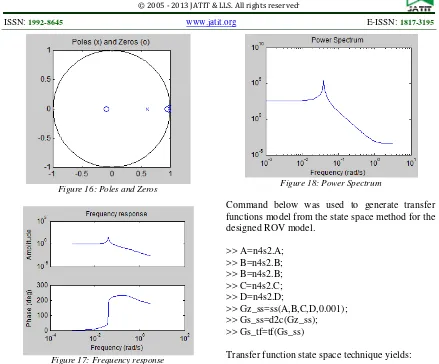
Figure 16: Poles and Zeros
Figure 17: Frequency response
The frequency response is the quantitative measure of the output spectrum of a system or device in response to a stimulus, and is used to characterize the dynamics of the system. It is a measure of magnitude and phase of the output as a function of frequency, in comparison with the input. In simplest terms, if a sine wave is injected into a system at a given frequency, a linear system will respond at that same frequency with a certain magnitude and a certain phase angle relative to the input as shown in Figure 17. Also for a linear system, doubling the amplitude of the input will double the amplitude of the output. In addition, if the system is time-invariant, then the frequency response also will not vary with time. The power spectrum is defined as the Discrete Time Fourier Transform of the autocorrelation sequence as shown in Figure 18.
Figure 18: Power Spectrum
Command below was used to generate transfer functions model from the state space method for the designed ROV model.
Transfer function state space technique yields:
09
Discrete-time model: A(q)y(t) = B(q)u(t) + e(t)
ISSN: 1992-8645 www.jatit.org E-ISSN: 1817-3195
144 5.2 Conventional PID Controller Design
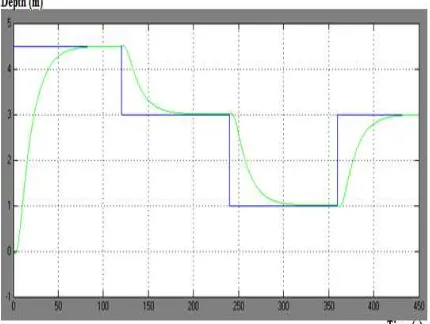
The model obtained in transfer function as discussed above will be used in feedback control system design as shown in Figure 19. Figure 19 shows the ROV model will be used in feedback control system where the thrusters model obtained from [10]. The controller design will be based on the conventional PID controller method. Simple control techniques such as PID control have been more commonly used because of the relative ease of implementation [17]. The result of system response as shown in Figure 20. It has seen the model of ROV will be following the set point but have very small jerking in staring of response because present of thruster model due to DC motor characteristic [18]. Then this model compared with mathematical modelling obtained from [17] [19] based on the same prototype of the ROV. Figure 21 shows the system response for the both models. Mathematical model better than the system identification model but the system identification model more real time application include of environmental disturbance even in lab tank test or in the swimming pool. A lot of assumptions and assertions on dynamics and uncertainties parameter for mathematical modeling.
Figure 19: ROV Model Tested On MATLAB Simulink
Figure 20: System Response Of ROV For Depth Control
Figure 21: Comparison Between Mathematical Model With System Identification Model
6. CONCLUSION
The development and modeling of low cost Remotely Operated Underwater Vehicle (ROV) for depth control using system identification technique were described in details. The ROV was tested on an open loop system to get the measured input-output signals. Input and Output signals from the system are recorded and analyzed to infer a model. Then modeling of ROV will be tested for design the controller. The response of the system based on the ROV model is acceptable. The comparison between Mathematical model and System identification model also covered in this research, which mathematical modeling showed better results than system identification model but the system identification model is more towards real time
application which includes environmental
disturbances either in lab tank test or in the swimming pool. Next research will be focused on intelligence controller design where new technique will be introduced in controller design. The Single Input Fuzzy Logic Controller (SIFLC) will be used. This SIFLC will be derived to simplify implementation in real time.
REFERENCES:
[1] M. S. M. Aras, F.A.Azis, M.N.Othman,
S.S.Abdullah, A Low Cost 4 DOF Remotely
Operated Underwater Vehicle Integrated
With IMU and Pressure Sensor, 4th
ISSN: 1992-8645 www.jatit.org E-ISSN: 1817-3195
145 [2] M.S.M Aras, H.A. Kasdirin, M.H. Jamaluddin,
M F. Basar, Design and Development of an Autonomous UnderwaterVehicle (AUV-FKEUTeM), Proceedings of Malaysian Technical Universities Conference on Engineering and Technology (MUCEET2009) Pahang, Malaysia, 2009, pp 1-5.
[3] F.A.Azis, M.S.M. Aras, S.S. Abdullah,
Rashid, M.Z.A, M.N. Othman, Problem
Identification for Underwater Remotely
Operated Vehicle (ROV): A Case Study,
Procedia Engineering, Volume 41, 2012, pp 554-560.
[4] Robert D. Christ and Robert L. Wernli Sr., The ROV Manual: A User Guide for Observation-Class Remotely Operated
Vehicles, Elsevier Ltd., Oxford UK, First
edition, 2007.
[5] Gianluca Antonelli, Underwater Robots:
Motion and Force Control of Vehicle-
Manipulator Systems, Springer, Cassino Italy,
Second Edition, 2006.
[6] Roy Kim Lea, Control of a Tethered
Underwater Flight Vehicle, Ph.D thesis,
University of Southampton, May 1998.
[7] Louis Andrew Gonzalez, Design, Modelling
and Control of an Autonomous Underwater
Vehicle, B.Eng. thesis, The University of
Western Australia, October 2004.
[8] T.I. Fossen, Guidance and control of ocean
vehicles, Wiley, New York, 1994.
[9] K.R. Goheen and E.R. Jefferys, The
application of alternative modelling
techniques to ROV dynamics, in Proceedings
of IEEE International Conference Robotics and Automation, vol. 2, pp. 1302-1309, May 1990.
[10] Mohd Shahrieel Mohd Aras, Shahrum Shah Abdullah, Azhan Ab Rahman, Muhammad
Azhar Abd Aziz, Thruster modeling for
underwater vehicle using system identification
method, International Journal on Robotics and
Control System,Vol 10 , 2012.pp 1-12. [11] Kashif Ishaque, S. S. Abdullah, S. M. Ayob
and Z. Salam (2010). Single Input Fuzzy
Logic Controller for Unmanned Underwater
Vehicle, Journal of Intelligent and Robotic
Systems. Vol. 59, No. 1, July 2010.
[12] J. V. Morató and S. G. Castro, Autonomous
Underwater Vehicle Control, in
Instrumentation ViewPoint, 2007.
[13] Louis Andrew Gonzalez, Design, Modelling
and Control of an Autonomous Underwater
Vehicle, Master Thesis, The University of
Western Australia, 2007.
[14] J.C. Kinsey, R.M. Eustice, and L.L.
Whitcomb, “Underwater Vehicle Navigation:
Recent Advances and New Challenges,” Proc.
IFAC Conf. on Maneuvering and Control of Marine Craft, Lisbon, Portugal, 2006.
[15] Mohd Nasir Taib, Ramli Adnan, Mohd Hezri
Fazalul Rahiman, Practical System
Identification, book , Faculty of Electrical
Engineering, UiTM, 2007.
[16] A. M. Plotnik and S. M. Rock, "A
multi-sensor approach to automatic tracking of
midwater targets by an ROV," in Proceedings
of the AIAA, 2007.
[17] Aras, M. S. M, Abdullah,S.S, M.N Kamarudin, Rashid, M.Z.A, Husain A.R Simplified Single Input Fuzzy Logic Control (SSIFLC) of depth control for Remotely
Operated underwater Vehicle (ROV), (under
review), International Journal of Advances Robotics and Control System, 2012.
[18] Mohd Shahrieel Mohd Aras, SN Syed Salim, Eric Chee Sai Hoo, I.A. Wan Abdul Razak, M Hendra Bin Hairi, Comparison of Fuzzy Control Rules Using MATLAB Toolbox and Simulink for DC Induction Motor-Speed Control, International Conference of Soft Computing and Pattern Recognition (SOCPAR'09), 2009, pp 711-715.