I n I n d o n e s i a
i t
i s a common p r a c t i c e u n t i l now,t o
f o r m u l a t ea
p o u l t r y d i e t based on n u t r i e n t r e q u i r e m e n t s t h a t a r e mostly recommended f o r p o u l t r y i n t h e temperate a d s u b t r o p i c a l r e g i o n , This i s due t o tlze f a c t t h a tmost
of t h e i n v e s t i g a t i o n s of n u t r i e n t r e q u i r e m e n t s of p o u l t r y have been conducted i n t h e a3ove mentioned r e g i o n s ,
Yayne argued t h a t keeping ?lens i n a h i g h tempera- t u r e environment decreased t h e i r S a s a l n e t q b o l i c r a t e , and
i n
consequence reduqe?. t h e i ~ energy requirement ( ~ h e l p s ,Since 1ndonesi.a i s l o c a t e 6 i n t h e t r o p i c a l r e g i o n , t h e r e should %be a ' d 5 f f e r e n t p a t t e r n of energy r e q u i r e m e n t s
of p o u l t r y , I
.Althoeqh
hzns
3rc;)t i n ,; high t c a p e r a t u r e environ- ment have a l o v e r h i e t a r y energy requirement, t h e y s t i l l need t h e s m e dai* i n t a k e of p r o t e i n , v i t a m i n s and mine- . r a l s t o m a i n t a i na
l e v e l of egg p r o d u c t i o n as h i g h ashens k e p t a t 60°~/15.
5'~
(Phelps, 1971). The p e r c e n t a g e a-of p r o t e i n needeL i n
a
r a t i o n f o r p o u l t r y i s r e l a t e d t oa poultry d i e t ,
it
i s
not only Xoportmt t o consider the energy contentof
t h e r a t i o n , but a l s o t h e calorie-protein r a t i o .The energy content of t h e d i e t , t h e environmentdl temperature, the l e v e l of production and t h e body s i z e of the hens were among s e v e r a l f a c t o r s which inifluenced t h e feed consumption
(~aldwin,
1972). Prince&
(1965) reported t h a t feed consumptionw a s
s i g n i f i c a n t l y higher a t 12.6'~than
a t 23.8'~.The problem
of
feed i n t a k e of $ne l a y i n g hensin
the t r o p i c s might c l e a r l y influenceYne
e x t e n tand
the v a l i d i t yo f
t h e p r o t e i n and erergy theory; s o t h e r ei s
s t i l l
doubt whethey i n hot climates t h el o w
l e v e l so r
t h e high l e v e l s of energy and protein i nthe
r a t i o n w i l l bemore
ade.qkte f o r layer$.bdonesian poultry farmers
t o
date Use e i t h e r the f l o o r l i t ~ e r system o r the cage systemf o r
"Ce l a y i n g her-,c;.&cause t h e r e
i s
no informatioq, about t h e energy re'quiremgnt and s u i t a b l e housing system f o r the l a y i n ghens
i n b d o n e s i a ,it
i s
necessary t o c k d u c t suchan
ex- periment.t h e p o u l t r y i n d u s t r y i s t o be expanded il Indonesia; because a b e t t e r e f f i c i e n c y w i l l d e p r e s s t h e c o s t of production and hence
i t
w i l l i n f l u e n c e t h e p r o f i t of t h e farmers.
REVIEW
OF LITERATURB
Productive energy, a s determined by Fraps and frequently r e f e r r e d t o i n American l i t e r a t u r e , i s
a
modi-
f i e d n e t energy determination but recent s t u d i e s have shown t h e values t o be very u n r e l i a b l e and t h e i r use
i s
not recommended. Metabolizsble energy which has a
r e l a t i v e l y constant value i n poultry and i s r e l a t i v e l y ,
easy
t o 'determ-ine, i s the energy value of feedsf o r
poul-
t r y (Anonymo~.~~, 1959). Morrison (1959) s t a t e d t h a tme-
t a b o l i z a b l e energy can be detemined qore e a s i l y thanproductive energy v~i111es.
The 1 i t . e r a t u r e concerning the e f f e c t s of d i f f e r e n t d i e t a r y e n e r s j l e v e l s i n the n u t r i t i o n of l a y i n g hens
i s
-
s t i l l l i m i t e d ; however, the majority of the work has shownt h a t energy l e v e l of t h e -laying r a t i o n influences egg production.
Ewing
(1963) reported th2.t 1 - x s e r and co- workers were among the f i r s t t o show tha.t r a t i o n s l o w i n f i b e r content supported a higher -ate o f egg pro6uction than s i m i l a r r a t i o n s high i n f i b e r content, while Singsen e t a l . were others who found t h a t r a t i o n s highi n
energy--
value have hieher e f f i c i e n c y than r a t i o n s
l o w
i n energy .value. High eQergy d i e t s tend t o improve egg s i z e anddecrease t h e c o s t per u n i t of energy and reduce handling c o s t s because of t h e i r decreased bulk (honymous, 1972).
H i l l e t
- -
a l e (1956) repox-ted t h a t d u r i n g winter t h e h i g h e s t r a t e of production w a s obtained from t h e f l o c k fed a high cnergy r a t i o n and t h e 1ol.res-t vas on a low ener- gy r a t i c n . During autumn, s p r i ~ g and sunmer egg production was n o t a f f e c t e d by t h e c n c r g j !-eve1 of the r a t i o n .McIntyre and Ritken (1957) found t h a t whey tliey fed l a y i n g heno with high energy rcttions kihich supplied about 90C
kcal
of groductive energy p e r 15 2nd l o v energy r a t i o n $/
which supnlied s l i g h t l y over 700 I<c21 per Ib i n t h e f i r s t period an? then i n t h e second 840 Kcal per l b ; t h e energy content of t h e r a t i o 3 had no e f f e c t on e s g production,
Pepper
- -
e t a l . (1959) a l s o found -that egg pro6uctionwas
a not a f f e c t e d by t h e energy content of t h e r a t i o n , n o r was feed e f f i c i e n c y . The energy content of t h e r a t i o n s i n t h e t r i a l v c r e 916, 929,
944
ail6 973 iccal of productive encr- gy per l b f o r t h e high energy rz-tion, and 872, 574, 877, 879 k c a l of productive encrggr p e r l b f o r t h e l 0 ~ i energy r a t i o n s . Petcrsen- -
et
a l . (1960) rcportcd t h ~ t t h e low energy m - t i o n i n Crumbled. form which supplied 650 kcalo f productive energy per l b maintained a s good egg pro- d.l~stion as high energy r a t i o n which supplied 910 kcal
I n the work of McIntyre and Aitken
(1957),
it
was
shown t h a t feed conaumptidn pep bird
ayld p e rdozen
e$gswas s i g n i f i c a n t l y lower on a high energy ration.
There
was
an increase of
11percent
i n
feed consumption per 100
kcal decrease
inproductive energy.
Bolton (1958) s t a t e d
that feed intake was regulated
bythe energy content of
the ration.
MacDasliel e t
--
a l . (1959) reported t h a t feed
required per dozen eggs decreased a s the energy of the
ration increased,
Petersen
&
&.
(1960) found t h a t feed
consumption was more when the r a t i o n had
low energy,
i t
..was. also more when the 'ration was c m b l e d . Hughes (1967)
stated t h a t the reductiop
i n
feed intake has been estimated
.
ark
5 e o r each $ i x degrees
F.
temperatwe r i s e ,
Shutze
(1969) reported t h a t feed intake
i si k f l ~ n c e d
by body'
,
weight, stage
of production, environmental, temperahrre,
how~ag/cage
OFf l o o r pens, energy content
of
d i e t and
.
.-
rstrafn
of
bird,
Phelps
(19700)
statedt h a t
layers
w i t h
different genettc backgrowds require r a t i o n s individual-
'ly
tailored t o their lay-
potential
andphysical charac-
t e r i s t i c s .
Small bodied Legborns need rations with a f a i r -
l y
hi@
nutriens density
t~
compensate f o r t h e i r small
appetites, but Wch r a t i o d would be wastefully over-con-
.swned
bybig-boeied brow-egg layers.
Though the l a y e r t
s.
.
food intdhe tenda
t o
decrease as the energy l e v e l of the
*diet
is
increased, the* a b i l i t y
t o
adjust feed consumption
to-maintain
a eonst*$
daily intake of enbrgy
i s
U n i t e d
.
t o Krautmtmn (1972) necirly a11 of t h e increased f e e d i n t z k e a s s o c i a t e d with lorder tcnperatlxre i s due t c . q r e t 2 t e r encrgy
.
needs t o keep t h e b i r d wz.rm. If t h e t e n p e m t u r e z t about 2 7 ' ~ can be mzintaincd most of t h e time, consider?.blc amounts o f feed czar? he saved.
Ti!ilson (1948) m d Wilson
2.
(1957) found t h a tan
i n c r e a s e of environments1 C e ~ p e r a t u r ecaused
an
in- crezse i;_? wcter consumption, Fox (1951) r e p o r t e d t h a t the m i t e Leghorn breed drank more water i n h o t wezther than t h e Rhode Island Red ?adNcw
E m y s h i r e breeds.Jull
(1949) a t a . t ~ d t h z t '7, hen i n f i r c t ye:l-r production which
l a i d 180
-
240 e g g s consm~ed 1-30-
18C l b of m t e r . It took about9
lb o f water t o produce 2 dozen cggs. Tyler(1958) reported t h ~ . t t h e i 3 - t t e r n o f c ~ ~ t i n g
and
d r i n k i n g d i f f e r e d ~ r i ( ? e l j r ai?zo:ig i n d i v i d ~ ~ ~ l ~ , but t h e i.vlrtividuals d i d not d i f f e r fromday
te
day.
Therc w a s h i g h l y s i g - n i f i c a n t p o s i t i v e c o r r e l a t i o n between t o t -1- i n t a k e o f w3.-t e r and watsr excreted i n eggs and f a e c e s . Yater i n t a k e d i d not Been t o be r e l x t e d t o d ~ ? j 1 2 1 ? t t ~ r i n t ~ k e under t h e c o n d i t i o r of t h e t r i d , but ?)rxs
simif
i c z n t l y r e l z t e d t o temper?turs. The E&IOUJI-~ ef water drunk p e r grsm o f feed consumed rarqed from 2 . 1-
2,6
milli-1i.-ters f o r a l l ages~ 5 t h exceptica
o f
t h e 7 2 week-
o l d l a y i n g hens, where t h e ano1.m-t w a . ~3 , 6
n l p e r gr,m of feed. This i n c r e a s e i n water ~0n~LImptihn WIS believed t o be due .to the waterl o s t
6
?!inter and Funk (1956) s t a t e d t h a t t h e r e i s a r e l a t i o n between t h e energy need and t h e uercentage of p r o t e i n needed i n a r 3 t i o n f o r p o u l t r y . 0 1 ~ 0 ~ 1
3
11.
(1961) fom6 t h a t t h e b e s t d i e t f o ~ l a y i n g hens was t h a t w i t h 1 4 p e r c e n t 3 r o t e i ~ 1 z i d r a t i o of k c a l i r e t a b o l i z a b l e
-
energy p e r l b t o percentage of p r o t e i n of94
: 1.McDaniels e t
- -
a l . (1957) showed t h a t i n v a r i o u s l a y e r s combinedw a s improved i z i i n c r e a s i n g t h e energy of t h e r a t i o n ; w i t h 1 7 p e r c e n t p r o t e i n t h e i n c r e a s e of e f f i c i e n c y f o ~ an i n - c r e a s e of 88
kcal
of p r o d u c t i v e energy Tras 0.59 l b f e e d p e r dozen egg produced. With 18 p e r c e n t p r o t e i n t h e f i - gure was 0.39 lls. Foran
i n c r e a s e of one p e r c e n t p r o t e i n , feed r e q u i r e d p c r dozen decreased 0 . 1 l b . M i l l e r e t- -
al.(1957) f o ~ m 8 t h a t t h e r e w a s no improvement of egg pro-
-
d u c t i o n by g i v i n g5
p r o t e i n l e v e l s frgm 12.5 t o 20.9 per- c e n t with 3 :cvels of' ener,7;y i n which tlic ??.ti0 of pro- d u c t i v e energy t o p r o t e i n i n t h e r l t i o n s v2.ries from31
t o 86. .As the energy c o n t e n t of t h e r s t i o n . i n c r e a s e d , l e s s f e e d v ~ -ne?uired p e r dozen eggs rfirhen t h e p r o t e i n s l e v e l was overl4
p e r c e n t . By f e e d i n g r a t i o n s c o n t a i n i n g 16 o r 1 7 p e r c e n t ? r o t e i n w i t h p r o d u c t i v e energy 937, 970 o r k c a l per i b ,%Q
s i x groups of s i x month o l d l a y i n g Single Comb White 3eghorn p u l l e t s P r i n c e e t- -
a l . (1957) a l s o showed t h a t e 'c; l e v e l of e i t h e r p r o t e i n o r energy d i d n ' t s i g n i f icant2y a f f e c t r a t e of egg produ-ction.Feed consumption p e r dozen eggs produced d e c r e a s e d
as
t h e energy v a l u e of t h e d i e t i n c r e a s e d . The o v e r a l l impro- vement of f e e d e f f i c i e n c y w i t h i n c r e a s e of energy w a s 14.8 p e r c e n t . Hochreich&.
(1958) fecl r a t i o n s con- t a i n i n g 15.7, 17.0 o r 18.35 p e r c e n t -p-otsin, e a c h Without o r w i t h 6.6 p e r c e n t s t a b i l i a e d y e l l o w g r e a s e added, and with p r o d u c t i v e energy v a l u e s of t h e u n s ~ ~ p p l e m e n t e d-
r a t i o n s a t 374, 958 and 104-9 k c a l p e r l b . dgT y i e l d was n o t a f f e c t e d by adding f a t
a-t
any l e v c l of p-lotein b u t --
was s i p i f ic a n t l y h i g h e r ~ r h e n ? r o t e i n l e v e l was h i g h e r . By f e e d i n g v a r i o u s d i e t s contqiniul,?; 1 5 , 20 'and 25 p e r c e n t which s u p p l i e d 750 o r
96C
k c a l of oror!uct;ive energyMcDaniels
- -
e tal.
(1959), d i d noJc observe ?,n e f f e c t on egg production, bu-t f e e d r e q u i r e d p e r d o z e ~ eggs d e c r e a s e d as t h e energy of t h e r a t i o n i n c r e a s e d . flobblee e t a l .- -
(1959) f e d groups of t u r k e y b r e e d i n g hens d u r i n g t h e hatch- i n g season on one of 6 r a t i o n s supplyin,y 7 3 ,
79
o r 88proportionate decrcase of ,mount of f e e d p e r dozen eggs produced. The f i n d i n g of Frank and Mnibel (1960) showed t h a t e f f i c i e r c y f o r egg production on 1 2 . 4 and
1 4 . 9
per- cent p r o t e i n was g r e a t e r on h i c h energy d i e t s cont2ining984
t o 1250 k c a l of productive energy p e r l b .I n t h e work of Grsham (1934), t h e p r o t e i n i n t a k e
was
1 2 . 9
percent when l a y i n g hens were fed 1 8 percent Fro- t e i n l a y i n g mash p l u s corn and o a t s . Some b i r d s l a i d w e l l on a d i e t c o n t a i n i n g 1 2 t o 1 3 percent -9rotei.n znd t h eo t h e r s required
14-
t o 1 5 percent. leimane t
--
3-1.-
(1336) found t h a t by adding f i s h mea.1 t o t h e d i e t c o n t a i n i n g 13% all-plant-pro t e i n f o r Single Comb ILhi-k k-ghorn p u l l e t s,
the marginal p r o t e i n l e v e l T o r weight maintenance and egg production w s s 14 pcrcent, Heuser (1976) s t a t e d t h a t t h e optLmum d i e t a r y p r o t e i n f o r l a y i n g hens was 1 6 percent, The optimum l e v e l of p r o t e i n i n t h e d i e t of l a y i n g White ~ e ~ h o r n s a s regortcri by Heywang&.
(1955)
was 1 5 per- cent d u r i n g both hot weather and r e l a t i v e l y c o o l and mo-d e r a t e weather. t h a t optimum egg
weight and egg production can be obtxine6- on p r o t e i n l e -
vels
ranging from 1 3 t o 18 percent.He
a l s o s t a t e d t h a tneeds
~ Q A W ~ P ( ~ P ~ ~ W % ~ ~ ~ , ~ ~ ~ ~ . ~ J ? ~ ~ , ~ Y ~ ~
-" a c i d rc-cpirement6 3 7 O & ~ , k ~ ~ ~ l i p l % ? i $ & - ~ W @~c:?Pe~Pj%rotein i n t h e m t i o n . * ~ h t PSIS;) be yedi~ccd i.f a
! z B W ~ s & & m ~ c ~ w * & ~ % ,- \
lower l c w $ ~ ;M&kt
?l?&dr~6;Zb- 3o uscA
fzr
i ~ y i n g hens.F B & . w % ~ ~
- -
m m & % b d i
tlnt n c t h i m k ~ z v r c t h e w ~ $ + ~ % % e ~ . ~ ~ @ - ~ ~ c f i c i c . ~ l t i .i ;i.ipl.o corn-soy-b%
%&&-kc
d $ @ ~ r f iwp
q r o w t h o f chiclr.j t o s i x :rocks of2
w
9
n
5$!&P $%3!!X8-t'~
t h e only m i n o ?-cici $ - e f i s i e : ~ t j.n askk%8)
&$%L%%ttonseqd me11 d i e t a'cr -rorith of chicks t o &%i%&% 'of clwgce B o t h v i t m i n 3 1% -:vl. me'ctlio~inc were n % @ % ~ - . ~ ~ -Far n m 7::imv,zl srotrth resporlsz c f c h i c k s f e da
chi-n-sogihem m o d d i e t e d Ln t h c 7;grk if Leong and I'TcGinnis
(1952), the
level
of mc t b i o n i n e requi-red f c r s u p p o r t i n gegg produ-ction, body treig!itg@nin ::id e g g s i z e
waz
appro- ximztoly 0 . 2 8 pcrcer,-l- i l l"tho
pre:-cncc o f 9.35 percentcystimc. Thc f i n d i n g s o f F i t s i m o n z
g i
2,
(1363) showedthat
lfliitc Lcchorn hens fcd EL d i c t c o n t z i n i n g 80$ o f groundyellow con2 :>,s thc only p r o t e i n b e a r i n g i n g r e d i e n t r s p i d l y declined 13. 5 o d 7 ;1~si,yht; ;.:nd cgg :p~ocXuctio~~, a11d l?roducod smallcr cgzs. By suppl-cmznting t h c Ciqt ' i ~ i t h m i n o a c i d s t o b r i n g the d i c t z r y t o t 2 1 t o 1 . 2 5
x
t h e n i n i m m r e q u i r e - ment c s t i r ~ t e s of t?ol?nson m d F i s h e r l c 5 8 or w i t h 7.68%t e i n
t o
13.1$, normal production was obtained. Heywang e t a l . (1963) found t h a t a l e v e l of 0.41-
0.44 percent- -
methionine plus c y s t i n e per therm metabolizable energy per lb. was adequate f o r egg production under t h e condition
of
t h e i r s t u d i e s . Scott- -
e t a l . (1969) s t a t e d t h a t t h e amino acid requirement may d i f f e r depending upon the balance of o t h e r e s s e n t i a l amino a c i d s i n the p r o t e i n being fed, The requirements oflysine,
mothionine o r methionine and c y s t i n e of l a y i n g hens a r e 0.5 percent,0.53
percent, 0.28 percent and 0.25 percent r e s p e c t i v e l y (N. 3. C.,1971).
Calciuz and phosphorus a r e the n i n e r a l s needed by laying hens a t the highest l e v e l s . Norris
- -
e tal.
(1934) de- monstrated t h a t 1.5 percent dietalry c a l c i 7 m was n o t s u f f i -c i e n t f o r good egg production, while 1.65 percent was j u s t adequate and 1.80 percent was found
t o
he optimum. Evans e t a1. (1944) reported t h a t hens receiving3.0
percent cal---
cium i n the d i e t gsve more s a t i s f a c t o r y r( r u l t s than re- ceiving higher o r lower l e v e l s when egp s h e l l thickness was used a s the c r i t e r i o n . But a -*-eve1 of 2.5 percent cal- cium a l s o r e s u l t e d i n a s s a t i s f a c t o q ~ production a s one
/
2 . 3
percent c ~ , l c i ~ m 3,nd 0.8 perccnt phosphorus, t h e requi- rements w i l lvary
w i t h i n wid.e limits depending 011 t h e r a t eof egg produ-ction (FJinter m ~ d Funk, 1-956). Moistort (1960) reported t h a t f o r optimum egg s h e l l q u a l i t y hens i n bat- t e r i e s required 2 . 5 t o 3.5 percent C- i n zn 211 mash d i c t . Bergdoll (1968) a t z t c d t 1 v w t with c e r t a i n s t r z i n s o f b i r d s housed
i n
cages 2nd l a y i n g a t r::tea of 80 t o90
percent, t h e c a l c i w l requircmc~it r~ould be c?.rowicl 3.75 perccnt of t h e t o t a l r ~ . t i o n . Hc a l s o soid t h a t b i r d s i n cages seem t o have a h i g h e r requirement f o r czlciurrr th7n do f l o o r l a y e r s .Summers
2.
(1970) stq,tc;.' t h q t t h e percentage of Fro- t e i n .~nr'rr c ~ . l c i u m i n % rcttion c'I~uIC~ vcry nccorcling t o t h eenergy content of t h c r2tior1.
It
i s t u e t o t h e f a c t t h z t t h e hen e a t s mlinly t o sL:<tisfy i t s energy requirement. The c z l c i ~ ~ m x q u i r e m e n t of lagin: hen3 t h s t zre s u b j e c t e dt o a tdnper-ture of 3 2 ' ~ ( 9 0 ' ~ ) o r more f o r s e v e r , ~ l weeks i s
3.0
t o3 . 5
percent ( 17. R. C . , 1971).P'Iasseligale 2nd Fl;.,tt (1930) found th?<t with a- l e - v e l
of
0.5 p ~ c e n t phosphorusin the
d i e tfee
t o l a y i n g hens, as good pToduction ?"s could be olYct.,i!~cd with h i g h e r l e v e l s of p h o a ~ l ~ o r u s . I n t h c work of No-ria&.
(1934), 0.5 pcrccnt phosphorus w a s found t o be i n s u f f i c i e n t f o r m ~ i n t a i n i n g no-ma1 e g g ~ r o d . u c t i o n , ~ r h i l e0.75
percent ap-h i g h e r e g y p r o d u c t i o n t h s n d i e t s cont ~ i n i n g e i t h q r more o r l e s s of t h i s n u t r i e n t . M i t c h e l l ~ ~ n d ~ p T c C l u r c (1937) s t 3 t e d t h , a t l c v o l of 0.32 p e r c e n t phnxphorua should be s u f f i c i e n t f o r a l e v e l
of
50 ~ , ? r c c ? i t p r o d u c t i o n i f h l l f of t h e phosphorus hthe
d i e t i s u t i l i z e d . The f i n d i n g sc m t d i f f e r e n c e s i n produc-tion of l a y i n g hens f c d 0.9 and 1 . 2 ~ e r c e n t d i c t l r y phosphorus. T i t u s (1939) recornended t h a t 1,C p s r c e n t of phospl~orus alioul_3 bc incl.udcd i n t h e complete d i e t . Nowotarski -:ad B i r d
(3943)
found thak t h e xrdount of phoophorua r e rjuircc? f o r ?nn:- i m m f j ~ o ~ . ~ L h m d T o rc
p r e ~ e i l t 5 . q ~ ~
of
r i c k e t s , w n screate,:
th-YI.0 . 5
7clcrcent and t h a t vit-tmin D reducec? -blic L-.mount of r n i u 7 r ~ ? - - ~ l ? ricedw! f o r b e s t resl:.lts, 0 'Tiourke&,
(1955
) r.zpo-?tcd t h s t n o t more th7~1.0,43
p e r c e n t of d - i e t z r y pho7phorus w s s needed t o maint -:in e g g p r o d u c t i o n a t a non51-.,l l e v e l . 02 t h e ba- s i s of 3Tu-trictnt Requircmcnts o f F O U ~ ~ ~ T T l h I i s h ~ ( ? by Na- t i o n a l R e s e r v c h C o ~ m c i l 1971, t h e a-ici- 7,ry 32lioaphor1zs r e -.
quirement of s t a r t i n g chiclten;;,
g-
,o?[:inc c h i c k e n s , h y i n g hens ,md b r e c d r i n ~ kens 51-o0.7
yci-cc?'c;, 0.4 pcrce~l'c, 0.6 p e r c e n t and 0.5 p c r c z n trs
xpcctivcly.-zmg (1969) s t a t e d about
57.3
p e r c e n t crude p r o t e i n , Thr- 't h a t f i s h
meal
was an e x c e l l e n t s o u r c e o f p r o t e i n avld mo- d e r a t e source of encrgy. Its n u t r i t i v e v21ue w a s b e t t e r t h a n t h 3 t of meat A Y ~ bone m e d . Thc s t 2 t c n e n t s of S c o t tg&
&.
(1969) s u p p o ~ t e d t h e c o n c l u s i o n t h a t f i s h m c a l i s an ~ ? s c c l l e n t source of p r o t c i n Zi,r p ~ u l t ~ r becauseIt
con- t a i n s zdcqu.2-tc. qu,xnt i t i e a of -_-1.11 e s s a n t i ~ . l m i n o ctcids r e - quired by chiclrcns, <and i s al especi:tlly zood source of l y s i n c nnd me t h i o n i n e.
It h:?.,s becli shorm t h c t TTFT s!;ybea~zs i n t h e l z y i n g d i e t can bc: ire11 t o l e r 7 , t c d by h y i n g hcns. T i s h c r rrld
Johnsol? (1958) ~ e p 3 r t e d tl i a t supplcmc:.r-l- :,-hiicxi of f i f t e e l n p e r c e n t rmr s o y b e m m o t e i n with e i t h e r : n i x t u r c of e s - s e n t i d ?mi:io n c i 4 s knorni t o bc: w c l l b ? l ~ , ~ ? _ c c < o r w i t h egg albumen overcomes 111 t h e growth d e p r e s s i n g n c t i v i t y of raw me?,l, S7xcna
- -
et, ?,lo (1961) found tlz:t r-trra s o y b e mmeal rrhen used ? s the s o l c source of j i e ' ?,ry rotei in f o r c h i c k s 2.n6 p o u l t s , r e s u l t e d i n ?, slgn_i-i'icznt growth i n h i -
b i t i o n and rr3ducecl f c e d c f f i_clr:nc?/. ITd ikc?rt?-7:nn?~irc1 (1965) f o u r d t h n t c h i c k s ~ r o u l d g r o ~ %;74 u t i - l i y e f c e d c f -
f i c i e n t l y if 2 minimm o: 8 :3ercont
f
i v h mezl Trns used t or e p l a c e ,an c q u a l q.momt o l rnTs soybe-ln 1j1e7.l i n 2 corn
sogbc. XI d i e - t
.
C O ~ T F . m c ~ . l r c p r e s c n t s 7" r e l ~ ~ t i v c l y i n e x p e n s i v e
source o f p r o t c i n f o r pou-ltry f e e d i n g i n Indonesin.
20 t o 30 percent copra meal i n t h e 17,yin.g d i c t s . The l e - v e l of 30 percent copra meal appeared t o be t h e l i m i t , Mahadevan
- -
e t ax. (1957) regorted t h ~ t :% yd-bi.cn contsining20 percent coconut meal,
45
percent c e r e a l ,9
percent f i s h .meal, 2 1 percent r i c e b r a , 2 perter--b giylgclly c ~ k e 2nd3 perce,nt co:rpea, ~ ~ h c l i adequately s u 2 ~ l c n e a t e d with v i t a -
mins ,and minerals provided the best b::lzncc of n u t r i e n t s f o r ccononic e g g produc-kicn, Thom;:a r;ni Scott (1962) were i n zgrecment t h a t f i s h nccl and 3e::'~ s c r n p s wcrc good sup-
.-.
plements f o r copra metal i x chick d-iets 2-nd f i s h meal, blood meal and t o r u l a yeast a d e y ~ ~ a t e l y supglenented t h e copra meal i n h y i n g r z t i o n . Good growth 9-nd feed conversion
were obtnixed with d i e t s c ~ n t n i n i n g
40%
copra meal, ACornell study indicated t h ? t l e v e l of 40 percent of co- conut o i l n e z l could be used very SLT-ccesfully f o r both b r o i l e r s nnd l a y e r s i f t h e m i n o a c i d s were balanced by
addition of methionine
2nd.
l y s i n e o r P r i ~ ' ? meal, ?nd if f a t wzs added t o provide s~zfficiencl e1ierg-y i n t h e high coconut o i l meal r z t i o n (ScottG.
2.
,
1969).
Cremrel and Brooks (1971) stated? th?-t the p r o t e i n i n coconut meal hrd PA apparent d i g e s t i b i l i t y of 50.75. D i g e s t i b i l i t yc o e f f i c i e n t f o r nitrogen f r e e e x t r a c t , e t h e r e x t r a c t - a n d crude f i b e r were high i n d i e t s containing coconut meal; as a r e s u l t the d i g e s t i b l e energy content was high, 3.6
According t o Winter and Funk (1956), bre~:ding, feeding housing, d i s e a s e s , m?,ybe o t h e r f ?,ctors i n - fluence egg q u a l i t y a t t i n e of production. Gowe (1956) conducted x i experiment with seven s t r a i n s of Inkite
Leghorns kept in b n - t t c r i e s rb,nd f l o o r pcnz. He found t h a t egg weight w=ls s i g n i f i c a n t l y d i f f e r c n t be tween s t r z i n s
and betweell l o c a t i o n s . Thorton _ . - e t 2 1 . (1957) reported t h a t t h e supplementation of a c o r n b i n ~ ~ t i o n of l y s i n e and DL-methionine had a benef i c i a l e f f e c t on eZg wej-ght w i t h 17 and 1 5 percent p r o t e i n but vas n o t e f f e c t i v e with 11 percent plnotein. l l i l l e r
- -
e t 3.1. (1957) f e d l ' t ~ ~ i n g hens with r n t i o n s c o n t a i n i n g 1 2 . 5 t o 1 3 percent p r o t e i n m d supplying 871-
987 k c a lcf
producti-ve emxgy p e r pound, and found t h a t egg weight w a s no-t a f f e c t e d by t h e energy l e v e l s used when cmimal p r o t e i n was included i n -ther z t i o n . McIntyre and Aitken (1957) :?cported t h z t t h e
4
energy content of t h e r a t i o n ha2 110 ~ f f e n t on egg weight,
s p e c i f i c g r m i t y of eggs, and q u a l i t y of white ox i n c i - dence of blood and me:~t s p o t s . I11 tlzcir t r i a l , t h e y used
Barred Plymouth Rocks, 1lrhi.t~ Leghorns -ad crossbreds. Hochreich
-.
e t 31. (1958) r e p o r t e d t h a t p r o t e i n l e v e l s d i dWhite Leghorn p u l l e t s a t 28 weeks o f age which had had t h e high p r o t e i n , high energy r a t i o n t o 20 weeks l a i d heavier eggs, but t h i s tendency disappearsd a s t h e season advanced.
Griminger and Scott (1954) f e d
f o u r
groupso f
White Leghorn p u l l e t s with f o u r kinds o f all-mash r a t i o n s which d i f f e r e d only i n the type of c e r e a l g r a i n s employ- ed, They found t h a t d i f f e r e n t g r a i n s (corn, o a t s , wheat and @xed) d i d not influence egg weight, s h e l l thickness and the standing-up q u a l i t y of the egg white, The avera- ge H a u g h u n i t s i n t h e above order were 76.6; 76.5; 75.4;
\
76.0. Thorton
&1,
(1956) reported t h a t i n t e r n a l egg q u a l i t y as measured by Haugh u n i t s and s h e l l thickness w a s not a f f e c t e d by the d i f f e r e n t l e v e l s of protein. I nI
t h i s t r i a l they used f o w d i f f e r e n t all-vegetable b a s a l r a t i o n s containing 11,
1 3 ,
1 5
and 17% $ r o t e i n ; each of'
these
b a s a l r a t i o n s was suplemented with d i f f e r e n t l e v e l sof amino acids. Pepper
--
e t a l .(1959)
fom.d t h a t the qua- l i t y of f r e s h eggs o r eggs held f o r 14 days a t 55' mea- sured i n Haugh u n i t s was not affecked. b y e i t h e r t h e ener- gy content o f the r a t i o n o r the system of feeding. Pepper e t a 1 (1959) found t h a t the energy l e v e l of d i e t s used-
-*was found t h a t t h e r e
was
a n e s a t i v e c o r r e l a t i o n between egg q u a l i t yand
r a t e of egg production,> ~ u c l l e ~ ? (1959) conclu.cJ~ec? 3<1i a - p c r i n e n t ~ 5 t h
4
groups of 'dhite Leghorn l a y i n g p u . l l e t s key-t on a p r m t i - c a l a l l mash r a t i o n cant-ainin,? 2
.,34-
pe2:cen-i;Ca,
under t h e following concl-it ions of temperatura ,ada.d YC 1-stive humidity:0
8 5 ' ~
a,nd70
percerLR.5. ;
55
P
and7C
?srcenL Z.Ii. ; 85'3' and 25 percent. R..II. and_l~,mco~trol.le3. t \ ? m ~ a ? r ; - ~ t i l r e a n d . R,H. He foundthat
average s h e l l thic?kme s s z s,
i n c l u 6 i n g s h e l l membrane, i n t h e above o r d e r0.373,
6.400,
0,384 and0.392
mm
respectivel.gr, a98 a l l cliffe-ccd s-iy~ri.?i.c~,ntly. TT.interand
Pun.k (1955) st--,teG t1~t,l.-i; l - ? . y i ~ q hen per- formance i n cszes i s s l i g h t l y better th,-a og t h e f l o o r . Govre(1956)
repor*'ced th;:t l z y i n g 1rar-k-:_lity t ~ < ~ s s i g n i f i -cantly
h i g h e ri n
pens -tI?c;.i? in % a t i ; s r i e s , art? t h e r e were s i g n i f i c a n t d i f f e r e n c e s between s-trai:?s i n each l o c z t i o n . Egg production esJi;ima.tcd c n t l ? ? h a s i z of 'ien-housed and hen-day produc'cion diffe?nec? s i g n i f l c a n t l y betlseen s t r a i n s and between l o c a t i o n . XacIn'~7j?~e ;,nc? Aitlccn (1959) foundI
that caced b i r d s laid feller =d. h e a v i e r eg@s t h z n b i r d s on t h e same d i e %
i n
f l o o r pens and consumed l e s s feed. B i r d s i n b a t t e r i e s a r e u s u a l l y l e e s a c t i v e than those on t h e f l o o r and, consequently, requ.ire l e s s energy. CageCard (1962) s t a t e d t h a t t o u s e bu-ilt-up l i t t e r may s i m p l i f y t h e f e e d i n g problem. This i s due t o t h e f a c t t h a t i n t h e f l o o r l i t t e r , t h e chicken can pick-v-p some products of i n t e s t i n a l s y n t h e s i s . Bnyd-er (1963) r e - p o r t e d tha-b a c c o r d i n g t o t h e comparison of t h e performance of b i r d s k e 2 t under s i x d i f f e r e n t s y s t e n s of housing, t h e b e s t performance (70% p r o d u c t i o n w i t h a 4 - 2
-
pound f e e d conversion) I J ~ X o b t a i n e d from b i r d s k e ~ t on t h e conven- t i o n a l f l o o r l i t t e r system. Rate of p r o d u c t i o n of colony cage l a y e r s w a s 6$ l e s s t h a n t h e f l o o r system andthe
per- formance of s i n g l e - b i r d - ~ e r - c a g e l a y e r s waa j u s t a l i t t l e l e s s t h a n t h e f l o o r b i r d s . Michalson(1904)
s a i d t h a t egg p r o d u c t i o n tended t o be lower i n cage houses t h a n i n f l o o r houses. It i s l a r g c l y due t c t h e r e s u l t of cage fa- t i g u e and a h i g h e r m o r t c l i t y i n csge l ~ o u s e s . Feed con- v e r s i o n a l s o tended t o be lower i n cages. ?helps (1971)s t a t e d t h a t l a y e r a i n c a g s s produced .-2or- blood s p o t s t h a n
o t h e r outward e f f e c t s on m o r t a l i t y r a t e were noted. According t o Pkielps (197O'b), t h e o p t i m a l f l o o r space allowance per b i r d and i d e a l r~11~1Der. of b i r l ? s p e r cage can va,ry independently of l a y i n g s t r z i n involved, t h e environmental c o n d i t i o n s , and t h e economic c l i m a t e c u r r e n t l y p r e v a i l i n g . The rninim~xii requirement of f e e d
trough space and f l o o r space under zi cage system f o r pul-
-
l e t s of around 1800-
2000 gm i n 9~eigh-k a t point-of-lay2
appear t o be 1.0 cm and 465 cm p e r hen r e s p e c t i v e l y
Phelps (1970b) s t a t e d t h a t wi-bh 90 sq. i n c h e s * ( 5 8 0 cm2) of f l o o r and
5
i n c h e s (12.7 e n s ) of t r o u g h pro-vided f o r 2 ,
3
and4
hens p e r cage, egg number d i d n o t d i f f e r s i g n i f i c a n t l y between t h o s e colony s i z e s . The h e n housed p r o d u c t i o n from 6-
b i r d cages was 5 eggs fewer thavl t h e average of t h e s r n s l l e r c o l o n i e s . With l a y e r s more d e n s e l y stocked a t 58 t o 72 sq. i n c k s (439 t o454
2
The t r i a l w a s s t a r t e d May 13, 1972 and t e r m i n a t e d May 18, 1973, over a p e r i o d of twelve months. This t r i a l w a s conducted i n t h e P o u l t r y D i v i s i o n , F a c u l t y of A n i m s l Husbandry, Bogor A g r i c u l t u r e 1 U n i v e r s i t y , Bogor.
A t o t a l of one thousand and f i f t y s i x six-month- o l d l a y i n g p u l l e t s of Babcock-300 f i n a l s t o c k were used i n t h i s study. The one day-old sexed p u l l e t s were o b t a i n e d from P, T. 3 i h a d i D i s t r i b u t i o n P o u l t r v Fai-m, Cileniber, Bogor and were r a i s e d i n t h e c x p e r i m c n t a l houses of t h e P o u l t r y D i v i s i o n , F a c u l t y of Anindl Eusbandry.
The l a y i n g p u l l e t s
were
d i s t r i b u t e d i n random -manner i n t o f o r t y e i g h t l o t s c o n s i s t i n g o f twenty two i n -d i v i d u a l s each. The experimental d e s i g n w a s a completely randomized d e s i g n w i t h
7
x 2 x 2 f a c t o r j - ; l arrmangement of t r e a t m e n t s , Twenty f o u r l o t s of 24C 7 300 cm f l o o r l a y i n gpens and twenty f o u r l o t s of 22
x
45
x 36 ern i n d i v i d u a l l a y i n g cages were used.All
i n d i v i d ~ ~ l l a y i n g cages werei
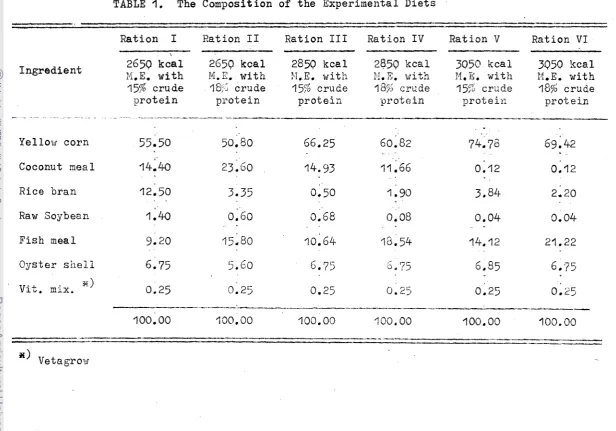
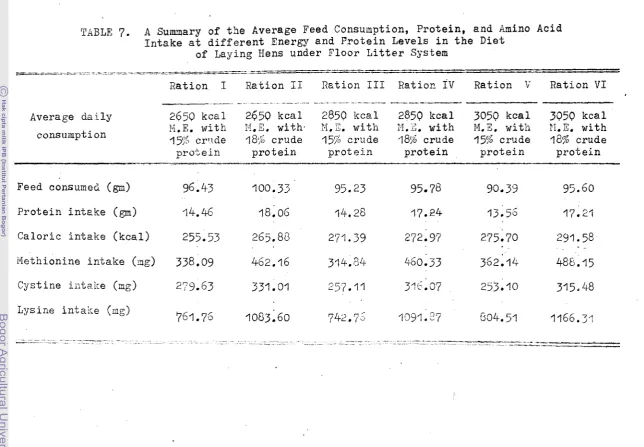
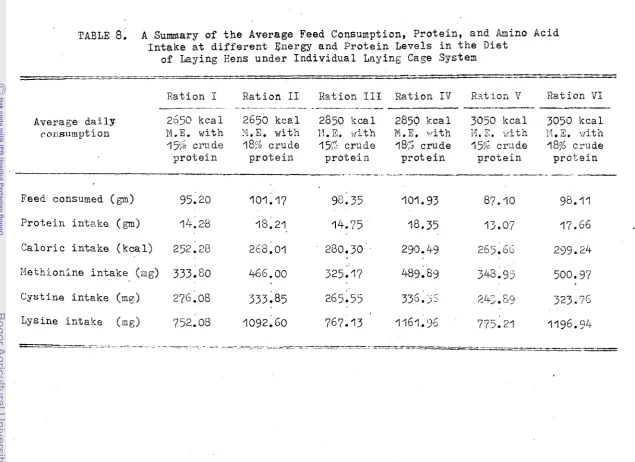
The d i e t s employed i n t h i s study were calculated t o contain 2650, 2850, 3050 k i l o cal.ories m e t a b o l i z ~ b l e energy per kg with 15 and 1 8 percent of crude p r o t e i n f o r each l e v e l of energy. The f e e d s t u f f s used i n t h i s ex-
periment were yellow corn, r i c e bran, coconut meal, soy- bean, f i s h meal, oysl&er s h e l l , and vitamin and mineral mixtures, A l l f e e d s t u f f s were purchased from the same sources during the t r i a l .
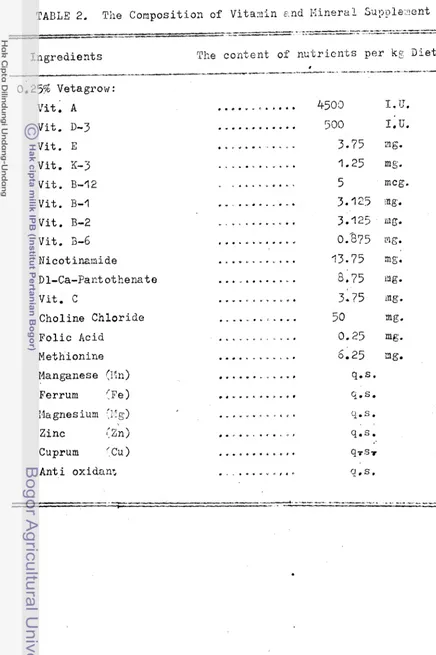
The composition of experimental d i e t s i s shown i n Table 1, and the composition of v i t a u i n and mineral mixtures i s shown i n Table 2,
The experimental d i e t s were formulated on t h e ba-
sis
of the 1Jutrien-t Requirements o f Poultry, published i n1971
by the National Research Council,J!"letaboliz,able energy, mineral, amino acid and v i -
tamin
B-complex contents o f the exgerimental d i e t s werecalculated baaed on analysis o f inyredi.e:~ts i n Table 9,6
i n
t h e Nutrition o f t h e ?hicken by Scott e t- -
al. (1969). Crude protein, crude fa;, crude f i b e r and ash were cal- culated according t o Lubts (1963'). Begin (1961) reported . t h a t t h e r e was very close agreement between t h e metabo-lizable
energy values calculated from a n a l y s i s of ingre- dients. and those detera;ln,sd i n a bomb calorimeter,Crude p r o t e i n , brude f i b e r , e t h e r e x t r a c t , ash and dry matter of the ra5ion were analyzed according t o the o f f i c i a l
A.O.
A,C, me$hods.TABLE 1. The C o m p o s i t i o n of t h e E x p e r i m e n t a l D i e t s
---
--
-
R a t i o n I R a t i o n I1 R a t i o n I11 R a t i o n I V R a t i o n V R a t i o n V I \
I n g r e d i e n t 15.E. 265Q k c a l 2650 kcal 2850 k c a l 2859 k c a l 305@ k c a l 3950 k c a l w i t h M.E. w i t h ?3.E. w i t h I . . i t F1.E:. w i t h T!!.E. with 15% c r u d e 16;; c r u d e
157;
c r u d e 157; c r ~ t d e 15% crude 18% c r u d ep r o t e i n p r o t e i n p r o t e i s p r o t e i n p r o t e i n p r o t e i n
Yellow c o r n 55.50 50.80 66.25 60:82 74.12 691 42
. -
Coconut mea 1 g4h-O 23.60 14.93 11 166 0.12 0.12
R i c e b r a n 12.50 3.35 0.50 1.90 3.84- 2-20 IU
. < P
Raw Soybean 1.40 0.60 0.68 0.08 0.04 0.04
F i s h meal 9.20 15.80 10.64 18.54 14.12 21.22
O y s t e r s h e l i 6.75 5.60 6.75 5.75 6.95 6.75
E >
[image:150.731.51.668.54.485.2]TABLE 2. T3:e C o n p o s i t i o n of V i t a - i n ~ n d K i n e r a 1 S n p p l e lent
----
_
_
I_I__
_
-
_
--
-
&- - --
- -- --
_l_._l___l__ " I__-_-p
I n g r e d i e n t s The c o r ~ t e n t of n a t r i c n t s p e r k p 3 1 e t
8
---- _ _ _ __-___X.I-.-- .._I..---_--
[image:151.532.46.482.62.717.2]0.25% Vetagrow :
...
Vit. A 4503 1. U.
V i t . D-3
V i t . E V i t . K-3
V i t . B-12 V i t . B-1 V i t . B-2
V i t . 3-6 N i c o t irnnj.de
Dl-Ca-Pact o t h e n z t e
500 I. 5.
3.75
1.25 mg.
5 mcg, 3.125 ~ng.
V i t , C . . r t . ' r r r r . 3 . 3+?5 1n.g.
C h o l i n e C h l o r i d e F o l i c Acid
M e t h i o n i n e
Manganese (1'2:) Ferrum / F e )
flagnesium ::Zg)
Z i n c (Zn)
Cuprum ' C t r )
Anti oxidan3
...
50
mg.. . . _ . . .
0.25 mg.. ., .. -. --LC. 6.25 ng.
y - s *
...
.."CL..D*O, Q.S.
Feed was mixed weekly f o r each pen. Feed and x a t e r were supplied
-
ad --- 1ihi.tu-n throug>isut t h e experiment.Azrbient ternperature was d s t c m i n e d by u s i n g
a
Thie s thermograph made i nGat
t i n g e n , Gc many.During t h e experiment, a l l t h e b i r d s were vacci- nated a g a i n s t 8Tewcastle d i s e a s e thrcugh t h e d r i n k i n g water a t foW month i n t e r v a l s . The vaccines of LaSota s t r a i n were obtained from t h e Facultjr of Veterinary Science, Bogor A g r i c u l t u r a l University. To c c y t ~ o l t h e i n t e r n a l p a r a s i t e s during t h e experiment, 211 t h e bird^ were t r e a t e d with IfJorrn
-
X
made by P f i z e r one i n every two months.The percentage of e z g production f r o n each l o t was c a l c u l a t e d on t h e hen-day b a s i s and on hen-housed ba- sis.
Egg q u a l i t y based on Baugh u n i t s was determined by breaking out and examining a l l eggs c o l l e c t e d a t room
\
temperature
,
i l l t h r e e conse ct?t;ive d a,?.ach
~ ~month duringt h e t r i a l .
S h e l l t h i c k n e s s excluding irliell membrane was measured by using a S t a r r e t micrometer no.
433
-
25
M.M,
.
'made by t h e
L.
S, S t a r r c t Co, Athol Mass. U.S.A.
Feed con~rersion was determined by u s i n g t h e forinula :
27
. A ' - >
-3
*e
3
Throughout t h e e x p e r b e n t egg,production, feed 4
d
~onsumptlon~
water conaump~ion,
egg q u s l f t y and m o r t a l i t y 'were
recorded and summarizedat
28-day i n t e r v a l s ,A11
dets,
except f o r egg productionand
mortali- 'ty
which were<reviouslJr
trznsformedu t i l i z i n g
t h earcs@
.
Gransf
ormation, were d i r e c t l y submittedt o
the
analysia'of
?;cl
' <?
variance
( S t e e l T o r r i e , 1960). r V 1 %ma:-js
V
To f i g u r e out
the
economical aspectsof
theva-
trious
r a t i o n s used in t h i s study, t h e incomeover
feed6 -
c o a t ' p e r hen per year was uaed as the . c r i t s r i o n , The cal-
*u;
c u l a t i o n
o f
it
w a s based. on the m e r a z e p r i c e s o ffeed-'
,4
qs t u f f s
able
2 1 ) and. eggs during thet r i a l ,
Thewerage
iof
t o t a l esg rreig'rit (kg) produced per hen per year oneach
treatment was calculated by means o f :The average
nmber o f
eggs p~oduced per hpn per 3ea.rX
tlze merage egg weight(ga)
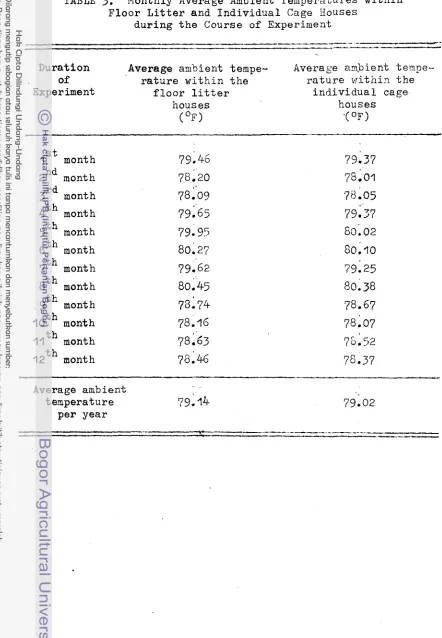
Ambient temperature
The average monthly temperatures each month
during the course
o f
the experiment a r e shotm i n Table3 .
The d a t a show t h a t t h e average monthly ambient tempera- t u r e s both within the f l o o r l i t t e r hougex and within t h e room where the i n d i v i d u a l laying cages were i n s t a l l e d , were n e a r l y the sane. There were only a l i g h t changes of
I
ambient temperature from month t o month during t h e t r i a l . The average ambient temperatures i n t h i s study a r e f a r above the conventional optimum temperatures f o r the layers. The conventional optimum ternpetwe f o r lay- ing hens i s about 55'- 6 0 ' ~ (winter and Funk, 1956). Hughes (1967) s t a t e d t h a t u n t i l a few years ago a l l
ex-
perimental evidence indicated t h a t the optimum tempera- t u r e f o r production was about 6 5 ' ~ arid t h a t performance c h a r a c t e r i s t i c s decrease s t e a d i l y a s temperaturei s
in-
creased. However, Hu-ghes (1967) a l s o reported thefindings of Payne t h a t r a t e of egg production increased with the i ~ c r e a s i n g temperature up t o a t l e a s t 86'~.
TABLE 3. Monthly Average Ambient Temperatures w i t h i n F l o o r L i t t e r and I n d i v i d n a l Cage Xouses
d u r i n g t h e C o u r s e o f E x p e r i m e n t
D u r a t i o n Average arn5ient tempe- Average a2,biect tempe- of r a t u r e w i t h i n t h e r a t u r e w i t h i 2 t h e Experiment f l o o r l i t t e r i n d i v i d u a l cage
h o u s e s h o u s e s
(OF> .( OF
1
'lSt month 2nd month
3rd month
t h
4 month 5 t h
month
6th month
7th
month8th month
1 , gth month
loth
month1lth month l p t h month
Average a m b i e n t
t e m p e r a t u r e 79.14
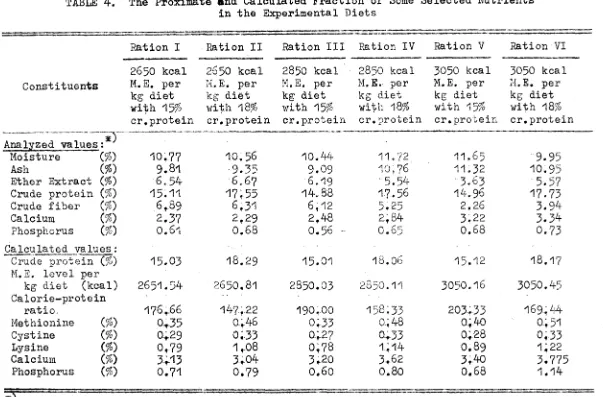
[image:155.511.30.472.68.706.2]TABLE 4. The Proximate and C a l c u l a t e d F r a c t i o n o f Some S e l e c t e d N u t r i e n t s i n the Experimental D i e t s
-
----
-
---
----
---...-
R a t i o n I Ration I1 Ration 111 b t i o n I V Ration V Ration V I
-
-
2650 k c a l 2550 k c a l 2850 k c a l 2850 k c a l 3050 k c a l 3050 k c a l
C o n s t i t u e n t s M.E.per 1.i.E. p e r M.E. p e r E4.E. p e r M.E. p e r I1.E. p e r
kg d i e t k g d i e t kg d i e t k g d i e t k g d i e t k g d i e t wit;h15% w i t h 1 8 % w i t h 1 5 % w i t i l l 8 % w i t h $ ? % with1870 c r , p r o t e i n c r . p r o t e i n c r . p r o t e i n c r , p r o C e i n c r . p r o t e i r L c r . p r o t e i n
Analyzed v a l u e s
:*I
Moisture (78Ash
($1
E t h e r E x t r a c t($1
Crude p r o t e i n($1
Crude f i b e r ($1 Calciura($1
P h o s p h ~ r u s (76)C a l c u l a t e d _values :
-.
Crude p r o $ e i n
($1
M.E. l e v e l perkg d i e t ( k c a l ) C a l o r i e - p r o t e i n
r a t i o .
Methionine (%)
Cyst i n e
($1
Lysine
($1
Calcium (%)
Phosphorus
($1
. - - . - -
[image:156.731.64.667.70.467.2]r e s u l t s were probably due t o t h e decrease
i n
n u t r i e n t s i n t a k e with the i n c r e a s e o f ambient temperature above 65'~.Proximate a n a l y s i s and c a l c u l a t e d values of n u t r i e n t content i n the experimental d i e t
The r e s u l t s of the proximkte a n a l y s i s according t o A.O.A.C. methods and the c a l c u l a t e d values of some s e l e c t e d n u t r i e n t s i n the experimental d i e t s a r e shotm i n 'Table
4.
From t h e d a t a 'i t
appeared t h a t t h e analyzed values of p r o t e i n content i n t h e d i e t s a r e i n c l o s eagreement with the calcula'ted values. This was a l s o
. t r u e of phosphorus. The analyzed values of calcium were somewhat lower than the c a l c u l a t e d values; however,
t h e r e was no problem of s h e l l q u a l i t y of the eggs ob- tained
In
t h i s stud.y. Apparently the calcium l e v e l s o f 2.29 t o3,34
were adequate even f o r the r a t h e r warn environment.The aata'show t h a t a l l o f the analyzed values of crude fibe-r m d f a t from t h e experimental d i e t s belong t o the range of crude f i b e r and f a t t h a t can be well t o l e r a t e d
by
the l a y i n g hans.&g production oq hen-day b a s i s
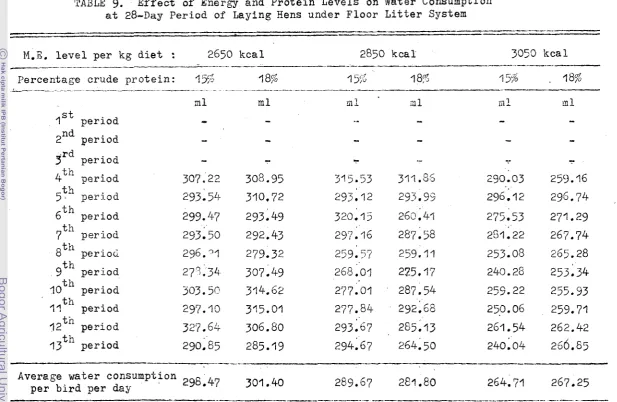
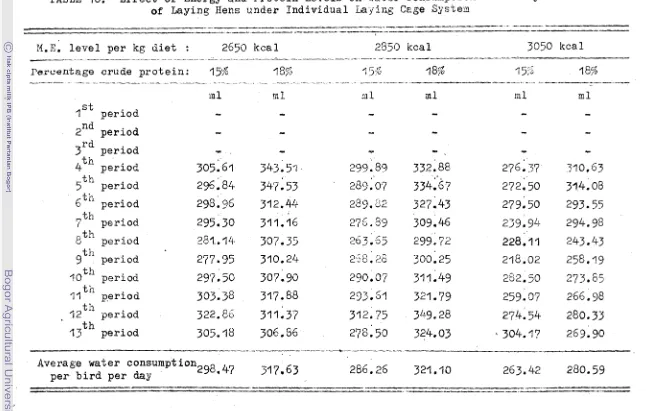
T'%BLE 5. E f f e c t of Energy and F r o t e i n Levels on Hen-Day Production a t 28-Day Period of L a y i n g Hens under F l o o r Litter S y s t e m
M.E. l e v e l per k g d i e t : 2650 k c a l 2850 k c a l 3053 kcal
A ---
_
_-_-
__---____
__upPercentage crude p r o t e i n : 15% 18% 15;; 1 8% 1
55
I 8$-
- -- - - ---
- - -- - - - - - - - --
- -- --
%
-
% $4 f-7 h %ro
lst p e r i o d 52.76 52.28 49.64 58.77 50.97 55.71
2nd
period 61.82 71.59 54.43 70.22 55.95 69.83
-
jrd p e r i o d 60.72 75.49 60,95 5'7.45 59.37 72.17
Q'n p e r i o d 66114 77.82
67.17 78.1% 67.75 76.60
W
, t h
p e r i o d 60.59 73.31 56.21 75.60 65.27 75.83 ;V
6 t l l
p e r i o d 65; 36 76.15 75.36 81.64
75.24
81.347t' p e r i o d 65.03 72.21 6E;.,ri 75*6? 65.24 74.99
8 t n
70.62 73.21 66. .i4 r- ' r
p e r i o d (y.39 a+. 0 5 78.43
gth period 73.68 83.44 P (a, ,- 25 79.SO 55. 33 80.85
Idti: period 73.02 60.88 74.82 77 $7 66.05 79.2'7
I l t h
p e r i o d 69.33 75.19 62.16 71
95
56.86 70.631 2 ~ ' p e r i o d 60.76 71 03 60.91 71.11 53. 1 2 69*54
1 3 p e r i o d ~ ~ . 63.66 69.62 59.78 67.83 55.03 67.59
Average egg production 6be96
-
TABLE
6.
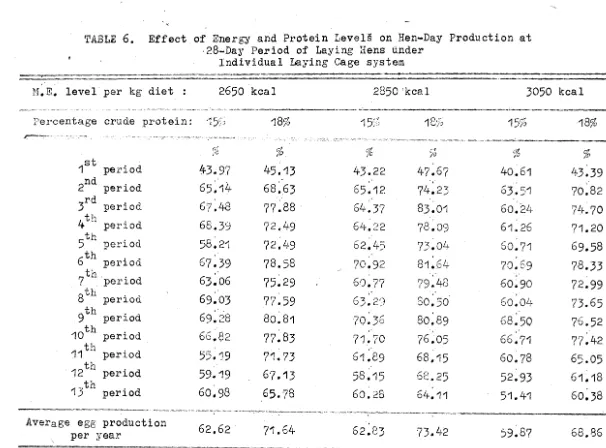
Effect of Xnergy s n d P r o t e i n LevelS on Hen-Day P r o d u c t i o n a t28-Day P e r i o d o f Laying Xens under
9
I n d i v i d u a l Laying Cage system
--
---
EI,E, l e v e l p e r k g d i e t : 2650 kca 1 2850 kc8 1 3050 kca 1
-- - - - - - ---
-
--
-
---
Percentage crude p r o t e i n : * I ~ ; I 18% 1 5 ; 1 ~5 1% 18%
lSt p e r i o d 43.97 45,13 43.22 47.6'7 40.61 43.39
end
p e r i o d 65;';4 68 :63 65.12 741 25 63.41 70.82jrd p e r i o d 67 148 77.88 64.37 83.01 60.24 74.70 4t"
p e r i o d 66.39 72.49 6 4 ; 2 2 $8.09 61.26 71.20 w
W
5th p e r i o d 58.21 72149 62,45 73.04- SO. 71 69.58
6th p e r i o d 67.39 78.58 70.92 81.64 79.69 78.33
1; il
7 p e r i o d 63 ;06 75.29 - 63.77 7914.3 50.90 72.99
8 t h
p e r i o d 69.03 77.59 63.2'3 SO. 50 50.04 73.65
t h
9 p e r i o d 69.28 80.81 70.36 80: 89 68.50 75.52
'loth p e r i o d 66.82 77.83 71.70 76:05 65
,
71 77.421lth p e r i o d 55.19 71 , 73 51 ;EP 68.15 60.78 65.05
1 2 ~ ~ p e r i o d 59.19 67.13 58.15 6C. 25 52.93 61.18
I j t h
p e r i o d 60.98 65.78 60.28 64111 51.41 60.38
Average egg p r o d u c t i o n
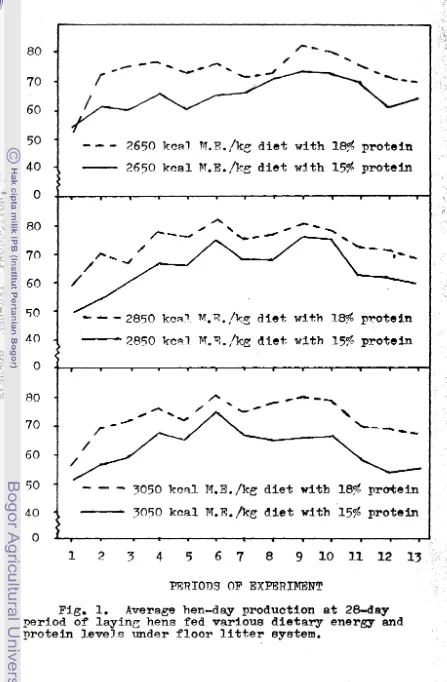
[image:159.745.58.664.29.477.2]d i e t a r y energy l e v e l s of 2650 and 2850 on egg production when averaged over a l l l e v e l s of proteir? under both system of housing, But, by f u r t h e r i n c r e a s i n g t h e energy l e v e l up
t o
3050 k c a l p e r . k g d i e t , egg production tended t o decrease(P
(
0,05).From the rough f i g u r e
it
appeared t h s t t h e medium energy l e v e l (2850 k c a l of metabolizstble energy per kg d i e t ) was s l i g h t l y superior - t o both l e v e l s oflow
and high d i e t a r y energy i n regard t o egg production though the average egg production of l a y i n g hens fed those t h r e e d i e t a r y energy regimens were not d i f f e r e n t s t a t i s t i c a l l y .The r a t e of egg production of t h e l a y i n g hens f e d d i e t s containing 18 percent crude p r o t e i n was s i g n i f i c a n t l y higher (P c110,Ol) than tha-t of l a y i n g hens f e d d i e t s
containing
15
percent p r o t e i n (Figures1
and
2 ) .This
results
i s noti n
agreement with the f i n d i n g s Heywang, Birdand
Va.vich(1955)
who reported tha-t t h e r e was no-
increase i n ezg p ~ o d u c t i o n when the p r o t e i n l e v e l s
i n
t h e d i e twere
g r e a t e r than 15 percent during hot weather.combination of the highest energy l e v e l (3050 k c a l of metabolizable energy per kg d i e t ) and 15 percent crude protein.
A t the b e s t combination of d i e t a r y energy and p r o t e i n l e v e l s in the d i e t s the average egg production on t h e hen-day b a s i s of the l a y i n g hens e i t h e r under t h e
.
f l o o r l i t t e r system o r under the individual cage system was about 267 eggs per year and,
it
was t h e same a s t h e best average egg production per year of t h e l a y i n g b i r d s of t h e same s t r a i n (Babcock-
300 f i n a l s t o c k ) a t !Twelfth Wisconsin Random Sample Egg Production Test 1967, i n c l t ~ d i n g t h r e e year average d a t a .The best d i e t a r y combination o f energy p r o t e i n l e v e l i n t h i s study d<es not agree with the f i n d i n g s of Karunajeewa (1972) who found t h a t the combination of
'2840
k c a l of metabolizable energy and1 5
percent crude protein was the most e f f i c i e n t combination o f d i e t a r y Proteinand
energy l e v e l s under t h e condition of h i sTl~e r a t e of egg production of the l a y i n g hena under the fxoor l i t t e r system i s s i g n i f i c a n t l y higher
--
P -
rC
--
*/
-.
- 4 - .
/-
*- - -
2650
kca7~ , ~ . / k e
diet
w i t h185
protein1
-
2650 k c a l M . ~ . / ? r gdiet with
155
protein---
2850 kc37kg
diet
with 18% proteln-
2850 kca7-M.S./ke
diet; w i t h1.59
protein1
.
1 I.
1 1 I v.
v- -
(-.. '9050 kcnl.M.B.
/kgdiet wfth
18%pr&ein
-
3050 kcalM,R,,kf:
d i e twith 15%
proteinF E R I O D S
OF
EXPRRIMENTFig. 1, Avera.ge
hen-day
production a t 28-day [image:162.525.62.509.32.714.2]b i r d s could pick-up some p r o d u c t s of i n t e s t i n a l synthe- ses from t h e l i t t e r ( c a r d , 1962) which s t i m u l a t e d b e t - t e r egg production e s p e c i a l l y of l a y i n g hens f e d d i e t s c o n t a i n i n g 1 5 p e r c e n t p r o t e i n .
The r e s u l t s a g r e e w i t h t h e ,statement of Snyder (1963) who r e p o r t e d t h a t a c c o r d i n g t o t h e comparison of t h e performance of b i r d s k e p t under s i x d i f f e r e n t systems of housing, t h e b e s t perfor~nance (70 p e r c e n t p r o d u c t i o n w i t h a
4.2
-
pound f e e d c o n t 2 r s i o n ) w a s ob- t a i n e d from b i r d s k e p t on t h e c o n v e n t i c n a l f l o o r l i t t e r system. Michalson(1964)
supported t h i s c o n c l u s i o n t h a t egg p r o d u c t i o n tended t o be lower i n cage t h a n in f l o o r houses as a r e s u l t of cage f a t t g u e .Feed c o n s m p t i o n
I n c r e a s i n g t h e d i e t a r y energy l e v e l s from
2650
k c a l t o 3050 k c a l of met-.*bolizable e n e r c r p e r kg d i e t r e s u l t e d i n t h e h i g h l y ~ i ~ i f i c a n t d e c r e a s e
(P
4
0.01) of f e e d consumption p e r b i r d p e r day in