THE EFFECTS OF WORKING CAPITAL MANAGEMENT ON PROFITABILITY IN SMALL MANUFACTURING
COMPANIES LISTED ON INDONESIA STOCK EXCHANGE
RESEARCHER
LIA HERMANTO
The object of the research presented in this paper is to provide empirical evidence on the effects of working capital management on profitability in small
manufacturing companies listed in Indonesia Stock Exchange. Panel regressions (fixed effects) and instrumental variables were used to model a sample of 53 small manufacturing companies listed in Indonesia Stock Exchange, covering the time period 2012–2015. The empirical result showed the number of days account receivable and the number of days inventories had a negative effect to the
profitability (ROA), while the rest variables have no significant level. The number of days accounts receivable, the number of days inventories, current asset ratio, current liabilities ratio, the sales growth of the company, and the leverage had effect to the profitability (ROA) simultaneously with or without control variables. Moreover, managers can improve the firms’ profitability by shortening receivable conversion period and inventory conversion period.
STOCK EXCHANGE
(Undergraduate Thesis)
By
LIA HERMANTO
FACULTY OF ECONOMICS AND BUSINESS UNIVERSITY OF LAMPUNG
THE EFFECTS OF WORKING CAPITAL MANAGEMENT ON PROFITABILITY IN SMALL MANUFACTURING
COMPANIES LISTED ON INDONESIA STOCK EXCHANGE
RESEARCHER
LIA HERMANTO
The object of the research presented in this paper is to provide empirical evidence on the effects of working capital management on profitability in small
manufacturing companies listed in Indonesia Stock Exchange. Panel regressions (fixed effects) and instrumental variables were used to model a sample of 53 small manufacturing companies listed in Indonesia Stock Exchange, covering the time period 2012–2015. The empirical result showed the number of days account receivable and the number of days inventories had a negative effect to the
profitability (ROA), while the rest variables have no significant level. The number of days accounts receivable, the number of days inventories, current asset ratio, current liabilities ratio, the sales growth of the company, and the leverage had effect to the profitability (ROA) simultaneously with or without control variables. Moreover, managers can improve the firms’ profitability by shortening receivable conversion period and inventory conversion period.
STOCK EXCHANGE
Researcher
LIA HERMANTO
Undergraduate Thesis
As One of Requirements to Achieve
BACHELOR OF ECONOMICS
In
Management Department
Faculty of Economics and Business University of Lampung
FACULTY OF ECONOMICS AND BUSINESS UNIVERSITY OF LAMPUNG
The author was born in Bandar Lampung on Wednesday, June, 6 1994, as the second child of three siblings. Daughter of Mr. Hermanto and Mrs. Misirah and the second sister of Eva Hermanto and Devi Hermanto.
Academic Study author begins by completing an education at Taman Indria Tamansiswa Kindergarten in 1999, and continue to Taman Muda Tamansiswa Elementary School in 2000, then went to SMPN 16 Bandar Lampung and graduated in 2009. In 2012, entering the next level of her education the author continued at SMAN 4 Bandar Lampung and graduated.
In 2012, the author was accepted as a student in University of Lampung entered with PMPAP test, Management Department in Economics and Business Faculty, then choose in Bilingual Class and took Financial concentration. In January 2015, the author did the local internship or KKN in Bima Sakti, Way Kanan for 40 days.
Now with full of struggle, hard work and learning process are relentless,
fully supported me. You are the truest blessing in my life. Without your love I am nothing and I love you so much. I will try as hard as I can to make you both proud. "
My sisters, Eva Hermanto and Devi Hermanto
" Thank you for the prayers that have been given and the support that make the spirit in completing this thesis "
Lecturers and friends,
" Thank you for the direction and support that has been given me to be a better "
Beloved alma mater,
My Lord, Increase me in knowledge (20:114)
So Verily, with hardship, there is relief (94:5)
Don’t Decrease The Goal. Increase The Effort. –QQDStories
Be Stubborn About Your Goals, But Flexible With Your Methods. –Lia Hermanto
tremendous blessing that enabled me to accomplished this script entitled " The Effects of Working Capital Management on Profitability in Small Manufacturing Companies Listed On Indonesia Stock Exchange ". This script is submitted as a compulsory fulfillment of the requirements for S1 degree of Faculty of Economics and Business, University of Lampung.
It is important to be known that the script would never have come into existence without any supports, encouragements, and assistance by several amazing persons. It is the great honor for the researcher to make acknowledgement of indebtedness to convey her sincere gratitude to::
1. Prof. Dr. H. Satria Bangsawan, S.E., M.Si., as the Dean of the Faculty of Economics and Business, University of Lampung.
2. Dr. RR Erlina, S.E., M.M., as Chairman of the Management Faculty of Economics and Business, University of Lampung.
finalization of this thesis.
5. Dr. Ernie Hendrawaty, S.E., M.Si., as Primary Examiner's willingness to test, suggestions, criticism, advice and knowledge that has been given. 6. Prof. Dr. Mahatma Kufepaksi, S.E., M.B.A., as SecondExaminer’s
participating as well as providing advice and support to this thesis can be completed.
7. Muslimin, S.E., M.Si. as Academic Examiner’s participating as well as providing advice and support to this thesis can be completed.
8. The entire faculty majoring in Management, in particular on the faculty of concentration in Financial Management and the entire Faculty of
Economics and Business, University of Lampung which has given the science that supports the theory used to complete the thesis.
9. The whole family, especially the parents dear Hermanto and Misirah, Ci eva and empi over the string of prayer that never gave being said as well as the love and support that is endlessly given to the author.
10. Management Bilingual Class Batch 2012, Elidun, Laras, Ayu, Reza, Citra, Lele, Saput, Keke, Fadil, Dirga, Donna, Ucang, Abe, Kemas, Siska, Marlia, thank you for having my back in our almost 4 years of togetherness.
and the help during the difficult time
14. The second family from different mother and father, dr. Memet, bunda Tiara, ayuk Ebeth, sist Elidun, bro Septian, bro Denbur, Ferryansah a.k.a Jupe, Arini, Kak Ucok, Debo, Dhissa, Fani, Kak Ludi, Bang Zaid, bro Fahri and bro Randy. Thank you for the advice and support.
15. Close friends: Surtia aka Jisung, Calista aka Mbul, Meuthia aka Koday, Ratih, Aldo, Rana, Dimas, Azel, kak Bassma, kak Kiki, Kak Asep, Kak Inka, Selvi and others. Thank you for the laugh and relaxing time. 16. And beloved Organisations and people in, AIESEC, GenBI, EEC and
HMJ Management 2012. Thank you for giving the learning points and uncountable experience.
17. And groups of people in my life, AIESECers, Aiming for 8!, Alumni SMP 16 2009, Alumni Tamsis 2006, BBT, Bilingku, Box.Care, Buddies, HF & Volunteer, Dromen Cake, Gengs, Gims, Huru Hara, ICX GCDP
only reply with a thank you.
Hopefully, this script would give a positive contribution to the educational development and for those who are interested to conduct the further research.
Bandar Lampung, January 23rd2017
CONTENT LISTS
ABSTRACT ... i
CONTENT LISTS... ii
TABLE LISTS... iv
FIGURE LISTS ... vi
APPENDIX LISTS ... vii
I. INTRODUCTION ... 1
1.1 Background ... 1
1.2 Problem Formulation ... 9
1.3 Purpose of The Research ... 9
1.4 Research Benefit ... 10
II. LITERATURE REVIEW ... 11
2.1 Theoretical Basis ... 11
2.1.1 Definition of Working Capital ... 11
2.1.2 The Types of Working Capital ... 13
2.1.3 The Determination of Working Capital ... 15
2.1.4 Working Capital Sources and Uses ... 16
2.1.5 Profitability ... 20
2.1.2 The Small Companies ... 21
2.2 Previous Research ... 24
2.3 The Conceptual Framework ... 26
2.4 Hypothesis ... 29
III. RESEARCH METHODOLOGY ... 30
3.1 Research Object ... 30
3.1.1 Population and Sample ... 30
3.2 Research Design ... 32
3.2.1 Type and Source of Data ... 32
3.3 Research Variable and Operational Variable ... 33
3.3.1 Research Variable ... 33
3.3.2 Operational Variable ... 35
3.4. Analysis Tools ... 38
3.4.1 Descriptive Analysis ... 38
3.4.2 Multiple Linear Regression Analysis ... 39
3.4.3 Classical Assumption Testing ... 41
3.4.4 Hypothesis Testing ... 44
IV. RESULT AND EXPLANATORY ... 46
4.2 Model Testing…... 50
4.2.1 Chow Test ... 51
4.2.2 Hausman Test... 52
4.3 Classical Assumption Test ... 54
4.3.1 Normality Testing ... 55
4.3.2 Multicollinearity Testing ... 56
4.3.3 Heteroscedasticity Testing ... 57
4.3.4 Autocorrelation Testing ... 59
4.4 Hypothesis Testing ... 60
V. CONCLUSION AND SUGGESTION... 68
5.1 Conclusion ……... 68
5.2 Suggestions ... 69
BIBLIOGRAPHY………... 70
TABLE LISTS
Table 1 Summary of Previous Research ... 24
Table 2 Research Sample ... 32
Table 3 Result of Descriptive Statistics ... 46
Table 4 Results of Regression Using Pooled Least Square and Fixed Effect Approach (Summary) ... 51
Table 5 Chow Test (Selection between Fixed and Common Model) ... 52
Table 6 Regression Results from The Fixed Effects and Random Effects Approach (Summary) ... 53
Table 7 Hausman Test (Selection between Fixed and Random Effect Approach) ... 54
Table 8 Correlation Coefficient Calculation Results ... 56
Table 9 Chi-squareCount ... 58
Table 10 Summary ofStandard Errorand t Statistics ... 59
Table 12 Regression Results of Variables Return on Assets (ROA), The Number of Days Accounts Receivable (AR), The Number of Days Inventories (INV), Current Asset Ratio (CAR), Current
FIGURE LISTS
Figure 1 Conceptual Framework ... 28
Figure 2 Decision Areas of Durbin-Watson Statistical Test ... 43
Figure 3 Jarque-Bera Normality Test Results ... 55
APPENDIX LISTS
Appendix 1 The Companies List of Research Sample ... 74
Appendix 2 The Data of Sample Companies ... 75
Appendix 3 The result of Descriptive Statistics ... 80
Appendix 4 Chow Test (Selecting Pooled Least Square and Fixed Effect Approach) ... 81
Appendix 5 Hausman Test (Selecting between Fixed and Random Effect Approach) ... 82
Appendix 6 The Regression Result Using Pooled Least Square Effect Approach ... 83
Appendix 7 The Regression Result Using Random Effect Approach ... 84
Appendix 8 The Regression Result Using Fixed Effect Approach ... 85
Appendix 9 Heterocedasticity Test (R square) ... 85
Appendix 10 Standard Error and t Statistics Before Heterocedastiscity Recovery ... 86
Appendix 11 Standar Error and t Statistics After Heterocedastiscity Recovery ... 86
Appendix 12 Durbin Watson Statistics Result... 86
I. INTRODUCTION
1.1 Background
Indonesia is one of developing countries in the world. The economics character of Indonesia is not much different from other developing countries. The economic growth in the purpose and process are facing the problem in fulfilling the capital that will be invested in its development. In another side, the developments of technology are significantly increased; there are many same companies in the production which make the competitiveness continuously increase. From those ways make the management of the company complicate. From the current condition, the economics of Indonesia is not stable, with the result, it is hard for the companies to survive with that kind of conditions. It greatly affects the
policies that are embraced by the company. Not infrequently, the company should change the adopted policy in order to improve and intensify the policies are running.
running and build management by conceptual also systematically through the resources throughout the company.
One of the important resources of the company is financial resources, the, i.e., working capital. The working capital sense here has a comprehensive meaning covering other aspects within to measure the value added to the company.
In order to create the profit, the capital maintenance has an important role. Due to the fact that, the manager in the company is not only thinking about how to get and choose the source of financial which needs to produce profit but also expected to monitor, control, also, restraint in capital utilization. Then, a manager has to take a decision and the right solution to enable the company which can run effectively and efficiency. And one of them is taking a decision regarding the working capital.
Good working capital management is very important in the financial sector
because of mistakes and errors in managing the working capital could the business activities become obstructed and even stopped. With the result that, made
existence the analysis of the company’s working capital is very important to know the situation of working capital at this time. Subsequently, it is linked to the financial situation that will be faced in the future. From this information, it can be defined what the programs make, or the steps should be taken to overcome.
Working Capital Management is very influential in decision-making regarding the amount and the composition of current assets and how to defray these assets. The companies which cannot consider the satisfaction of working capital level, accordingly the company has the possibility to get insolvency and even
liquidation. Current assets must be substantial to cover the current liabilities, thus depicts a satisfactory safety margin. Meanwhile, if the company establishes excessive working capital will affect the company over liquid.
The working capital has flexibility, the proportions of working capital can be increased or decreased according to the necessary of the company. Assign the working capital which consists of cash, accounts receivable; inventories should be used as efficiently as possible. The amount of working capital should be
capital in the form of cash and securities could disserve the company because it causes for a large fund without the use productively. Besides that, the working capital also will inflict inefficiency and extravagance in the operations of the company.
The existence of efficiency the working capital can be seen from the receivable turnover and inventories turnover. The working capital turnover starts from when the cash invested in the working capital components until back into the cash. The shorter and faster turnover of working capital, then the company is more efficient.
According to Munawir (2004), determining the efficient working capital policy, the companies face the problem of liquidity and profitability. If the company decides to expand the amount of working capital, then the level of liquidity will be maintained, but it also decreases the level of profitability because the
If the company uses more debt than own capital, this may affect profitability decline due to the interest expense must pay to the creditors also increased. So, if the company decides to escalate the debt quantity, this means increasing the financial risk. Moreover, when the company cannot manage the debt properly, then it will affect negatively and reduce the profitability. Conversely, if the company can manage the financial sources well and can be used for investments in productive projects, it will affect positively and increased the profitability.
The past research has also been conducted by Deloof (2003) to the 1009 non-financial companies in Belgium from 1992 to 1996, entitled “Does working
capital management affect profitability of Belgian firms?.”the used dependent variable: Gross Operating Income, independent variables: sales growth ratio, financial debt ratio, fixed financial assets ratio, number of days account
of days accounts payable, decreased, then there will be an increase in gross operating income.
Subsequent research conducted by Yunus (2005) to the consumer goods industry sector companies listed on the Indonesia Stock Exchange, entitled "Effect of working capital on profitability in the company's food and beverage industry sectors listed on the Indonesia Stock Exchange." The used variables are similar to the used variables by Deloof, but there are some differences in the results of research conducted by Deloof. The results of Yunus showed that the only financial debt ratio, fixed financial assets ratio, and a number of days accounts receivable variables have significant results and variable sales growth ratio, the number of days inventories, accounts payable, and cash conversion cycle has no effect significantly to the gross operating income ratio. While the research of Deloof only variable cash conversion cycle that has no significant effect on gross operating income.
Small to Medium-sized Enterprise (SMEs) covering the period 1996-2002. Where measure ROA the return on assets, AR the number of days accounts receivable, INV the number of days inventories, AP the number of days accounts payable, CCC the cash conversion cycle, SIZE the company size, SGROW the sales growth, DEBT the debt level, and GDPGR the annual GDP growth.
The follow-up result comes from Gama (2015), it can be concluded that the negative relationship with profitability was found for INV, AP and CCC variables. In order to control, it also for possible endogeneity problems, an
alternative, consisting on the regression with instrumental variables, the result are similar to those obtained with the fixed effects regression except for the AR variable, which displays a positive relationship. Regarding the control variables SIZE, SGROW, GDPGR, CLR and DEBT, all of them statistically significant, the relation with profitability is positive for the first four, and negative for the last one.
profitability of small company stocks. Large-cap company has an annual return larger than the small capitalization companies; These results led to debate whether this difference is only temporary or will occur in the long term.
Regardless of differences of opinion can be concluded, that the size of the company's market capitalization is a risk factor to be reckoned in calculating the rate of return shares. A theory that holds that smaller firms, or those companies with a small market capitalization, outperform larger companies. This market anomaly is a factor used to explain superior returns in the Three Factor Model, created by Fama and French - the three factors being the market return, companies with high book-to-market values, and small stock capitalization.
Knowing which industries generally provide the highest returns is one way to explore investments of time and money. Sageworks, a financial information company, recently conducted a financial statement analysis of privately held companies. From that information, this study tried to use the small company for the sample. That shows the earliest empirical evidence regarding the size effect, i.e., the tendency of stocks of small companies that have a higher return than stocks of large companies. Banz (1981)
There are two things that have to concern based on the mismatch results in several studies described before, some studies state the number of days accounts
on Indonesia Stock Exchange.”
1.2 Problem Formulation
This is important to give analysis and ideas of the working capital management. Based on the effects described in the background, then the authors formulate problem as follows:
1. Does the working capital management affect the profitability in small manufacturing companies listed on the Indonesia Stock Exchange, covering the time period 2012–2015?
2. Which variable related to the management working capital has the most dominant influence on profitability ?
1.3 Purpose of The Research
Based on the formulation of the problem that has been described, the purposes of this research are:
1. To analyze the effect of working capital management on the profitability of small manufacturing companies listed on the Indonesia Stock Exchange. 2. To know the variable related to the management working capital has the most
1.4 Research Benefits
Based on the research findings on the effect of working capital on profitability in small manufacturing companies listed on Indonesia Stock Exchange, it will obtain the expected benefits of this research for parties as follows:
1. For academics, this study may provide empirical evidence about the effects of working capital management on company profitability, so it can provide in-depth insight and knowledge of the topics covered in this study.
2. For investors, can be taken as a consideration and evaluation in the outlook for the effects of working capital management on company profitability so that it can assist in making investment decisions in the company.
II. LITERATURE REVIEW
2.1 Theoretical Basis
2.1.1 Definition of Working Capital
Working Capital is something that always needed for any company in every field, even it is for service companies as well as manufacture companies for financing the business activities. Furthermore, the company has expectation funds released can be re-entered into the company in the relatively short period. Definition of capital in the company is not a unity of the opinion yet among the economist. To consider the definition of capital, the authors expressed the opinion from some economists that provides the definitions of capital. The definition of working capital according to Djarwanto (2001) is related to the total funds used during the accounting the certain accounting period is intended to generate revenue for the concerned accounting period (current income). The Weston and Brigham (1994) propound that working capital is the investment of the company in short-term assets, such as cash, marketable securities, accounts receivable and inventories.
while the shortage of the inventories will generate the company unable to make the profit because the client canceled to buy the products of the company so there is no such receivable. Munawir (2004)
Zariyawati et al. (2009) stated that working capital is an important issue in corporate financial decisions. Management working capital is the efforts of the company to maintain the liquidity of the company in daily operations which can run well while on the other hand the company can still suffice the short term obligations. The manager of the company who cannot manage a company with good working capital will affect the growth and the profitability of the company which will eventually bring the company to the financial distress and bankruptcy.
short-term financial management is managing each current assets of the company (cash, marketable securities, accounts receivable and inventories) and liabilities (accounts payable, notes payable, accrued liabilities) to achieve a balance between the profit and the risk which can make a positive contribution to the value of the company, for instance:
1. Current assets in large amounts consequently reduce the profits.
2. Current assets in small amounts, as a result, increase the risk of non-payment. 3. Current liabilities in large amounts consequently may increase the risk which
cannot pay at the due date.
2.1.2. The Types of Working Capital
According to Taylor in Sawir (2005) classify the working capital in two specific: the first is permanent working capital which must remain at the company to able run functional, or in other words continuously working capital required for the continuity for running the business. Whereas there are two specifics, which are the primary working capital: the minimum working capital which must exist in the company to ensure the continuity of the business, and the normal working capital: the amount of working capital needed to organise the normal production area. The second is the variable working capital which is the amount of working capital where the number fluctuates according to the changing circumstances.
which the number fluctuates due to the season fluctuations, secondly is cyclical: the working capital which the number fluctuates due to the conjuncture
fluctuations. And the last is emergency: working capital which the number fluctuates due to the unknown emergency situations previously (such as labour strikes, flood, or accidental alteration in economic circumstances).
According to Riyanto (2001), to fulfill the needs of working capital, on the top of that preferably financed the capital by minimally. However, the capital turnover of the company can be improved; the companies should seek the external funding to cover the needs of working capital. Then the company can use the principles of expenditure, videlicet:
1. The capital acquired as short-term loans can only be used to finance the working capital.
2. The Capital acquired as long-term or short-term loans then the first calculated in the critical time period.
economically, efficiency, and avoid the risk from the liquidity problems. To determine the enough working capital need to determine the factors that affect the working capital. According to Riyanto (2001) the size of the needs working capital depends on two factors, which are the expenditure of the average cash in daily or fixed turnover and the rotation period or dependent working capital period.
If the company is only running once the business, then the required working capital; sufficient working capital issued during one turnover period only. But in general, the company was established not intend for only running one the
business. For the company which mentioned, the working capital is not enough only the amount of one turnover period, but by the amount of the daily expense multiplied by the turnover period. Riyanto (2001).
production and also total current assets. A large number of current assets will reduce overall profits. The greater the level of current assets, the smaller the risk. The cash provides security in paying bills. Inventories provide a smaller risk, will need more goods for sale.
To determine the amount of working capital is considered sufficient for a
company is not an easy thing because the working capital needed by a company is influenced. The several factors are the nature or type of the company, the time is taken to produce goods which will sell, the terms of the purchase and sale, the level of turnover inventory, the sales volume and the seasons and cycles factors. Munawir (2004)
2.1.4. Working Capital Sources and Uses
Funding sources need to be separated to the permanent working capital
requirements and the variable working capital requirements. The variable working capital requirements where the working capital only needs to take a few moments and does not need a continuous basis (typically needs at the time in sales volume peak), it should be spent with short-term funding sources period or the time of the working capital needed.
Based on Munawir (2004) the working capital source in the company can come from:
a. The results of operations are the amount of net income that appears in the calculation of profit loss plus depreciation and amortization; this number indicates the amount of working capital that came from the result of the operations company.
b. Gain on sale of marketable securities (short-term investments). c. Sales of non-current assets.
d. The sale of shares or bonds
The amount of working capital that resulted from the operations company can be calculated by analyzing the income statements report of the company. With the gains or profits from the company business, and if the profits are not taken by the owner of the company, so the profits will increase the capital of the company concerned.
short-term investment was sold at a sale price equal to the acquisition price (without profit or loss), then sales of these securities will not affect the amount of working capital (working capital has not increased nor reduced). To analyze the sources of working capital, the resources derived from the gain on sale of securities must be separated with working capital that resulted from the company's principal
businesses. Munawir (2004)
Other sources that can supplement working capital are a result of sales of fixed assets, long-term investments and other non-current assets that are no longer needed by the company. Changes in these assets into cash or receivables will cause an increase in working capital of the sale proceeds. If the results of the sale of fixed assets or other non-current assets are not immediately used to replace the assets, it will cause the state of liquid assets large, so it exceeds the amount of working capital required (lack of working capital were exaggerated).
Besides the four sources above there is no longer any another source that can be obtained to add to its current assets, for example, the loan or credit from banks and other short-term loans also trade payables acquired from the seller or supplier. The increase in current assets offset or coupled with the increase in current
liabilities, so that the working capital (in the sense of net working capital) remains unchanged. Munawir (2004)
While Sawir (2005) sources will supplement working capital, videlicet: 1. An increase in the capital sector, whether from income or the rise of the
term debt.
Riyanto (2001), adding a source of working capital for the company should be used as efficiently as possible, and the company could run the operations of the company well, then the goals of the company can be achieved. However, the working capital has to be able to finance the expenditures over the daily
operations company. The use of working capital will lead to changes in the shape or decrease the amount of current assets owned by the company but does not always use current assets followed by change and decrease the amount of working capital of the company.
While Sawir (2005), the use of working capital which will reduce working capital as follows:
1. Reduced own capital because of losses, as well as the privacy decision by the owner of the company.
2. Payment of long-term debt.
3. The addition or purchase of fixed assets.
liquid assets (working capital is not reduced). Munawir (2004) the use of current assets that do not reduce working capital, such as:
1. Purchase of securities (marketable securities) in cash. 2. The purchase of a commodity or other materials in cash.
3. Change a form accounts receivable to other shapes, for example from trade receivables (accounts receivable) to notes receivable (notes receivable).
2.1.5. Profitability
According to Sawir (2005) definition, the ability Profitability is the net result of various policies and management decisions. Meanwhile, according to Tobing and Talankky in Ruwindas (2011), profitability is the ability to make a profit and the potential to earn revenue in the future which can be measured by return on equity (ROE) and return on assets (ROA). Based on the definitions, it concludes that profitability is the ability of the company makes a profit by doing a variety of policies and appropriate management decisions.
small and medium-size firms also can increase their profitability by shortening cash conversion cycle. Samiloglo and Demirgunes (2008) conducted a study to examine the relationship between working capital management and profitability. Applying multiple regression analyses over a sample of manufacturing firms listed in Istanbul stock exchange for the period of 1998-2007, they found that the accounts receivable cycle, the inventory conversion period have a negative impact on profitability, which means the shorter cycle of these variables causes
increasing in profitability.
2.1.6. The Small Companies
Small companies are viewed as an essential element of a healthy and vibrant economy. According to the report of Bolton, They are seen as vital to the
Working capital management (WCM) is of particular importance to the small business. With limited access to the long-term capital markets, these firms tend to rely more heavily on owner financing, trade credit and short-term bank loans to finance their needed investment in cash, accounts receivable and inventory. However, the failure rate among small businesses is very high compared to that of large businesses. The success factors or impediments that contribute to success or failure are categorized as internal and external factors. The factors categorized as external include financing (such as the availability of attractive financing), economic conditions, competition, government regulations, technology and environmental factors. While the internal factors are managerial skills, workforce, accounting systems and financial management practices.
While the performance levels of small businesses have traditionally been attributed to general managerial factors such as manufacturing, marketing and operations, working capital management may have a consequent impact on small business survival and growth (Kargar and Blumenthal, 1994). The management of working capital is important to the financial health of businesses of all sizes. The amounts invested in working capital are often high in proportion to the total assets employed and so it is vital that these amounts are used in an efficient and effective way. However, there is evidence that small businesses are not very good at
management of same should give the desired impact on either profitability or liquidity. If resources are blocked at the different stage of the supply chain, this will prolong the cash operating cycle. Although this might increase profitability (due to increase sales), it may also adversely affect the profitability if the costs tied up in working capital exceed the benefits of holding more inventory and/or granting more trade credit to customers.
According to Ang (1997) in Haryanto and Yunita, the grouping markets of companies are divided into three parts, as follows:
1. Large Capitalization
The large capitalization stocks are under common control that assessed market capitalization is large or larger than Rp 5 trillion. The large capitalizations value is called the first tier stocks.
2. Medium Capitalization
The medium capitalization stocks are under common control that assessed market capitalization is ranging between Rp 1 trillion to Rp 5 trillion. The medium capitalizations value is called the second tier stocks.
3. Small Capitalization
2.2 Previous Research
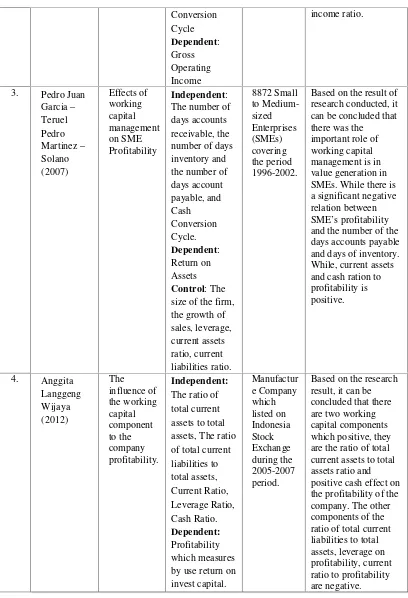
[image:44.595.114.525.273.751.2]In this research, the researchers tried to examine the effect of working capital management on firm profitability. This research is conducted because based on previous studies, they showed inconsistent results about the effect of working capital management, as presented in the following table:
Table 1. Summary of Previous Research
No Researcher Title Variable Sample Results
1. Marc Deloof (2003) Does working capital management affect the profitability of Belgian firms? Independent: Gross Operating Income, Sales Growth Ratio, Financial Debt Ratio, Fixed Financial Assets Ratio, Number of days account receivable, numbers of days account payable, cash conversion cycle. Dependent: Gross Operating Income Belgian Non-financial Firms covering the period 1992– 1996
Based on the results of research conducted, it can be concluded that there was a connection among sales growth ratio and fixed financial assets ratio to gross operating income.
Viceversa, financial debt ratio, the number of days account receivable, the number of days inventories, the number of days accounts payable to gross operating income is negative.
2. Dr. Hadori Yunus, Ak (2005) Effect of working capital on profitability in food and beverage industry sector listed on Indonesia Stock Exchange. Independent: Sales Growth, Financial Debt, Fixed Financial Assets, Number of days accounts receivable, Number of days inventories, Number of days accounts payable, and Cash Food and beverage industry sector listed on Indonesia Stock Exchange
Gross Operating Income 3. Pedro Juan
Garcia– Teruel Pedro Martinez– Solano (2007) Effects of working capital management on SME Profitability Independent: The number of days accounts receivable, the number of days inventory and the number of days account payable, and Cash Conversion Cycle. Dependent: Return on Assets
Control: The size of the firm, the growth of sales, leverage, current assets ratio, current liabilities ratio. 8872 Small to Medium-sized Enterprises (SMEs) covering the period 1996-2002.
Based on the result of research conducted, it can be concluded that there was the
important role of working capital management is in value generation in SMEs. While there is a significant negative relation between SME’s profitability
and the number of the days accounts payable and days of inventory. While, current assets and cash ration to profitability is positive. 4. Anggita Langgeng Wijaya (2012) The influence of the working capital component to the company profitability. Independent:
The ratio of total current assets to total assets, The ratio of total current liabilities to total assets, Current Ratio, Leverage Ratio, Cash Ratio. Dependent: Profitability which measures by use return on invest capital. Manufactur e Company which listed on Indonesia Stock Exchange during the 2005-2007 period.
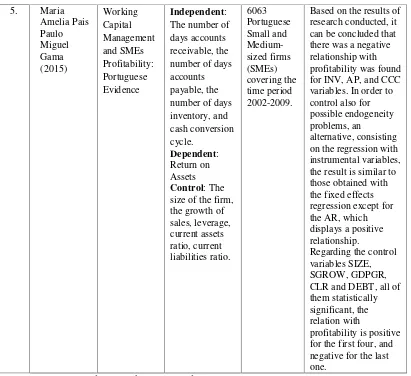
[image:45.595.114.522.112.710.2]Table 1. Summary of Previous Research (Continue) 5. Maria Amelia Pais Paulo Miguel Gama (2015) Working Capital Management and SMEs Profitability: Portuguese Evidence Independent: The number of days accounts receivable, the number of days accounts payable, the number of days inventory, and cash conversion cycle. Dependent: Return on Assets
Control: The size of the firm, the growth of sales, leverage, current assets ratio, current liabilities ratio. 6063 Portuguese Small and Medium-sized firms (SMEs) covering the time period 2002-2009.
Based on the results of research conducted, it can be concluded that there was a negative relationship with profitability was found for INV, AP, and CCC variables. In order to control also for possible endogeneity problems, an
alternative, consisting on the regression with instrumental variables, the result is similar to those obtained with the fixed effects regression except for the AR, which displays a positive relationship.
Regarding the control variables SIZE, SGROW, GDPGR, CLR and DEBT, all of them statistically significant, the relation with
profitability is positive for the first four, and negative for the last one.
Source: Journals and research, processed.
2.3 The Conceptual Framework
Financial executives have to make different decisions about the level of these components in order to the best results. The dynamic nature of short-term business emporium, the daily need to substituting current assets, and current liquidation liabilities help to clarify the importance of working capital
management and financial executive duties. The direct effect of working capital management on profitability and liquidity position of firms also refers the
importance of working capital management (Nobanee, Abdullatif, & Al Hajjar in Mansori, 2012).
Research by Gama (2012) found that one of the utmost important components of working capital which is the number of days accounts receivable is a positive effect on profitability. This contrast with research conducted by Garcia (2006) who found results that the number of days accounts receivable has no effect on the profitability.
According to Widhiarso, The more variables are controlled, the research we are doing more qualified. Of course, not all variables can be included in the control variables. Terms of the control variables are variables other than the independent variable that influences the dependent variable are based on a researcher who did with their researchers.
variables in the regressions that have been conducted by Deloof 2003, Garcia (2007) and Gama (2012).
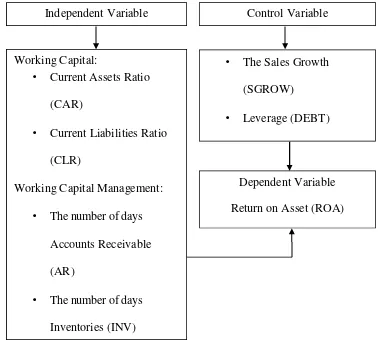
[image:48.595.130.509.234.574.2]Based on the description above, can be made framework that describes the relationship between the working capital management with profitability that shown in the following figure:
Figure 1. Conceptual Framework
Figure 1 before shows the relationship variables examined in this research, which this figure can be seen that the researchers will examine the effect of independent variables (AR, INV, CAR, and CLR) and control variable (SGROW, and DEBT) on the dependent variable (ROA).
• The Sales Growth (SGROW)
• Leverage (DEBT)
Independent Variable Control Variable
Working Capital:
• Current Assets Ratio (CAR)
• Current Liabilities Ratio (CLR)
Working Capital Management:
• The number of days Accounts Receivable (AR)
• The number of days Inventories (INV)
conceptual frameworkagainstchanneling research problem formulation, then the hypothesis proposed is as follows:
1. H0: The number of days accounts receivable, the number of days inventories, current asset, current liabilities, the sales growth, and leverage do not have the significant effect on the profitability of the company (return on asset).
III. RESEARCH METHODOLOGY
3.1 Research Object
3.1.1. Population and Sample
Although we do not shop directly in manufacture place, but most of the products that we use every day come from manufacturing business. The foods that we consume, the phone that everyone has and the computer or laptop we are using right now are all products that were assembled and created as part of a
manufacturing business.
Hill said that a manufacturing business is any business that uses components, parts or raw materials to make a finished good. These finished goods can be sold directly to consumers or to other manufacturing businesses that use them for making a different product. Manufacturing businesses in today's world are
normally comprised of machines, robots, computers and humans that all work in a specific manner to create a product.
and other rights are negotiated (Hill).
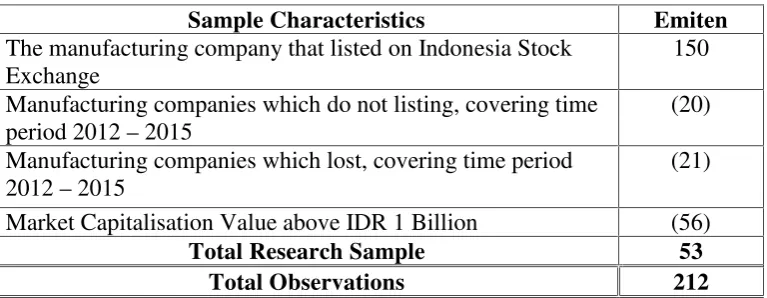
From the explanation above, the population in this research will be all of the manufacture companies listed on Indonesia Stock Exchange in 2012–2015, as many as 150 companies. Samples were taken from population by purposive sampling method with several criteria must be met as follows:
1. The company listed on Indonesia Stock Exchange (IDX).
2. The company has presented the complete financial report, covering the time period 2012–2015.
3. The sample of the company has the needed information during the period in this study.
4. Small manufacturing company.
Small manufacturing companies were chosen by the total assets as a proxy of variable size companies. This is because the total assets of more stable and representative in showing the size of the company than the market capitalization and sales are heavily influenced by demand and supply. (Sudarmadji and Sularto, 2007)
According to Bull, he defined the small company universe by market
consolidated financial results in each portfolio at the point of construction. In this research to ensure defining the small manufacturing company, the data has
processed. It showed all of the total asset and the size of the firm was measured as the logarithm of assets. Then the researcher ranks the remaining companies by those fundamental so that further exclusions can be applied based on either or both measures.
[image:52.595.116.500.345.494.2]Based on the criteria outlined above, then we obtained all of the population as the sample and shown in the following table:
Table 2. Research Sample
Sample Characteristics Emiten
The manufacturing company that listed on Indonesia Stock Exchange
150 Manufacturing companies which do not listing, covering time
period 2012–2015
(20) Manufacturing companies which lost, covering time period
2012–2015
(21) Market Capitalisation Value above IDR 1 Billion (56)
Total Research Sample 53
Total Observations 212
Source: data processed
3.2 Research Design
3.2.1. Type and Source of Data
The data used in this research is panel data, which the panel data is a combination of time series data and cross-section data. Meanwhile, the data used in this
Secondary data in this research in the form of annual reports from manufacturing companies listed on Indonesia Stock Exchange in 2012–2015. Meanwhile, a source of quantitative data used in this research is audited company's financial statements as well as journals and other support references.
3.3 Research Variable and Operational Variable
3.3.1. Research Variable
The variables in this study consisted of three variables, namely the dependent variable / dependent (Y), the independent variable / free (X) and the control variable (X). So based on the issues that have been discussed previously, the variables to be analyzed are grouped into:
1. Dependent Variable
achieved by the company and the better the company's position in terms of the use of its assets. (Garcia, Gama, and Yuliati, 2013)
2. Independent Variable
Independent variables are variables that describe or affect other variables. The dependent variable in this company is working capital with sub-variables; The number of days Accounts Receivable (X1), The number of days Inventories (X2), Current Asset Ratio (X3), Current Liabilities Ratio (X4). Each variable is
expressed with a notation AR, INV, CAR, and CLR sequentially. And these are the explanation of the reason using these variables for working capital
variable is expressed with a notation SGROW and DEBT sequentially. (Garcia-Teruel and Martinez-Solano, 2007; and Gama, 2015)
3.3.2. Operational Variable
1. Dependent Variable
The dependent variable used in this research is returned on assets ratio (ROA) of the companies. Return on assets of the companies is a measurement of the ability of the company as a whole in making the profit by the number of assets available within the company.
ROA = Earnings After Tax
Total Assets × 100%
2. Independent Variable
Working capital is the company's investment in short-term assets such as cash, marketable securities and accounts receivable. The sub-variables:
a. The Number of Days Account Receivables
reputable customers, as well as its ability to collect cash from them. Agency theory as a basic in understanding corporate governance.
The formula for accounts receivable days is:
AR = Accounts Receivable
Annual Revenue × Number of days in the year
b. The Number of Days Inventories
Days' sales in inventory (DSI) are a way to measure the average time required for a company to convert its inventory into sales. A small number of days' sales in inventory indicate that a company is more efficient at selling off its inventory.
The days' sales in inventory figure are intended for the use of an outside financial analyst who is using ratio analysis to estimate the performance of a company. The metric is less commonly used within a business since employees can access detailed reports that reveal exactly which inventory items are selling better or worse than average. The formula is:
INV = Inventory
The cost of goods sold × 365
c. Current assets ratio
A current asset is an item on an entity's balance sheet that is either cash, a cash equivalent, or which can be converted into cash within one year.
It can be formulated as follows (Gama, Maria A P P M. 2015):
able to meet its short-term obligations.
d. Current Liabilities Ratio
A current liability is an obligation that is payable within one year. The cluster of liabilities comprising current liabilities is closely watched, for a business must have sufficient liquidity to ensure that they can be paid off when due.
It can be formulated as follows (Gama, Maria A P P M. 2015):
CLR = Current Liabilities Total Liabilities
3.Control Variable
Researchers began developing the research with complex designs. Testing correlation or comparison of two variables and variables by using two groups began to be replaced with a more complex analysis. One of them is involving the control variables.
According to Widhiarso, The more variables are controlled, the research we are doing more qualified. Of course, not all variables can be included in the control variables. Terms of the control variables are variables other than the independent variable (X) that influence the dependent variable (Y). The control variables considered in this study were used:
a. The growth in its sales
It can be formulated as follows (Garcia-Teruel, Pedro J, and Martinez-Solano, Pedro. 2007):
SGROW = Sales1 Sales0 Sales0
b. Leverage
It can be formulated as follows (Gama, Maria A P P M. 2015):
DEBT = Total Debt Total Assets
3.4 Analysis Tools
3.4.1. Descriptive Analysis
relationship between two or more variables, and also shows the direction of the relationship between the dependent variable and independent variables (Ghozali, 2011). The equation formulated as follows:
ROA =α+β1AR +β2INV +β3CAR +β4CLR +β5SGROW +β6DEBT +ε Description:
Y= ROA = Return onAssets
X1= AR = The Number of Days Accounts Receivable
X2= INV = The Number of Days Inventories
X3= CAR = Current Assets Ratio
X4= CLR = Current Liabilities Ratio
X5= SGROW = The Sales Growth
X6= DEBT = Leverage
β1,β2,β3,β4,β5,β6, = Coefficient of Regression
α = Constanta
ε = Error
This study uses an Eviews software to do the multiple regression models for panel data, where there are three approaches on the panel data, that are:
1. Pooling Least Square
2. Fixed Effect Approach
On this approach, the panel data model has an intercept which may vary for each individual and the time is each cross-section unit is fixed in time series (Annida, 2009).
3. Random Effect Approach
On this approach, the difference between time and individuals are accommodated by error. Error in this approach is divided into error for the individual
components, an error for the time component and composite error. This study uses Generalize Least Square (GLS). Advantages of random effect model compared to fixed effect model is the degrees of freedom, are not necessary to estimate the intercept of N cross-sectional (Annida, 2009).
Tests were conducted to test which approach is used, are Chow Test and Hausman Test.
• Chow Test is a test that is performed to determine whether the model used is pooled least squares or fixed effect. This test uses F distribution statistics if the value of F-statistic is greater than the F table, means this study using a fixed effect approach (Annida, 2009).
Ho: Model is usingpooled least squareapproach H1: Model is usingfixed effectapproach
3.4.3. Classical Assumption Testing
Good regression linear model can be regarded as a good model if the model meets the assumptions called classical assumptions. If the value of classical assumptions is met, then the method of estimation will create a Linear Unbiased Estimator and have a minimum variance that is often called BLUE (Best Linear Unbiased Estimator) (Widarjono, 2009).
1. Normality Testing
Normality test is used to determine the normality of the error term and variable, for both independent and dependent variables, whether the data is normally spread. A good regression model is the normal distribution of data or nearly normal. This study uses Jarque-Bera to measure whether or not the data is normally distributed (Widarjono, 2013).
To detect whether the residual is normally distributed or not, that is by comparing
the value of JarqueBera with X2table, namely:
a. If the value JB> X2 table, then the residual distribution is not normal.
b. If the value JB <X2 table, then the residual normally distributed.
2. Multicollinearity Testing
At a regression model, we often see the close relationship between the
model found a correlation among the independent variables (independent). In a good regression model should not have happened a correlation among the independent variables (Ghozali, 2011). As a rule of thumb, if the correlation coefficient is high at over 0,85 then we assume there is multicollinearity in the model (Widarjono, 2013).
3. Heteroscedasticity Testing
Heteroscedasticity test aims to test whether in the regression model occurred inequality variance from one observation to another observation. If the residual variance of observation to another observation remains then, it is called
homoscedasticity, and if it is the difference it called heteroscedasticity. A good regression model that is homoscedasticity or not happen heteroscedasticity (Ghozali, 2011).
Heteroscedasticity testing in this study using the method of White. This method does not require assumptions about the normality of the disturbance variables. A White test based on the number of samples (n) multiplied by R2that will follow the distribution of chi-squares with the degree of freedom as the independent variable, which not included in the contents of regression auxiliary (Widarjono, 2013).
Criteria for decision-making in this test are:
4. Autocorrelation Testing
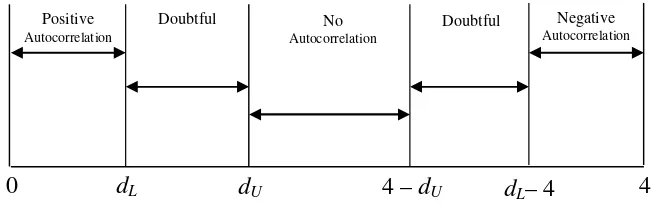
[image:63.595.150.477.364.469.2]Autocorrelation test aimed at test whether a linear regression model was no correlation between bullies error in period t with an error in period t - 1 (previous) (Ghozali, 2011). This study is using the Durbin-Watson test, to examine whether there is an autocorrelation or not. The Durbin-Watson test is comparing the DW value with the value in the table at the level of k (the number of independent variables), n (number of samples), and α (significance level) that exist.
Figure 2.Decision Areas of Durbin-Watson Statistical Test. Source: Widarjono (2013)
It can be seen in Figure 2 above, the decision whether or no autocorrelation that if the DW test> du and DW test <4 - du, we conclude that the proposed model does not occur autocorrelation at a certain significance level (Widarjono, 2013).
4
dL–4 4–dU
dU
dL 0
Negative
Autocorrelation
Positive
Autocorrelation
Doubtful No Doubtful
3.4.4. Hypothesis Testing
1. T-Statistical Testing
The t-statistical test basically shows how far the influence of the
explanatory/independent variables in explaining the variations of dependent variable individually (Ghozali, 2011).
Hypothesis criteria:
Ho; βi = 0, meaning no significant effectbetween independent variable on the dependent variable (profitability) individually.
Ha; βi ≠ 0 means there is significant influence between independent variableon the dependent variable (profitability) individually.
Testing criteria, if t count> t table, Ho is rejected, and Ha accepted this means that there is a relationship between independent variables and the dependent variable (profitability).
In the output regression, the partial test can also be done by looking at the value of probability. When theprobability value (0,000) <α (0.05) then the hypothesis is accepted.
2. F-Statistical Testing
Ha; βi ≠ 0 means there is a significant relationship between theindependent variables on the dependent variable (profitability) simultaneously.
Testing criteria, if the value of F count > F table, Ho is rejected, and Ha accepted this means that there is a relationship between independent variables and the dependent variable (profitability).
V. CONCLUSION AND SUGGESTION
5.1 Conclusion
Based on the results of regression and analysis of data on the effects of working capital management on profitability in small manufacturing companies listed on Indonesia Stock Exchange covering period 2012–2015, it can be concluded that: 1. Working capital management is significantly affect the profitability of small
manufacturing companies listed on Indonesia Stock Exchange covering periods 2012–2015.
2. Regarding the control variables all of them statistically do not have significant effect to profitability.
3. Others variable that current asset ratio and current liabilities ratio based on the results of regression shows that both of them do not have a significant
influence on the profitability of the company.
4. Based on the regression in appendix 8, the variable related to the management working capital has the most dominant influence on the return on asset from the independent variable is the number of days account receivable.
that working capital management is having the particular importance role to the small companies.
5.2 Suggestion
Based on the results and conclusions that have been presented, some of the suggestions put forward, that are:
1. The next research can use the medium companies or large companies based on capitalisations of the company.
2. On the top of that, The Stock Exchange of Thailand (SET) is planning to set up a new exchange for listing startups in 2017. Thus can be one oprtion to make the future research in startup model.
3. Future studies should use the working capital management that adding put the number of days account payable and cash conversion cycle as the dependent variable. Because this study only uses two working capitals management variables, making it possible to find the components of data variables. 4. Investors should consider the working capital and working capital
BIBLIOGRAPHY
Aminu, Yusuf, and Zainudin, Nasruddin. 2015. A Review of Anatomy of Working Capital Management Theories and The Relevant Linkages to Working Capital Components: A Theoretical Building Approach.European
Journal of Business and Management,Vol. 7,No. 2.
Banz, Rolf W. 1981. The Relationship between Return and Market Value of Common Stock.Journal of Financial Economics,pp. 3–18.
Bjorkman, Hampus and Hillergren Micael. 2014. The Effects of Working Capital Management on Firm Profitability.The Degree Project: Spring Semester. Umea School of Business and Economics.
Brag, Steven M. 2013.Business RatiosGuidebook. Second Edition. Accounting Tools.
Brigham, Eugene F. dan Joel F. Houston, 2010.Dasar-dasar Manajemen
Keuangan.Salemba Empat. Jakarta.
Bull, Peter M. 2013. Fundamentally Weighted Global Small Companies.The
Journal of Portfolio Management,Vol. 39 No. 4: pp. 132–141.
Davidson III, W. N. and D. Dutia. 1991, Debt, Liquidity and Profitability Problems in Small Firm,Entrepreneurship Theory and Practice(Fall), pp. 53–64.
Djarwanto. 2001.Pokok–pokok Analisa Laporan Keuangan. Edisi Pertama, BPFE, Yogyakarta.
Deloof, M. 2003. Does Working Capital Management affect profitability of Belgian Firms?.Journal of Business, Finance, and Accounting,Vol. 30, pp. 573–87.
Dong. H and Su. J. 2010. The Relationship between Working Capital
Management and Profitability.International Research Journal of Finance
and Economics.Vol. 49, pp. 62–71.
Small Businesses: Evidence from Taiwan Small Enterprises, Small Business Economics Journal. 18: 257-267.
Garcia-Teruel, Pedro J, and Martinez-Solano, Pedro. 2007. Effects of working capital management on SME profitability.International Journal of
Managerial Finance,Vol. 3 Iss 2 pp. 164–177.
Gama, Maria A P P M. 2015. Working capital management and SMEs profitability: Portuguese evidence.International Journal of Managerial
Finance,Vol. 11 Iss 3 pp. 341–358.
Ghozali, Imam. 2011.Aplikasi Analisis Multivariate Dengan Program IBM SPSS 19. Semarang : Badan Penerbit Universitas Diponegoro.
Gujarati. 2004.Basic Econometrics Fourth Edition. McGraw-Hill Company: United States.
Haryanto and Yunita, Ira. 2008. Analisis Likuiditas, Leverage, Ukuran Perusahaan dan Profitabilitas Terhadap Pengungkapan Sukarela Laporan Keuangan (Studi Empiris Pada Perusahaan Real Estat).Jurnal Wahana
Akuntansi, Vol. 3, Hal 19-39. Jakarta.
Hill, Aaron. http://study.com/academy/lesson/what-is-a-manufacturing-business-definition-examples.htmlaccessed onAugust 29th, 2016.
Jogiyanto, H.M. 2003.Teori Portofolio dan Analisis Investasi. Edisi Ketiga. BPFE. Yogyakarta.
Kargar, J. and Blunienthal, R. A. 1994. Leverage Impact of Working Capital in Small Business, TMA Journal, Vol.14, No6, pp. 46–53.
Mansouri, Ebrahim. 2012.The Effect of Working Capital Management on Firm’s Profitability: Evidence from Singapore.Interdisciplinary Journal of
Contemporary Research in Business.Vol. 4, No. 5.
Munawir S, 2004.Analisa Laporan Keuangan, Edisi Ke-empat, Liberty Yogyakarta. Yogyakarta.
Riyanto, Bambang. 2001.Dasar–dasar Pembelanjaan Perusahaan,
EdisiKe-empat, BPFE, Yogyakarta.
Ruwindas, Dikti K. 2011. Pengaruh Modal Kerja terhadap Profitabilitas Perusahaan.Journal of Economics.
Safrida, Eli. 2008. Pengaruh Struktur Modal dan Pertumbuhan Perusahaan Terhadap Nilai Perusahaan.Thesis. University of Sumatera Utara. Samiloglu, F and Demirgues, K. 2008. The Effect of Working Capital
Management on Firm Profitability: Evidence from Turkey.The International
Journal of Applied Economics and Finance.Vol. 2, No. 1, pp. 44–50.
Sawir, Agnes. 2005.Analisis Kinerja Keuangan dan Perencanaan Keuangan
Perusahaan,Gramedia Pustaka Utama, Jakarta.
Smith, K. V. 1973. State of the art or Working Capital Management.Financial
Management,Autumn, pp. 50–55.
Susan V. Crosson; Belverd E., Jr Needles; Needles, Belverd E.; Powers, Marian (2008).Principles of accounting. Boston: Houghton Mifflin. p. 209.
Weston, J. Fred and E. Copeland. 1997.Managerial Finance atau Manajemen
Keuangan.Jilid 2. Binarupa Aksara. Jakarta
Weston, J. Fred and Eugene F. Brigham. 1994.Dasar-dasar Manajemen
Keuangan,Edisi 9. Erlangga.
Widarjono, Agus. 2013.Ekonometrika pengantar dan aplikasinya edisi keempat. UPP STIM YKPN. Yogyakarta.
Widhiarso, Wahyu. 2011.Analisis Data Penelitian dengan Variabel Kontrol.
Fakultas Psikologi, Universitas Gadjah Mada.
Wijaya, Anggita L. 2012. Pengaruh Komponen Working Capital Terhadap
Profitabilitas Perusahaan.Jurnal Dinamika Akuntasnsi.Vol. 4, No. 1, pp. 20-26.
Yunus, Hadori. 2005. Pengaruh Modal Kerja Terhadap Profitabilitas Pada Perusahaan Sektor Industri Makanan dan Minuman yang Terdaftar di Bursa Efek Indonesia.Jurnal Keuangan. Vol.01. Jakarta.
Zariyawati, MA. 2009. Working Capital Management and Corporate