239
Physical Fitness and
Academic Achievement in
Third- and Fifth-Grade Students
Darla M. Castelli, Charles H. Hillman, Sarah M. Buck, and Heather E. Erwin
University of Illinois at Urbana-Champaign
The relationship between physical fitness and academic achievement has received much attention owing to the increasing prevalence of children who are overweight and unfit, as well as the inescapable pressure on schools to produce students who meet academic standards. This study examined 259 public school students in third and fifth grades and found that field tests of physical fitness were positively related to academic achievement. Specifically, aerobic capacity was positively associated with achievement, whereas BMI was inversely related. Associations were demonstrated in total academic achievement, mathematics achievement, and reading achievement, thus suggesting that aspects of physical fitness may be globally related to academic performance in preadolescents. The findings are discussed with regards to maximizing school performance and the implications for educational policies.
Key Words: cognition, preadolescent, exercise, standardized testing
Physical inactivity among youth and its relation to heightened incidences of dis-ease, such as childhood obesity and type 2 diabetes mellitus, has become a national health concern (U.S. Department of Health and Human Services [USDHHS], 2000). Nearly half of young people, ages 12–21, are not vigorously active on a regular basis (USDHHS, 2000), yet physical activity poses a wealth of benefits to those who participate regularly (e.g., in the areas of adiposity, mental health, musculoskeletal health; Strong et al., 2005). In general, the training effects associated with increased physical activity in children are considered small but positive (Payne & Morrow, 1993), with the benefits outweighing the potential risks. Of greater importance might be the indirect relationship of childhood activity behaviors tracking into adulthood (Janz, Dawson, & Mahoney, 2000), potentially limiting the prevalence of risk factors related to cardiovascular disease in later life. Despite consensus of the positive effects related to physical activity and fitness (Strong et al., 2005), the benefits to cognitive health and the educational experience remain unclear.
The authors are with the Department of Kinesiology and Community Health, University of Illinois, Urbana, IL.
Educational and health professionals have intuitively believed that individu-als who are physically active and fit perform better in school. Several studies have documented a positive relationship between physical fitness and academic achieve-ment or other cognitive performance measures (California Departachieve-ment of Education [CDE], 2001; Maynard, Coonan, Worsley, Dwyer, & Baghurst, 1987; Shephard et al., 1984; Shephard, LaVallee, Volle, LaBarre, & Beaucage, 1994), whereas other studies have observed small (Daley, & Ryan, 2000; Dwyer, Coonan, Leitch, Hetzel, & Baghurst, 1983) or negative relationships (Tremblay, Inman, & Williams, 2000). Additionally, physical activity has been positively associated with cognition (Sibley & Etnier, 2003; Coe, Pivarnik, Womack, Reeves, & Malina, 2006; Shephard, 1997; Tomporowski, 2003). Beyond the educational setting, measures of standardized testing or grades are representative of cognitive functioning, which has also been associated with physical fitness (Etnier et al., 1997; Hillman, Castelli, & Buck, 2005). Despite these positive associations, not all research has supported this con-clusion (Tremblay et al., 2000), thus warranting further examination.
A research study conducted by the CDE (2001) attempted to identify the relationship between physical fitness and academic achievement. In this study, reading and mathematics scores from the Stanford Achievement Test were indi-vidually matched with the fitness scores (Fitnessgram; Cooper Institute for Aerobic Research, 1999) of 353,000 fifth graders, 322,000 seventh graders, and 279,000 ninth graders. A positive relationship was observed between physical fitness and the Stanford Achievement Test across all three grade levels, such that higher levels of fitness were associated with higher academic achievement. Similar research conducted in a school setting by Coe et al. (2006) extended the findings of CDE (2001) because they observed a positive relationship between vigorous physical activity and higher grades in school.
Fitness and Academic Achievement 241
(Sallis et al., 1999). Although there were positive trends in the relationship, the intervention groups did not score significantly higher on academic standardized testing as a result of increased physical activity engagement. However, findings from this study have limited application as it was conducted in an already high-achieving, affluent school district.
Despite these initial efforts, future research is necessary to better determine the role that physical fitness has on academic performance. Most importantly, the potential influence of sociocultural variables, and poverty in particular, should be examined due to the relationship between these variables and both fitness and cog-nitive performance (Duncan, Duncan, Strycker, & Chaumeton, 2002; Mezzacappa, 2004). Additional research is needed to account for possible effects related to the administration of the Fitnessgram (and other field-based measures of fitness) and to ensure that students are properly familiarized with these tests, in order to improve the validity of the collected fitness data. Further, analyses in previous studies did not discriminate between muscular and aerobic fitness. As such, the data only provide for a general understanding of the relationship between physical fitness and academic achievement. A more refined approach, which examines the relative contribution of the different components of fitness (e.g., aerobic, muscular, and body composition) is of interest to better understand the potential influence of the various aspects of fitness on cognitive performance.
Other cognitive research has recently linked aerobic fitness to improvements in neuroelectric and behavioral performance of children during a stimulus discrimi-nation task (Hillman et al., 2005). The findings suggested that higher fit children exhibited greater allocation of attentional resources to working memory, supporting previous research examining fitness and cognition in adult populations (see Kramer & Hillman, 2006 for review). Further, Sibley and Etnier (2003) conducted a meta-analysis, which confirmed that a small but significant relationship between physical activity and cognitive performance existed in school-aged children. Their findings revealed that physical activity may be beneficial to cognitive health in children, with the largest effects found for IQ and academic achievement.
The present context of schools and public health issues make examination of this relationship timely, as federal mandates (e.g., No Child Left Behind) have increased pressure on administrators and teachers to produce students who achieve basic levels of competency in reading, mathematics, and science, through the pro-motion of equal opportunity for all economical levels. Standardized achievement tests are an inescapable fact of life in U.S. public education. Despite initiatives such as SPARK, the foci of the school curricula and after-school programs are on achievement in academics, rather than on public health issues, indicating low prioritization of health problems facing America’s youth.
achievement. Further, based on previous research with children (Hillman et al. 2005; CDE, 2001), fitness would be globally related to academic achievement.
METHODS
Context
The Illinois School Report Card is a public document of school effectiveness as it relates to academic achievement in the context of the instructional setting. School report cards are published by district and school and contain information regarding school demographics, income rate, dropout rate, attendance, enrollment, school finances, and student achievement of the standards in reading and math. The report format allows for easy comparison of school effectiveness by school, district, and state while considering racial/ethnic background and the amount of economically disadvantaged children. This study was conducted in a single school district in a medium-sized urban community. Of the 11 public elementary schools, four were selected for participation specifically because of school performance (academic performance in relation to the number of student receiving free/reduced lunch; academic performance by ethnicity and race), poverty index, and neighborhood crime rate in an attempt to obtain a balanced socioeconomic and academically performing sample.
From the school district report cards, four schools were selected. Two schools were considered academically effective as 76.3% of the students met or exceeded the standard in mathematics and 86.4% in reading. Alternatively, the other two schools had only 46.2% of the student body meet or exceeded the standard in mathematics and 40.4% in reading. Illinois Department of Education and other public documents were used to determine the average socioeconomic status of the entire student body for recruitment purposes. For two of the schools, 24.3% of the student body received free/reduced lunches/breakfast, whereas 66% of the student body received free/reduced meals at the other two schools. Despite differ-ences along these sociocultural variables, schools in the same district were utilized to ensure that each participant was receiving similar amounts of physical activity within the school day (e.g., recess, physical education taught by specialists as opposed to classroom teachers).
Participants
Parental informed consent was obtained from 68% of the third- and fifth-grade students (n = 582) enrolled across the four schools. Any student with an individual education plan as a result of disability was excluded from the study. Also, any student who did not complete all of the annual ISAT testing, moved out of district, or did not complete all of the Fitnessgram tests was excluded from the study. Thus, the study sample comprised 259 participants (M
age = 9.5, SD = .74, male = 132),
Fitness and Academic Achievement 243
130% to 185% above the poverty line. Forty-four percent did not participate in the free/reduced lunch program, and data could not be obtained for 14 participants.
Measures
Fitness Testing. The Fitnessgram was developed as a way to increase parental awareness of physical fitness assessments in children (Cooper Institute for Aerobics Research, 1999). Endorsed by the American College of Sports Medicine (ACSM, 2006), the Fitnessgram is a valid and reliable (Welk, Morrow, & Falls, 2002) bat-tery of assessments used to identify muscle fitness, aerobic capacity, and body composition. The fitness tests were completed during regularly scheduled physical education classes and administered by the researchers to ensure consistency in test administration. During the initial class, the participants were familiarized with each test through demonstration and were allowed to practice the testing protocols under conditions similar to testing. During the second class, the participants completed the Progressive Aerobic Cardiovascular Endurance Run (PACER) to assess aerobic capacity. The PACER is a 20-m shuttle run that progressively increases in difficulty. During the third class, the muscle fitness tests (push-ups and curl-ups to a specific cadence), and the back-saver sit and reach test (which measures hip flexor and hamstring flexibility) were completed. Body composition was also obtained through height and weight measures and converted to body mass index (BMI) for scoring. The tests were scored through the use of Fitnessgram software, which identified whether the scores fell within the “Healthy Fitness Zone,” based on criteria estab-lished by the Fitnessgram Scientific Advisory Committee. Participants received objective feedback and positive reinforcements through a computer-generated printout of their testing results.
Academic Achievement Testing. Participants completed the ISAT, which is administrated annually to third- through eighth-grade students in Illinois public schools. These tests serve as public notification of student performance, they monitor individual student progress, and they are used for identification of school effectiveness. The ISAT tests were deemed valid and reliable through analysis of past ISAT tests and comparison to test questions from the Prairie State Achievement Examination (PSAE) and Illinois Measure of Annual Growth in English (IMAGE). The third- and fifth-grade participants completed a battery of tests across a 5-day period, in 40-min intervals. Questions included both multiple choice and extended response items in mathematics and reading. Specifically, for mathematics, some questions required computations, whereas others required problem-solving strate-gies without computations. The reading questions measured comprehension based on the content of a passage. Vocabulary questions required identification of word meaning and its association with other words. Each academic test was scored on a 200-point scale; therefore, analysis of composite ISAT scores for individual participants was based upon a 400-point scale.
Results
high-performing/low poverty schools and low-performing/high poverty schools. Pearson product-moment correlation analyses were initially conducted on the three dependent variables (total academic achievement, mathematics achievement, reading achievement), individual Fitnessgram scores (PACER, push-ups, curl-ups, mean back-saver sit and reach, BMI) and a composite measure of total fitness (i.e., subtraction of BMI within each age group from the aggregated z score of the other four Fitnessgram subtests (PACER, push-ups, curl-ups, mean back-saver sit and reach), age, sex (coded as 0 = females, 1 = males), school (coded as 0 = low per-forming, 1 = high performing), and poverty index (coded as 0 = low poverty index, 1 = high poverty index; see Table 2). The other variables (age, sex, school, and poverty index) were included to identify covariates for inclusion in the regression analyses. Only the variables that correlated with either academic achievement or fitness were included in subsequent regression analyses. Results of the correlation analyses indicated that three subscales of the Fitnessgram (PACER, push-ups, curl-ups) and total fitness were positively correlated with all three achievement test measures (p < .01). Mean scores for the back-saver sit and reach were positively correlated with total academic achievement and math achievement (p < .05) but were unrelated to reading achievement (p = .09). School was positively correlated with total academic achievement and reading achievement (p < .02), and negatively correlated with push-ups (p = .03). Body mass index was negatively correlated with the three achievement test measures (p < .001). In addition, age was positively cor-related with back-saver sit and reach (p = .005), and sex was positively correlated with PACER and push-ups, and negatively correlated with back-saver sit and reach (p < .02). Finally, poverty index was unrelated with all other measures (p > .07).
A series of analyses were performed that regressed the three academic achieve-ment measures (total achieveachieve-ment, reading, mathematics) on the total fitness com-posite score. In the case of total achievement and reading achievement, a positive correlation was observed with school, warranting inclusion of this variable in the model. As such, two-step hierarchical regressions were performed that included school in the first step and the total fitness composite score in the second step. In both analyses (i.e., total achievement, reading achievement), the first step exhibited a significant relationship, adjusted R2≥ .018, F(2, 257) ≥ 5.8, p < .02, indicating
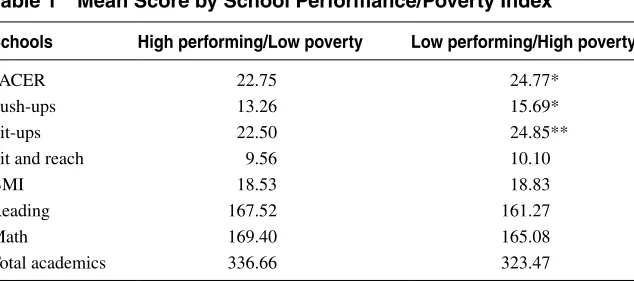
that higher performing schools were associated with higher academic achievement Table 1 Mean Score by School Performance/Poverty Index
Schools High performing/Low poverty Low performing/High poverty
PACER 22.75 24.77*
Push-ups 13.26 15.69*
Sit-ups 22.50 24.85**
Sit and reach 9.56 10.10
BMI 18.53 18.83
Reading 167.52 161.27
Math 169.40 165.08
Total academics 336.66 323.47
Fitness and
Academic
Achie
v
ement
245
Table 2 Intercorrelations Between Variables for All Participants
Variable 1 2 3 4 5 6 7 8 9 10 11 12 13
1. Total achievement — 2. Mathematics achievement .90** — 3. Reading achievement .92** .86** —
4. Age (years) −.04 −.04 .04 —
5. Sex .03 .07 .03 .06 —
6. Poverty index .05 .003 .04 .11 .08 —
7. School .15* .10 .15* .16* −.07 .18** —
8. Total fitness (z score) .42** .45** .41** .000 .10 −.02 −.10 —
9. PACER .48** .49** .45** .04 .19** .07 −.07 .65** —
10. BMI −.28** −.27** −.28** .09 −.04 .04 −.04 −.53** −.23** —
11. Curl-ups .22** .24** .24** .12 .11 −.12 −.09 .67** .34** −.23** —
12. Push-ups .18** .19** .17** .03 .15* .04 −.13* .62** .30** −.02 .36** —
13. Sit and Reach .13* .19** .11 −.17** −.17** −.02 −.11 .52** .15* −.14* .12* .17** —
scores, pr≥ .15, t(257) ≥ 2.4, p < .02, β≥ .15. The second step also exhibited a significant effect for total fitness, ∆R2≤ .18, F(1, 256) ≤ 59.4, p≤ .001, indicating
that higher academic achievement scores were associated with greater total fitness, pr≥ .43, t(256) ≥ 7.7, p < .001, β≥ .43. In the case of mathematics achievement, no other variable was found to correlate; thus, this analysis included only the total fitness composite score. Results exhibited a significant relationship, adjusted R2 =
.20, F(1, 257) = 64.0, p < .001, indicating that total fitness was positively related to mathematics achievement, pr = .45, t(257) = 8.0, p < .001, β = .45.
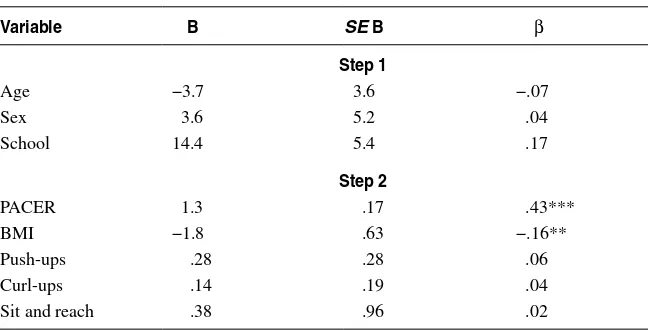
Next, a series of two-step hierarchical regressions were performed to determine the relationship between the various Fitnessgram subtests and the three measures of academic achievement (total achievement, reading, mathematics). In the first step, the dependent variables were regressed on variables that correlated with either academic achievement or fitness (i.e., age, sex, school). In the second step, the Fitnessgram subtests were entered into the regression analysis. With regards to total academic achievement, results from the Step 1 analysis did not reveal a significant relation-ship, adjusted R2 < .02, F(3, 255) = 2.5, p = .06, indicating that age, sex, and school
were unrelated to total academic achievement. The Step 2 regression analysis was significant, ∆R2 = .28, F(5, 250) = 19.9, p < .001. There was a significant effect for
BMI, pr = −.17, t(250) = 2.8, p < .01, β = −.16, and for PACER, pr = .42, t(250) = 7.3, p < .001, β = .43, indicating that greater total academic achievement scores were associated with lower BMI and higher aerobic fitness (see Table 3).
The Step 1 regression analysis for reading achievement was not significant, adjusted R2 < .02, F(3, 255) = 2.5, p = .07, demonstrating that age, sex, and school
were unrelated to performance in reading achievement. The Step 2 regression analy-sis was significant, ∆R2 = .25, F(5, 250) = 17.5, p < .001. There were significant
effects for BMI, pr = −.17, t(250) = 2.6, p < .01, β = −.15, and for PACER, pr = .38, t(250) = 6.6, p < .001, β = .40, indicating that lower BMI and higher aerobic fitness were positively related to reading achievement (see Table 4).
Table 3 Summary of Hierarchical Regression Analysis for Variables Predicting General Academic Achievement
Variable B SE B β
Step 1
Age −3.7 3.6 −.07
Sex 3.6 5.2 .04
School 14.4 5.4 .17
Step 2
PACER 1.3 .17 .43***
BMI −1.8 .63 −.16**
Push-ups .28 .28 .06
Curl-ups .14 .19 .04
Sit and reach .38 .96 .02
Fitness and Academic Achievement 247
Table 4 Summary of Hierarchical Regression Analysis for Variables Predicting Reading Achievement
Variable B SE B β
Step 1
Age −1.9 1.7 −.07
Sex 1.7 2.6 .04
School 6.8 2.6 .16
Step 2
PACER .56 .09 .40***
BMI −.83 .31 −.15**
Push-ups .12 .14 .05
Curl-ups .13 .10 .08
Sit and reach .02 .47 .002
*p < .05, **p < .01, ***p < .001.
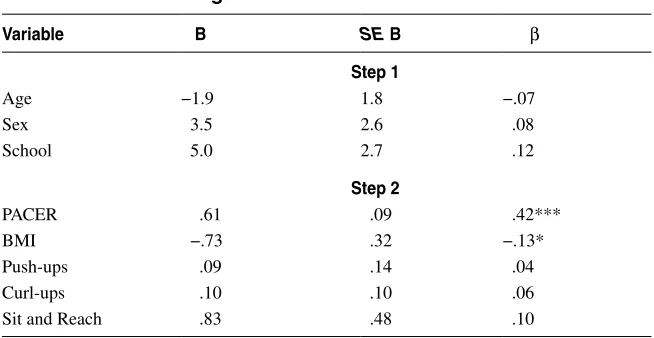
The Step 1 regression analysis for mathematics achievement was not signifi-cant, adjusted R2 < .01, F(3, 255) = 1.8, p = .15, indicating that age, sex, and school
were unrelated to performance in mathematics achievement. The Step 2 regression analysis was significant, ∆R2 = .28, F(5, 250) = 19.9, p < .001. There were significant
effects for BMI, pr = −.15, t(250) = 2.3, p = .02, β = −.13, and for PACER, pr = .41, t (250) = 7.1, p < .001, β = .42, indicating that lower BMI and higher aerobic fitness were positively related to mathematics achievement (see Table 5).
Table 5 Summary of Hierarchical Regression Analysis for Variables Predicting Mathematics Achievement
Variable B SE B β
Step 1
Age −1.9 1.8 −.07
Sex 3.5 2.6 .08
School 5.0 2.7 .12
Step 2
PACER .61 .09 .42***
BMI −.73 .32 −.13*
Push-ups .09 .14 .04
Curl-ups .10 .10 .06
Sit and Reach .83 .48 .10
DISCUSSION
The key finding of this study is that physical fitness was related to academic perfor-mance in third- and fifth-grade children, providing general support for the notion that children who are physically fit are more likely to perform better on standardized academic achievement tests, thus corroborating the CDE (2001) study. When this general relationship was decomposed by subject matter and type of fitness, find-ings identified that performance on reading and mathematics were both related to aerobic fitness and BMI. The current study contributes to the physical fitness and cognition knowledge base by presenting new evidence that specific components of physical fitness are globally associated with academic performance during matura-tion, independent of other possible factors, as well as through extended application to younger school-aged children.
The data collected herein extend the large-scale research (Sallis et al., 1999) by accounting for the influence of sociocultural variables such as age, sex, school char-acteristics (i.e., school effectiveness), and poverty index. Children who displayed higher levels of physical fitness were more likely to have higher standardized test scores in reading and mathematics, regardless of these other variables. Specifically, aerobic fitness was positively associated, and BMI was negatively associated, with total academic achievement, reading achievement, and mathematics achievement, whereas muscle strength and flexibility fitness were observed to be unrelated to achievement test performance in this data set.
Academic Achievement and Fitness
Findings from this study suggest that physical health is related to academic perfor-mance in addition to national health goals and, as such, warrant consideration in educational and public policy making. Accordingly, opportunities for children to be physically active and become physically fit should be provided by the school, especially at the elementary level. Physical education, among other physical activity opportunities surrounding a school day (i.e., active recess, both before- and after-school programs), is positioned to play an important role in addressing public health issues, yet what curricular components have the greatest impact needs to become more clearly defined. However, the pressure for academic performance, such as that provided by the federal mandate of No Child Left Behind, forces teachers and administrators to make difficult decisions about how time in school should be allocated. The identification of the effects of physical fitness, and its components, on cognitive performance could aid administrators in the decision-making process. Findings from this study also warrant comprehensive examination of physical education programs from the micro (i.e., lesson content, frequency, quality) and macro (i.e., national, state, district policies) levels (McKenzie & Kahan, 2004), thus enhancing the benefits associated with aerobic fitness and healthy BMI, in relation to academic achievement.
Fitness and Academic Achievement 249
status. Cross-sectional studies of the relationship between academic achievement and physical fitness as well as academic achievement and physical activity have had mixed results ranging from small, but positive effects (CDE, 2001; Dwyer et al., 1983; Sallis et al., 1999) to trivial, negative relationships (Tremblay et al., 2000). Most of these data were generated from physical activity interventions, which focused on changing the child’s physical environment (e.g., home or school) to increase physical activity participation. Because most children attend public schools, it is believed that educational institutions may be the most plausible means of increasing the physical activity participation of children. Schools and teachers are presently being asked to address not only academic achievement, but also public heath issues such as childhood obesity. Despite public concern for health issues among youth, physical activity opportunities are currently being reduced (Pellegrini & Bohn, 2005) and childhood obesity rates are on the rise (McKenzie & Kahan, 2004; Pellegrini & Bohn, 2005; USDHHS, 2000).
Possible Mechanisms. The complexity of the physical activity and fitness relationship, in and of itself, makes it difficult to specifically identify possible mechanisms. In general, physical activity has the potential to improve physical fitness, particularly when chronic behavior targets increased fitness. Etnier et al. (1997) conducted a meta-analysis of the relationship between physical activity and cognition, and concluded that potential changes in cognition (e.g., academic achievement) may stem from (a) physiological mechanisms that are independent of aerobic fitness, (b) physiological mechanisms dependent upon attainment of aerobic fitness, or (c) psychological mechanisms that are independent of aerobic fitness.
Greater aerobic fitness has been associated with changes in neurocognitive function (Hillman et al., 2005), as higher fit children exhibited a more effective neuroelectric profile than lower fit children on a stimulus discrimination task. The higher fit children also performed better along behavioral measures of reaction time and response accuracy, perhaps stemming from greater allocation of attentional resources to working memory, which supports similar research on fitness and cognition in adult populations (Kramer & Hillman, 2006). Others mechanisms by which fitness may relate to benefits in brain and cognition have also been posited, including changes in the structure and function of brain tissue in elderly adults (Kramer & Hillman, 2006).
Shephard (1997) identified several alternative explanations for the positive relationships between physical fitness and academic performance: (a) teacher attitudes, (b) student attitudes, (c) learning disabilities, and (d) public policy. To address the alternative explanation related to teacher attitudes, teachers from the same school district who enact the same curriculum were utilized. Additionally, researchers, not teachers, administered the Fitnessgram to the children, providing for increased control and consistency of fitness test administration, which differed from previous school-based research (cf. CDE, 2001). Issues related to public policy were addressed through recruitment of the specific school district, as the same number of physical education opportunities were offered by each school. Rather, this school district had obtained a state waiver allowing for fewer physical education opportunities (e.g., fewer days per week) than required by public policy.
education services were excluded from study analyses. Although it is understood that schools are inclusive, these children were excluded to account for potential cognitive deficits and the misunderstanding of testing protocols. Thus, these data may not extend to this population. Unfortunately, this study was unable to control for Shephard’s (1997) concern regarding student attitudes, which may be related to both physical fitness and academic performance. Specifically, no measure of student’s motivation for either the cognitive or physical fitness tests was collected. Therefore, student motivation remains a potential alternate explanation for these findings. Students who perform better in school and enjoy their schooling experience may be more likely to exert more effort on physical fitness and academic tests. This concern remains a viable explanation that should be accounted for in future attempts at understanding the relationship between fitness and academic performance.
Limitations
Despite the contribution regarding the relationship of physical fitness to academic achievement, several limitations of the study warrant mention. First, as discussed, student motivation may account for a portion of the variance explained in the rela-tionship between physical fitness and academic performance. Second, the utilization of field-test measures of physical fitness, although administered by researchers, have a restricted evaluation of fitness in children. Other laboratory procedures, such as maximum oxygen consumption (e.g., VO2max), are more valid and reliable measures of aerobic fitness. However, a field test was chosen to examine the relationship between fitness and cognition in an externally valid setting, and allowed for a greater understanding of the relationship between the various components of fitness, rather than only aerobic fitness. Finally, the sample was not random, and therefore the findings from this study may not be generalizable to other populations.
Summary
In conclusion, this study confirms that physical fitness is generally associated with academic performance in elementary school children. Aerobic fitness and BMI were associated with achievement in reading and mathematics, whereas strength and flexibility fitness were unrelated to general academic achievement, reading, and mathematics. Continued research is needed to gain a more causal understand-ing of the relationship between physical fitness and cognition in children. Future research should address which parameters of physical fitness and activities obtain the greatest cognitive benefits, examine the effects of physical activity and fitness by cohorts, and investigate which moderators have the greatest impact on student cognition.
Acknowledgments
This research was supported by a University of Illinois Research Board grant to D. Castelli and C. Hillman.
References
Fitness and Academic Achievement 251
California Department of Education (CDE). (2001). California physical fitness test: Report to the governor and legislature. Sacramento, CA: California Department of Education Standards and Assessment Division.
Coe, D.P., Pivarnik, J.M., Womack, C.J., Reeves, M.J., & Malina, R.M. (2006). Effect of physical education and activity levels on academic achievement in children. Medicine and Science in Sports and Exercise, 38, 1515-1519.
Cooper Institute for Aerobics Research. (1999). Fitnessgram: Test administration manual. Champaign, IL: Human Kinetics.
Daley, A.J., & Ryan, J. (2000). Academic performance and participation in physical activity by secondary adolescents. Perceptual Motor Skills, 91, 531-534.
Duncan, S.C., Duncan, T.E., Strycker, L.A., & Chaumeton, N.R. (2002). Neighborhood physical activity opportunity: A multilevel contextual model. Research Quarterly for Exercise and Sport, 73, 457–463.
Dwyer, T., Coonan, W.E., Leitch, D.R., Hetzel, B.S., & Baghurst, P.A. (1983). An investiga-tion of the effects of daily physical activity on the health of primary school students in South Australia. International Journal of Epidemiology, 12, 308-312.
Etnier, J.L., Salazar, W., Landers, D.M., Petruzzello, S.J., Han, M., & Nowell, P. (1997). The influence of physical fitness and exercise upon cognitive functioning: A meta-analysis. Journal of Sport and Exercise Psychology, 19, 249-277.
Hillman, C.H., Castelli, D.M., & Buck, S.M. (2005). Aerobic fitness and cognitive function in healthy preadolescent children. Medicine and Science in Sports and Exercise, 37, 1967-1974.
Janz, K.F., Dawson, J.D., & Mahoney, L.T. (2000). Tracking physical fitness and physical activity from childhood to adolescence: The Muscatine study. Medicine and Science in Sports and Exercise, 32, 1250-1257.
Kramer, A.F., & Hillman, C.H. (2006). Aging, physical activity, and neurocognitive function. In E. Acevado & P. Ekkekakis (Eds.). Psychobiology of exercise and sport (pp. 45-59). Champaign, IL: Human Kinetics.
Maynard, E.J., Coonan, W.E., Worsley, A., Dwyer, T., & Baghurst, P.A. (1987). The develop-ment of the lifestyle education program in Australia. In B.S. Hetzel & G.S. Berenson (Eds.), Cardiovascular risk factors in children: Epidemiology and prevention (pp. 123-149). Amsterdam: Elsevier.
Mezzacappa, E. (2004). Alerting, orienting, and executive attention: Developmental proper-ties and sociodemographic correlates in an epidemiological sample of young, urban children. Child Development, 75, 1373-1386.
McKenzie, T.L., & Kahan, D. (2004). Impact of the Surgeon General’s report: Through the eyes of physical education teacher educators. Journal of Teaching in Physical Educa-tion, 23, 300-317.
McKenzie, T.L., Sallis, J.F., Faucette, N., Roby, J.J., & Kolody, B. (1993). Effects of a curriculum and inservice program on the quantity and quality of elementary physical education classes. Research Quarterly for Exercise and Sport, 64, 178-188.
McKenzie, T. L., Sallis, J.F., Kolody, B., & Faucette, F. N. (1997). “Long-term effects of a physical education curriculum and staff development program: SPARK.” Research Quarterly for Exercise and Sport, 68, 280-292.
Payne, V.G., & Morrow, J.R. (1993). Exercise and VO2max in children: A meta-analysis. Research Quarterly for Exercise and Sport, 64, 305-309.
Pellegrini, A.D., & Bohn, C.M. (2005). The role of recess in children’s cognitive performance and school adjustment. Educational Researcher, 34, 13-19.
Sallis, J.F., McKenzie, T.L., Kolody, B., Lewis, M., Marshall, S., & Rosengard, P. (1999). Effects of health-related physical education on academic achievement: Project SPARK. Research Quarterly for Exercise and Sport, 70, 127-138.
Shephard, R.J., LaVallee, H., Voile, M., LaBarre, R., & Beaucage. (1994). Academic skills and required physical education: The Trios Rivieres experience. CAHPER Research Supplement, 1, 1-12.
Shephard, R.J. (1997). Curricular physical activity and academic performance. Pediatric Exercise Science, 9, 113-126.
Sibley, B.A., & Etnier, J.L. (2003). The relationship between physical activity and cognition in children: A meta-analysis. Pediatric Exercise Science, 15, 243-256.
Strong, W.B., Malina, R.M., Blimkie, C.J., Daniels, S.R., Dishman, R.K., Gutin, B., et al. (2005). Evidence based physical activity for school-age youth. Journal of Pediatrics, 146, 732-737.
Tomporowski, P.D. (2003). Cognitive and behavioral responses to acute exercise in youths: A review. Pediatric Exercise Science, 15, 348-359.
Tremblay, M.S., Inman, J.W., & Williams, D. (2000). The relationship between physical activity, self-esteem, and academic achievement in 12-year-old children. Pediatric Exercise Science, 12, 312-323.
U.S. Department of Health and Human Services (USDHHS). (2000). Healthy people 2010: Understanding and improving health. Washington, DC: U.S. Government Printing Office, 22B, pp. 1-25.
Welk, G.J., Morrow, J.R., & Falls, H.B. (2002). Fitnessgram reference guide. Dallas, TX: The Cooper Institute.