ICACSIS 2014
International Conference on
Advanced Computer Science and Information System 2012
(ICACSIS 2014)
Hotel Ambhara, Jakarta
October 18th - 19th, 2014
Committees
| Table of Contents | Author's Index | About This CD-ROM
Search
View
Please enable
Javascript on your browser to view all the page properly.
Copyright
Personal use of this material is permitted. However, permission to reprint/republish this material for advertising or
promortional purposes or for creating new collective works for resale or redistribution to servers or lists, or to reuse any
copyrighted component of this work in other works must be obtained from Faculty of Computer Science, Universitas
Indonesia, Indonesia.
Contacts
ICACSIS Committee
Email: [email protected]
Phone: +62 21 786 3419 ext. 3225
Faculty of Computer Science, Universitas Indonesia
Kampus UI Depok
Indonesia - 16424
Phone: +62 21 786 3419
Fax: +62 21 786 3415
Email: [email protected]
ICACSIS 2014
International Conference on
Advanced Computer Science and Information System 2012
(ICACSIS 2014)
Hotel Ambhara, Jakarta
October 18th - 19th, 2014
Committees
| Table of Contents | Author's Index | About This CD-ROM
Search
Committee
Honorary Chairs
A
. Jain, Fellow IEEE, Michigan State University, US
T. Fukuda, Fellow IEEE, Nagoya-Meijo University, JP
M. Adriani, Universitas Indonesia, ID
General Chairs
E. K. Budiardjo, Universitas Indonesia, ID
D.I. Sensuse, Universitas Indonesia, ID
Z.A. Hasibuan, Universitas Indonesia, ID
Program Chairs
H.B. Santoso, Universitas Indonesia, ID
W. Jatmiko, Universitas Indonesia, ID
A. Buono, Institut Pertanian Bogor, ID
D.E. Herwindiati, Universitas Tarumanagara, ID
Section Chairs
K. Wastuwibowo, IEEE Indonesia Section, ID
Publication Chairs
A. Wibisono, Universitas Indonesia, ID
Program Committees
A. Azurat, Universitas Indonesia, ID
A. Fanar, Lembaga Ilmu Pengetahuan Indonesia, ID
A. Kistijantoro, Institut Teknologi Bandung, ID
A. Purwarianti, Institut Teknologi Bandung, ID
A. Nugroho, PTIK BPPT, ID
A. Srivihok, Kasetsart University, TH
A. Arifin, Institut Teknologi Sepuluh Nopember, ID
A.M. Arymurthy, Universitas Indonesia, ID
B. Hardian, Universitas Indonesia, ID
B. Purwandari, Universitas Indonesia, ID
B.A. Nazief, Universitas Indonesia, ID
B.H. Widjaja, Universitas Indonesia, ID
Denny, Universitas Indonesia, ID
D. Jana, Computer Society of India, IN
E. Gaura, Coventry University, UK
E. Seo, Sungkyunkwan University, KR
F. Gaol, IEEE Indonesia Section, ID
H. Manurung, Universitas Indonesia, ID
H. Suhartanto, Universitas Indonesia, ID
H. Sukoco, Institut Pertanian Bogor, ID
I. Budi, Universitas Indonesia, ID
I. Sitanggang, Institut Pertanian Bogor, ID
I. Wasito, Universitas Indonesia, ID
K. Sekiyama, Nagoya University, JP
L. Stefanus, Universitas Indonesia, ID
Marimin, Institut Pertanian Bogor, ID
M.T. Suarez, De La Salle University, PH
M. Fanany, Universitas Indonesia, ID
M. Kyas, Freie Universitat Berlin, DE
M. Nakajima, Nagoya University, JP
M. Widyanto, Universitas Indonesia, ID
M. Widjaja, PTIK BPPT, ID
N. Maulidevi, Institut Teknologi Bandung, ID
O. Sidek, Universiti Sains Malaysia, MY
O. Lawanto, Utah State University, US
P. Hitzler, Wright State University, US
P. Mursanto, Universitas Indonesia, ID
S. Bressan, National University of Singapore, SG
S. Kuswadi, Institut Teknologi Sepuluh Nopember, ID
S. Nomura, Nagaoka University of Technology, JP
S. Yazid, Universitas Indonesia, ID
T. Basaruddin, Universitas Indonesia, ID
T. Hardjono, Massachusetts Institute of Technology, US
T. Gunawan, Int. Islamic University Malaysia, MY
T.A. Masoem, Universitas Indonesia, ID
V. Allan, Utah State University, US
W. Chutimaskul, King Mokut’s Univ. of Technology, TH
W. Molnar, Public Research Center Henri Tudor, LU
W. Nugroho, Universitas Indonesia, ID
W. Prasetya, Universiteit Utrecht, NL
W. Sediono, Int. Islamic University Malaysia, MY
W. Susilo, University of Wollongong, AU
W. Wibowo, Universitas Indonesia, ID
X. Li, The University of Queensland, AU
Y. Isal, Universitas Indonesia, ID
ICACSIS 2014
International Conference on
Advanced Computer Science and Information System 2012
(ICACSIS 2014)
Hotel Ambhara, Jakarta
October 18th - 19th, 2014
Committees
|
Table of Contents
|
Author's Index
|
About This CD-ROM
View
: 1-25 | 26-50 | 51-75
Search
Evaluation on People Aspect in Knowledge Management System Implementation: A Case Study of Bank Indonesia
Putu Wuri Handayani
Page(s): 1-9
Abstract | Full Text:
Relative Density Estimation using Self-Organizing Maps
Denny
Page(s): 10-15
Abstract | Full Text:
Multicore Computation of Tactical Integration System in the Maritime Patrol Aircraft using Intel Threading Building Block
Muhammad Faris Fathoni, Bambang Sridadi
Page(s): 16-21
Abstract | Full Text:
Government Knowledge Management System Analysis: Case Study Badan Kepegawaian Negara
Elin Cahyaningsih, lukman -, Dana Indra Sensuse
Page(s): 22-28
Abstract | Full Text:
Forecasting the Length of the Rainy Season Using Time Delay Neural Network
Agus Buono, Muhammad Asyhar Agmalaro, Amalia Fitranty Almira
Page(s): 29-34
Abstract | Full Text:
Hybrid Sampling for Multiclass Imbalanced Problem: Case Study of Students' Performance Prediction
Wanthanee Prachuabsupakij, Nuanwan Soonthornphisaj
Page(s): 35-40
Abstract | Full Text:
Audrey Bona, Jean-Marc Salotti
Page(s): 41-46
Abstract | Full Text:
Digital watermarking in audio for copyright protection
Hemis Mustapha, Boudraa Bachir
Page(s): 47-51
Abstract | Full Text:
Multi-Grid Transformation for Medical Image Registration
Porawat Visutsak
Page(s): 52-56
Abstract | Full Text:
Creating Bahasa Indonesian - Javanese Parallel Corpora Using Wikipedia Articles
Bayu Distiawan Trisedya
Page(s): 57-63
Abstract | Full Text:
An Extension of Petri Network for Multi-Agent System Representation
Pierre Sauvage
Page(s): 64-71
Abstract | Full Text:
Gamified E-Learning Model Based on Community of Inquiry
Andika Yudha Utomo, Afifa Amriani, Alham Fikri Aji, Fatin Rohmah Nur Wahidah, Kasiyah M. Junus
Page(s): 72-78
Abstract | Full Text:
Model Prediction for Accreditation of Public Junior High School in Bogor Using Spatial Decision Tree
Endang Purnama Giri, Aniati Murni Arymurthy
Page(s): 79-84
Abstract | Full Text:
Application of Decision Tree Classifier for Single Nucleotide Polymorphism Discovery from Next-Generation Sequencing
Data
Muhammad Abrar Istiadi, Wisnu Ananta Kusuma, I Made Tasma
Page(s): 85-89
Abstract | Full Text:
Quality Evaluation of Airline’s E-Commerce Website, A Case Study of AirAsia and Lion Air Websites
Page(s): 90-93
Abstract | Full Text:
A comparative study of sound sources separation by Independent Component Analysis and Binaural Model
Bagus Tris Atmaja
Page(s): 94-98
Abstract | Full Text:
Enhancing Reliability of Feature Modeling with Transforming Representation into Abstract Behavioral Specification (ABS)
Muhammad Irfan Fadhillah
Page(s): 99-104
Abstract | Full Text:
Classification of Campus E-Complaint Documents using Directed Acyclic Graph Multi-Class SVM Based on Analytic
Hierarchy Process
Imam Cholissodin, Maya Kurniawati, Indriati, Issa Arwani
Page(s): 105-111
Abstract | Full Text:
Making Energy-saving Strategies: Using a Cue Offering Interface
Yasutaka Kishi, Kyoko Ito, Shogo Nishida
Page(s): 112-117
Abstract | Full Text:
Knowledge Management System Development with Evaluation Method in Lesson Study Activity
Murein Miksa Mardhia, Armein Z.R. Langi, Yoanes Bandung
Page(s): 118-123
Abstract | Full Text:
Extending V-model practices to support SRE to build Secure Web Application
Ala Ali Abdulrazeg
Page(s): 124-129
Abstract | Full Text:
Shared Service in E-Government Sector: Case Study of Implementation in Developed Countries
Ravika Hafizi, Suraya Miskon, Azizah Abdul Rahman
Page(s): 130-137
Abstract | Full Text:
Implementation of Steganography using LSB with Encrypted and Compressed Text using TEA-LZW on Android
Ledya Novamizanti
Page(s): 138-143
Hotspot Clustering Using DBSCAN Algorithm and Shiny Web Framework
Karlina Khiyarin Nisa
Page(s): 144-147
Abstract | Full Text:
Framework Model of Sustainable Supply Chain Risk for Dairy Agroindustry Based on Knowledge Base
Winnie Septiani
Page(s): 148-154
Abstract | Full Text:
View: 1-25 | 26-50 | 51-75
ICACSIS 2014
International Conference on
Advanced Computer Science and Information System 2012
(ICACSIS 2014)
Hotel Ambhara, Jakarta
October 18th - 19th, 2014
Committees
| Table of Contents | Author's Index | About This CD-ROM
Search
A
Achmad Benny Mutiara
467-471
Achmad Nizar Hidayanto
425-430
Adhi Kusnadi
171-176
Aditia Ginantaka
354-360
Afifa Amriani
72-78
Agus Buono
29-34
Agus Widodo
256-261
Ahmad Eries Antares
171-176
Ahmad Nizar Hidayanto
295-300
Ahmad Tamimi Fadhilah
269-276
Aini Suri Talita
467-471
Ajeng Anugrah Lestari
301-306
Ala Ali Abdulrazeg
124-129
Albertus Sulaiman
415-419
Alexander Agung Santoso Gunawan
237-240
Alfan Presekal
312-317
Alham Fikri Aji
72-78
Amalia Fitranty Almira
29-34
Anang Kurnia
342-347
Andika Yudha Utomo
72-78
Andreas Febrian
492-497
Aniati Murni Arymurthy
79-84
,
216-221
,
425-430
Anthony J.H. Simons
231-236
Anto S Nugroho
177-181
Arief Ramadhan
289-294
Arin Karlina
204-209
Ario Sunar Baskoro
227-230
Audrey Bona
41-46
Ayu Purwarianti
371-375
Aziz Rahmad
182-186
Azizah Abdul Rahman
130-137
Azrifirwan
388-393
B
Bagus Tris Atmaja
94-98
Bambang Sridadi
16-21
Bayu Distiawan Trisedya
57-63
Belawati Widjaja
256-261
Belladini Lovely
318-323
Bob Hardian
410-414
Boudraa Bachir
47-51
C
Chanin Wongyai
210-215
Cliffen Allen
376-381
D
Dana Indra Sensuse
22-28
,
289-294
Darius Andana Haris
376-381
,
438-445
Darmawan Baginda Napitupulu
420-424
Dean Apriana Ramadhan
382-387
Denny
10-15
Devi Fitrianah
425-430
Diah E. Herwindiati
431-437
Dwi Hendratmo Widyantoro
324-329
Dyah E. Herwindiati
450-454
E
Elfira Febriani
262-268
Elin Cahyaningsih
22-28
Endang Purnama Giri
79-84
,
216-221
Enrico Budianto
492-497
Eri Prasetio Wibowo
467-471
Eric Punzalan
155-160
F
Fadhilah Syafria
336-341
Fajar Munichputranto
262-268
Farah Shafira Effendi
90-93
Faris Al Afif
484-491
Fatin Rohmah Nur Wahidah
72-78
Febriana Misdianti
330-335
Firman Ardiansyah
204-209
G
Gladhi Guarddin
312-317
H
Hamidillah Ajie
251-255
Harish Muhammad Nazief
312-317
Harry Budi Santoso
402-409
Hemis Mustapha
47-51
Herman Tolle
472-477
Heru Sukoco
367-370
Husnul Khotimah
461-466
I
I Made Tasma
85-89
Ida Bagus Putu Peradnya Dinata
410-414
Ika Alfina
90-93
Ikhsanul Habibie
361-366
,
492-497
Ikhwana Elfitri
307-311
Imaduddin Amin
324-329
Imam Cholissodin
105-111
Imas Sukaesih Sitanggang
166-170
Indra Budi
256-261
Indriati
105-111
Irsyad Satria
342-347
Issa Arwani
105-111
Ito Wasito
446-449
Iwan Aang Soenandi
283-288
J
Janson Hendryli
431-437
Jean-Marc Salotti
41-46
Jeanny Pragantha
376-381
Joel Ilao
155-160
John Derrick
231-236
K
Karlina Khiyarin Nisa
144-147
Kasiyah M. Junus
72-78
Kyoko Ito
112-117
L
Lailan Sahrina Hasibuan
222-226
Ledya Novamizanti
138-143
M
M Anwar Ma'sum
394-401
M. Anwar Ma'sum
484-491
,
492-497
M. Iqbal Tawakal
484-491
Maria Ulfah Siregar
231-236
Maya Kurniawati
105-111
Meidy Layooari
177-181
Mira Suryani
402-409
Mohammad Uliniansyah
177-181
Muhammad Abrar Istiadi
85-89
Muhammad Asyhar Agmalaro
29-34
Muhammad Faris Fathoni
16-21
Muhammad Iqbal
467-471
Muhammad Irfan Fadhillah
99-104
Muhammad Octaviano Pratama
289-294
Muhammad Rifki Shihab
295-300
,
301-306
,
330-335
Muhammad Sakti Alvissalim
198-203
Murein Miksa Mardhia
118-123
N
Ni Made Satvika Iswari
171-176
Nina Hairiyah
262-268
Nuanwan Soonthornphisaj
35-40
Nursidik Heru Praptono
425-430
P
Pauzi Ibrahim Nainggolan
161-165
Pierre Sauvage
64-71
Porawat Visutsak
52-56
Prane Mariel Ong
155-160
Prasetia Putra
251-255
Putu Wuri Handayani
1-9
R
Ralph Vincent Javellana Regalado
246-250
Ravika Hafizi
130-137
Reggio N Hartono
177-181
Riva Aktivia
455-460
Roger Luis Uy
155-160
S
Sani M. Isa
431-437
,
450-454
Satyanto Saptomo
367-370
Setia Damawan Afandi
187-192
Shogo Nishida
112-117
Sigit Prasetyo
348-353
Siobhan North
231-236
Sri Tiatri
498-504
Sri Wahyuni
295-300
Stanley Karouw
277-282
Stewart Sentanoe
177-181
Suraya Miskon
130-137
Syandra
478-483
T
Taufik Djatna
262-268
,
283-288
,
318-323
,
354-360
,
388-393
,
455-460
,
461-466
Teny Handayani
446-449
Tji beng Jap
498-504
Tonny Adhi Sabastian
312-317
V
Vina Ayumi
289-294
W
Wanthanee Prachuabsupakij
35-40
Widodo Widodo
251-255
Wilson Fonda
371-375
Wina
450-454
Winnie Septiani
148-154
Wisnu Ananta Kusuma
85-89
Wisnu Jatmiko
484-491
Y
B Dwi Setianto
241-245
Yani Nurhadryani
342-347
,
455-460
,
461-466
Yasutaka Kishi
112-117
Yaumil Miss Khoiriyah
166-170
Yoanes Bandung
118-123
Yudho Giri Sucahyo
348-353
Yustina Retno W. Utami
241-245
Z
Zainal A. Hasibuan
402-409
lukman -
22-28
ICACSIS 2014
International Conference on
Advanced Computer Science and Information System 2012
(ICACSIS 2014)
Hotel Ambhara, Jakarta
October 18th - 19th, 2014
Committees
| Table of Contents | Author's Index | About This CD-ROM
Search
View
Please enable
Javascript on your browser to view all the page properly.
Copyright
Personal use of this material is permitted. However, permission to reprint/republish this material for advertising or
promortional purposes or for creating new collective works for resale or redistribution to servers or lists, or to reuse any
copyrighted component of this work in other works must be obtained from Faculty of Computer Science, Universitas
Indonesia, Indonesia.
Contacts
ICACSIS Committee
Email: [email protected]
Phone: +62 21 786 3419 ext. 3225
Faculty of Computer Science, Universitas Indonesia
Kampus UI Depok
Indonesia - 16424
Phone: +62 21 786 3419
Fax: +62 21 786 3415
Email: [email protected]
2014 International Conference on
Advanced Computer Science and Information Systems
(Proceedings)
Ambhara Hotel, Jakarta
October 18
th-19
th, 2014
Published by:
Faculty of Computer Science
An Analysis and Design of Frozen Shrimp
Traceability System Based on
Digital Business Ecosystem
Abstract—Traceability system is one of the most critical requirements in logistic information systems and the supply chain risk management for both global food safety and quality assurance. Real-time documentation from the earlier stages of production process enabled the two way process of traceability. This paper presented an analysis and design for traceability system of frozen Vanname shrimp based on digital business ecosystems (DBE) model. Business Process Model Notation (BPMN 2.0) was the primary tool in analyzing the task for capturing and transferring data processing between traceable units in each layer of DBE. Business process analysis helped to understand the capturing steps as the main element within such traceability system. The results of the analysis showcased how traceability system work in digital business ecosystem which involved on dispersed stakeholders. Manual data transformation to the digital system was provided by stakeholders using digital species metaphors. The requirement for factor analysis was computed with Relief method to select the most important attribute to capture. Our evaluation showed that the proposed system was able for estimating water salinity and related hatchery parameters changing, such as broodstock ID which utilized as key code. Current results showed the readiness of application to transfer into real world operation.
Keywords-traceability, digital business ecosystem, traceable unit, digital species
I. INTRODUCTION
Traceability is the ability to verify the history, location, or application of an item by means of documented recorded identification. Other common definitions include the capability (and implementation) of keeping track of a given set or type of information to a given degree, or the ability to chronologically interrelate uniquely identifiable entities in a way that is verifiable [1].
Traceability system could use to solve the food safety problems. The food safety context related to the efficacy of comestibles that can become the cause of diseases (bacteria, viruses, and germs) from one country to others will thus harm people’s health when consumed. This condition risked the potency of rejection from importer countries. Several regulations that control food safety give requirement to the
producers of comestibles to create a traceability system. This system is used to trace and track the flow of products on every supply chain mechanism in the production and its distribution processes.
The traceability system offers some benefits particularly in products with fresh and easily damaged characteristics such as vegetables, fruit, meat, milk and fish [2]. One of the efficacies of this system is that it can improve security towards food safety from the products it produced. This system enables elimination towards unqualified food products from the supply chain system as well as monitoring the environment condition that can influence the safety of products. Product certification gives significant influence in costumer confidence. Thus, traceability system is one of the requirements in ISO standard. ISO 22005 is one of the documents that regulated the design and implementation of traceability system in a feed and food supply chain [3].
Shrimp is one of the leading exports of fishery commodities. Indonesian export volume data show that 122 tons shrimp has been exported in 2012 [4]. The shrimp company has to meet the criteria in ISO standard which is regulated the traceability system to get the confidence of importers, therefore the rejection can be avoided. The traceability system is established by documenting exceptional information on every point of supply chain and process stages of product handling, thus food producers are able to give detail information on the food products. The information of the product collected by supply chain actor, then shared to another stakeholders. This process just happen when the actor become the member of business ecosystem in shrimp production. Therefore, it is required to model the process of documenting information on every point of supply chain which catalyzed by ICTs infrastructure. Several researchers have been conducted to find out the implementation of the traceability system, such as in vegetables supply chain [1], on soya beans [5] and in supply chain of aquaculture products [7].
The utilization of digital technology has formed a digital ecosystem in its business activity and therefore called as Digital Business Ecosystem (DBE). The data of documentation results can be stored in a database hence query can be conducted for the search process.
The development of traceability system on DBE base replaces all process documentation by using paper (paper based), thus resulting paperless document which benefits in the improvement in
Taufik Djatna and Aditia Ginantaka
Graduate Program of Agro-industrial Technology, Bogor Agricultural University, Indonesia
[email protected], [email protected]
ICACSIS 2014
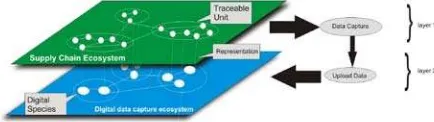
overcoming easily damaged products by recording the tracks of product quality, the improvement in product management recall, the automatic scanning, the improvement in stock management, and the decrease in both work force operational cost. The pilots traceability system based on DBE have been implemented in a private sector company which located in some sparsed Island. Their main business was on hatchery and processed food. Frozen Vanname shrimp chosen as the model because the complete process of the supply chain, start from breeding unit until the retailer or restaurant. This system’s constructions were in terms of interest a company which located in some sparse location of the Indonesian archipelago. Each actor in the traceability system is a model of organism in Digital Business Ecosystem which interact each other in data capture and tracing process. Through the development of Digital Business Ecosystem, every technical phase in the process of documenting data can be conducted by using the support of ICT based infrastructure that is analogized as digital species in digital ecosystem. The technique of product search can also be represented in the form of formulation and logic of computer programming hence the digital application design is attained for the process of data documenting and searching (Fig.1).
Fig 1.Structural Coupling between supply chain ecosystem and digital ecosystem in traceability
system [6]
The objective of this work were to analyze the requirement and to design of traceability system. We then focus to the proposed system for frozen Vanname shrimp products and then verify and validate the traceability system to evaluate system performance.
I. REQUIREMENTANALYSIS
A. Business Process Analysis
Business process in traceability system is modeled in BPMN 2.0. The Development of BPMN is conducted. It is started from the making of simple flow chart, granting information related roles, process, data and information to description, therefore it can be analyzed and simulated [8]. System analysis is conducted for parse a system be resolved into components so it the interaction between components and its environment can be seen. Results of analysis showed the capacity of the system as seen from its ability to add value from input to output [9]. Based on the business process analysis then retrieved five
stakeholders who take a role in the system of traceability and divided into four structure systems.
1. Input
This system requires data related to product, processes and product quality as main input [10]. Data related to product include its product identity code along with various identity components that support the formation of these products. Meanwhile, the data related to the process cover some of the indicators of the process that are set up on the stage of the seed production. Among them are pH of water, water salinity, survival rate, and temperature of water. The data related to the quality of the standard value according to SNI are the total plate count (TPC), the levels of lead, the levels of histamine and others. This system, however, is not documenting related data quality due to lack of infrastructure system.
2. Pre-process
The results of identification of the data attribute are then observed and documented in the application form for a period of time during material handling process.
3. Process
The main processes include documentation of process traceability system using an application data input of each stakeholder and tracing product process from end user stakeholder. Every stakeholder performs the process of documentation into application data input that was installed in the desktop computer on each unit of stakeholder. The process is then continued by printing the report in the form of label contains barcode of seed ID and destination pool for the process of enlargement shrimp larvae. The barcodes on the labels function as product identification that can be read using barcode scanner. Readable barcode labels subsequently can be added to the data on the next process. The barcode is printed back and imprinted on the next product label [11].
Quantitative model in the process of documentation of the data was then factorized using Relief method. This analysis was performed to find out the most influential data attribute in traceable unit. There were some attribute data defined as variables which were analyzed by using Relief algorithm such as survive rates, average pond water temperature, pH of water and water salinity. That variable used as quality process parameter in seed production, thus the variable have to documented for complete information. Different probability of the attribute X data value calculated as follow [12]:
[ ]
(
'( )
)
1 equal
samecl samecl
p Gini X
W X
p p
× =
− (1)
ICACSIS 2014
Where,
( )
( )
( )
(
)
( )
2 2 2 2' C | V
x X C C
V
P V
Gini X P P C
P V ∈ = × −
∑
∑
∑
∑
W [X] is an approximation of the following difference of probabilities of attribute X, Pequal is P(equal value
of X), Psamecl
As a system, traceability must fulfill basic architecture of Input-Process-Output components. The design of data flow which transforms inputs into outputs is represented in Fig. 2.
is P(same class), P(V) is probability of value, and P(C) is probable classes, P(C|V) is probability X value occurred in a certain class C.
Fig 2.The design of the data flow that transforms inputs and outputs
4. Output
The data set will store in the traceability repository include the relevant traceability data generated during the company operations [7]. Every single data will distributed to the query application by getting input product code from customer. The retailer as one of end user will get traceability reports after the process. This report answers the following typical traceability questions for instance:
- Result of tracing data product
- Generated recall list which contain all the needed information to contact affected customers and allow them to pull appropriate products if indicated
- Report which identifies any of the suspect lots or unit process with nonstandard procedure
II. COMPUTATIONAL EXPERIMENT
A computational experiment was set up to verify and validate at what extend the proposed system could fulfill the performance stakeholders required. A Java based application system in both PC-Windows 7 and Android-JellyBeans Machines was then constructed. The details are as follows
A. Capturing Data
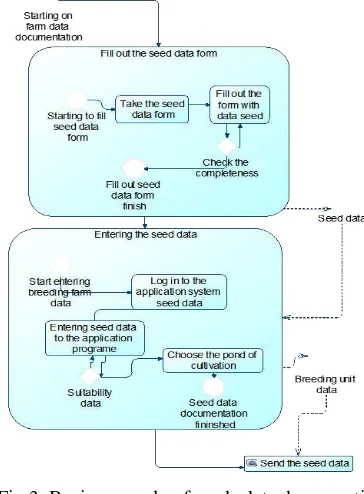
Every stakeholder carried out documenting process into data input application installed on desktop computer in each stakeholder unit. As an example, in the unit of seeds provision, the documented data attribute among others were broodstock ID, seeds ID, provided feed mill supplier, water temperature of the seeds pond, pH and water salinity. The entire data attribute was documented during the activity of seeds handling process in the data application form on breeding unit. Figure of business process stage of seeds documenting data can be seen on Fig 3.
Fig 3. Business cycle of seeds data documenting process
The stage of seeds handling process ended when the seeds grow turning into larva that are ready to be transferred into raising pond in the cultivation unit. After the entire data was documented, data was inputed from the seed data form into the desktop computer. Data input application in desktop computer would save all documented data, then printed the report in the form of label with barcode from seeds ID and pond destination for the process of raising the fish larva. Data input application were illustrated in Fig 4. (2)
System Environment
Regulation Digital Device Traceability System Input: Data Product Data Process Stakeholder: - Breeding unit - Ongrowing unit - Processing unit - etc
Role:
- Capture data - Tracing process
Output: Tracing report
Recall Report
ICACSIS 2014
Fig 4. Application of seed data input
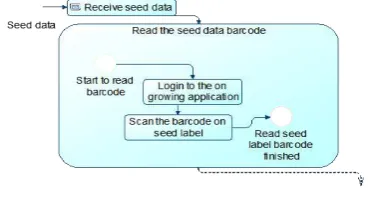
Every process of data input was carried out at the end of material handling process because documenting data related to production process and track record was carried out to the next stage during the material handling process. Every stakeholder carried out the same process namely data input process into desktop computers to be stored in a server. The printed barcode in label became the key for product registration handled by using barcode scanner (Fig 5). Application for other stakeholders was deployed input documented data in the next process of production.
Fig 5. Stage of data reading with barcode scanner
Table I shows data in the stakeholder of seeds supply unit documented during the ongoing system. Data attributes were analyzed by using relief method to figure out the most influenced factor and required to be well documented during the process of product
handling. The analyzed data attribute were numerical type showing a value. The results of factor analysis showed attribute sequence that influence the system and become the consideration in determining critical data attribute that were needed to be constantly documented. The attribute determination became a source to create security system in source code input data software so that the process of data input into server was not available until data attribute filled in. Table II shows example of relief method utilization to determine critical attribute.
TABLE II
RESULTS OF FACTOR ANALYSIS WITH RELIEFF METHOD
Data Attribute Relief Value Rank
Survive Rate -0,4 4
Average Pond water Temperature
-0,1 2
pH of water -0,3 3
Water Salinity -0,093 1
B. Tracing data
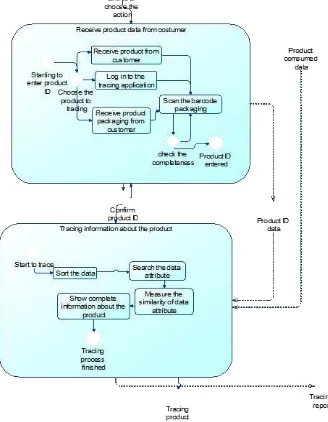
A database for this traceability information system was constructed for data query using three mathematic model follow as manual tracing process, such as sorting, searching and check the suitable data with similarity measurement, then arrange as source code software by using java programming. This data query application would be used by end user as one of the Stakeholders roles for tracing distributed products in customers. Figure of product tracing process at end user stakeholder is shown on Fig 6.
In this explanation, the writer described the use of the third mathematic model for the process of product tracing by using data at the stage of seeds supply. Computing stage from search mode in data query application was initiated by location searching of date data by utilizing interpolation search method with the following equation:
[ ]
[ ]
[ ]
(
)
BC Sought-BC
Position = DI -DI DI
BC -BC low
high low low
high low × +
Where BC is a broodstock code, DI is a data index, BC [high] is the top level of BC and BC [low] is bottom level of BC.
(3) TABLE I
DATA SEEDS DOCUMENTATION ON BREEDING FARM No
Index
Date Batch number
Broodstock Seeds ID Feed Supplier ID Feed Supplier ID Ongrowing Pond Survive Rates (%) Pond Temperature (°C) pH of Water Water Salinity (mg/l)
code ID Code No
0 12/08/2014 1 IU 2 31 P 003 Jordan 1A 97 23 7 1212
2 IU 6 32 P 001 Simon 2A 97 23 7 1431
3 IU 10 33 P 001 Simon 1B 96 23 7 1308
4 IU 8 34 P 003 Jordan 3A 95 24 8 1310
1 13/08/2014 5 IU 4 35 P 003 Jordan 2B 97 25 7 1301
6 IU 9 36 P 001 Simon 2C 97 24 7 1403
7 IU 7 37 P 003 Jordan 3B 97 23 9 1100
8 IU 1 38 P 001 Simon 1C 96 24 9 1379
2 14/08/2014 9 IU 5 39 P 003 Jordan 1D 97 25 7 1159
10 IU 3 40 P 003 Jordan 4A 97 24 9 1191
Note: This data follow the normal distribution random hypothetical.
ICACSIS 2014
Data Index of location search from Table I data uses equation model (3) was simulated in the following calculation:
Search key : 13 Data Index low : 0 Data Index high : 2
Position = 13–12
14–12�(2 – 0) + 0 = 1
Data discovered in index [1] dated 13/08/2014 along with other data in Tabel III.
TABLE III DATA BASED ON TABLE I No
Index
Date Broodstock ID seeds ID … Water Salinity (mg/l)
Code no
1 13/01/2014 IU 4 35 1301
13/01/2014 IU 9 36 1403
13/01/2014 IU 7 37 1100
13/01/2014 IU 1 38 1379
Based on Table I
The computing process by application enters the next stage based on broodstock ID. Before the process of data search was conducted, the broodstock ID was processed by using insertion method with the following stages:
- When i =1, x equals to Data [1] = 9 and j=0. Because data [0] = 4 and 9 > 4 thus process was continued for i=2.
- When i =2, x = Data [2] = 7 and j=1. Because data [1] = 9 and 7 < 9, thus carried out shifting to the left until data which was smaller than 7 was discovered. Results of this shifting, Data [1] = 7 and Data [2] = 9 whilst Data [0] = x = 4. - When i =3, x = Data [3] = 1 and =2. Because
Data [2] = 9 and 1 < 9, thus shifting was carried out until data which was smaller than 1 was discovered. Results of this shifting, Data [2] = 7 and Data [3] = 9 whilst Data [1] = x = 4. And so forth
Fig 6. Stage of product tracing by end user
The searched broodstock ID was IU7. However, the code identification used in search process was numerical data. Index number was the number of data position in database arrangement. The search process was explained as follows:
Search key : 7 Data Index low : 0 Data Index high : 3
Position = 79–1
–1�(3 – 0) + 0 = 2
Data discovered in index [2] seed ID 37 along with other data attribute among others.
TABLE IV DATA BASED ON TABLE I Seeds
ID
Feed Supplier ID
Feed Supplier
…
Water Salinity (mg/l)
37
P003
Jordan
1100
(Based on Table 1)
After the searched data were attained, hence similarity measurement was carried out with standard data attribute using Cosine Similarity [13] as follows:
( )
., ,
|| |||| y ||
t x y sim x y
x
=
Where x and y is two vectors for comparison, then ||x|| is the Euclidean norm of vector
x
= (x
1, x
2,
x
3….x
p2 2 2
1 2
...
px
+
x
+ +
x
) which defined as:
Standard data attribute in the form of numeric value and factual data of search results is shown in Table V.
TABLE V
STANDARD DATA ATTRIBUTE OF QUALITY REFERENCE Attribute Symbol Survive
rate Average Temp (°C) pH of Water Water Salinity (mg/l)
standard X1 98 25 8 1300
37 X2 97 23 9 1100
Suppose that X1 and X2 are the first two term -frequency vectors in Table 4. That is, X1 = (98, 25, 8, 1300) and X2
Based on the results of similarity measurement, it indicated that the parameter of seeds quality from the searched seeds ID was almost similar to the standard parameter with value of 0,999. Thus, it could claim that the seeds ID were in the standard of cultivation process.
= (97, 23, 9, 1100). How similar are X1 and X2? Using Eq. (4) and (5) to compute the cosine similarity between the two vectors.
The dataset from ongrowing unit show in Table VI. Pond ID was inter-correlated with data attribute from ongrowing process, such as feed supplier ID and other quality process for instance pH water, temperature of water, survive rates, weight and container temperature. During the harvesting days, the data of yield and transportation are collected by an application form to get data about harvest date and harvest container ID which used to. The processing
(4)
(5)
ICACSIS 2014
stage followed the same documentation process to get information about production line of shrimp packaging and then transport to the cold storage. The dataset of processing unit showed on Table VII.
In the same case, the data were available in order to get further information about the product. The identification of data utilizes by date other ID number which get from supply chain event.
Traceability management information system provided intangible advantages for instance practicality, security and the deliverability of data for each stakeholder. The data could save, organized and emerged easier. Besides financial benefits, this system given improvement in the quality of information for management decision-making, and prevents in errors documentation processes. The operator could save the data on the data base system just by complete all field on the data software application. Each data saved with high security from lost and easy transferring to the other stakeholder by the local network among the computer. This system could provide information for increasing
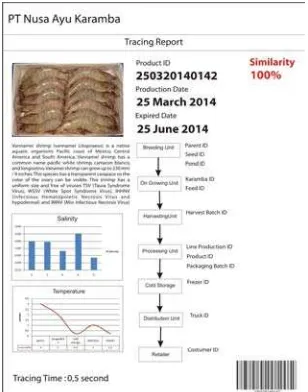
customer confidence about the frozen shrimp product. Some information included in the tracing report such as:
1. Description of the product 2. Expired date of product
3. Flow chart of the process, include :
- Identification number of unit process or material
- Temperature process and water pond salinity
4. Similarity value of the process with standard procedure and
5. Duration of tracing
Other report can be produced to give information about recall list with contact number of affected customers. The result of reporting can be seen on Fig 7.
Fig 7. Report of tracing product
III. CONCLUSIONS
Based on the analysis using BPMN 2.0, it is known that there were five stakeholders taking role in traceability system. The results of critical attribute determination by using relief method determined that water salinity parameter became critical attribute that requires documentation. The results of mathematic verification model show that the model used was able to produce the expected parameter according to its purpose. The rule of sorting method could show data sorting process. Search method also proved that it could be utilized for searching data location index. Similarity measurement shows that data attributed similar with standard process, thus the value almost 1
IV. REFERENCES
[1] Hu Jinyou, Zhang Xu, Liliana M.M Neculita M. Modeling and Implementation of The Vegetable Supply Chain TraceabilitySystem. Journal of Food Control 30, 2013, 341– 353.
[2] Scheer F.P. Optimising Supply Chain Using Traceability System. Wageningen University and Research Centre, The Netherland, 2006.
[3] [ISO] .ISO 22005:2007. Traceability in The Feed and Food Chain —General Principles and Basic Requirements for System Design and Implementation. New Delhi: Bureau of Indian Standard, 2007.
TABEL VI
DATA SHRIMP DOCUMENTATION FROM ONGROWING UNIT
Date Pond
ID
Harvest Container ID
Feed supplier ID
Feed supplier pH water water temperature (°C) Survive Rate (%) Weight (g) Container Temperature (°C)
12102014 2A HC2A01 FS003 PT DevFeed 8 26 98 16160 7
HC2A02 HC2A03
1A HC1A01 FS002 PT Comfeed 9 24 99 16780 7
HC1A02 HC1A03
Note: This data follow the normal distribution random hypothetical
TABEL VII
DATA SHRIMP DOCUMENTATION FROM PROCESSING UNIT Date packaging Line ID Pond ID
Cold Storage ID Grade (Box) @ 1000 g Pack Temperature (°C) Cold Storage Temperature (°C)
A B C
12102014 L1 2A CS01 6 5 5 5 2
2C 8 3 5 5 2
1B 6 9 2 5 2
L2 1A 3 5 8 5 2
3A CS02 6 6 2 5 2
1C 4 4 6 5 2
ICACSIS 2014
[4] [BPS]. Trends of Selected Socio-Economic Indicators of Indonesia. Statistics Indonesia, Jakarta, 2013.
[5] Thakur Maitri and Donelly Kathryn A.M. Modeling
Traceability Information in Soy Bean Value Chains. Journal of Food Engineering 99, 2010, 98–105.
[6] Nachira F, Dini P, Nicolai A, Marion L.Louarn, Leon R.L (Ed). Digital Business Ecosystems. European Commission: Luxembourg, 2007, 1-20.
[7] Marchante A.P, Melcon A.A, Trebar M. and Filippin P. Advance TraceabilitySystem in Aquaculture Supply Chain. Journal of Food Engineering 122, 2014, 99–109.
[8] White Stephen A. and Miers Derek. BPMN Modelling and Reference Guide. USA: Future Strategies,Inc, 2008.
[9] Wasson C.S. System Analysis, Design and Development. New Jersey (NJ): John Wiley & sons, Inc, 2006.
[10] Thakur Maitri, Sorensen C.F, Bjornson F.O, Foras E, Hurburgh C.R. Managing Food Traceability Information Using EPCIS Framework. Journal of Food Engineering 103, 2011, 417–433.
[11] Derrick S and Dillon M. A Guide to Traceability Within The Fish Industry. 2004. Swiss: SIPPO/ EUROFISH, 2004.
[12] Kononenko Igor. Estimating Attributes: Analysis and Extentions of Relief. European Conference on Machine Learning Catania, Italy, 1994, 171-182.
[13] Han Jiawei, Kamber Micheline, and Pei Jian. Data Mining Concepts and Techniques 2nd Edition. Morgan Kaufmann
Publisher, 2006