AN ANALYSIS AND DESIGN OF FROZEN SHRIMP
TRACEABILITY SYSTEM BASED ON
DIGITAL BUSINESS ECOSYSTEM
ADITIA GINANTAKA
GRADUATE SCHOOL
BOGOR AGRICULTURAL UNIVERSITY BOGOR
I hereby declare that thesis entitled An Analysis and Design of Frozen Shrimp Traceability System Based on Digital Business Ecosystem is my own work and to the best of my knowledge it contains no material previously published in any university. All of incorporated originated from other published as well as unpublished papers are stated clearly in the text as well as in the references.
Hereby, I state that the copyright to this paper is transferred to Bogor Agriculture University.
Bogor, April 2015 Aditia Ginantaka
System Based on Digital Business Ecosystem. Supervised by TAUFIK DJATNA and IRVAN FAIZAL.
Traceability is the ability to verify the history and location of a food product, thus we could get information on each supply chain actor, who the immediate supplier is and to whom the product sent. Therefore, system approach could used to manage and integrated all information by collecting, store and then retrieve data and information about the product from the earlier stages of production process. One of the biggest challenges is how to exchange and keep the flow of information in a standardized format between supply chain actors. Therefore, to solve the problem, this research focuses on developing a model for documenting and exchanged information based on the digital business ecosystem (DBE). Besides, DBE would support the supply chain actor, in order to integrate all information including the quality and product safety. That’s why DBE is promises as a foundation to establish traceability system.
The objective of this work were to analyze the requirement and to design of traceability system. This research focuses to the proposed system for frozen Vanname shrimp products and then verify and validate the traceability system to evaluate system performance. Business process model notation (BPMN) was the primary tool in analyzing task for capturing and transferring data processing between traceable units. BPMN diagram was construct based on interaction between the supply chain actors in it where each actor has their roles to achieve a common goal.
The results of the analysis showcased how traceability system work in DBE which involved on dispersed stakeholders. Manual data transformation to the digital system was provided by stakeholders using digital species metaphors, which has been performed and implemented in Java language program. The most appropriate attributes to capture were chosen with Relief method. Water temperature has been selected as attribute which have to keep recorded, to ensure that temperature kept maintained on the entire supply chain stages. This system could claim that the product were safe using cosine similarity computation. As first response to the customers, traceability system also developed to provides information about time required for completion issue after source of product defect has traced. Thus, Fuzzy Associative Memory (FAM) method was used to predict handling time, which assumed influenced by the amount of products inventory that used to replace product defect, amount of products that have to recall from market and amount of time spends for handling inspection process internally. Inspection based on white box verification method was used to proven whether the logic of the model in each stakeholders is implemented correctly or not. Validation has performed using user interview method and simulation test based on black box principle. Result of documentation all evaluation stages, show that traceability system was verified by checking each performance and formulation.
Beku Berbasis Digital Business Ecosystem. Dibimbing oleh TAUFIK DJATNA dan IRVAN FAIZAL.
Traceability merupakan kemampuan memeriksa riwayat dan lokasi sebuah produk pangan, sehingga diperoleh informasi berkaitan dengan siapa pemasok dan kemana produk didistribusikan pada jaringan rantai pasoknya. Pendekatan sistem digunakan untuk mengatur dan mengintegrasikan informasi melalui pendokumentasian data pada setiap titik rantai pasok dan rantai proses penanganan produk. Salah satu tantangan besar adalah, bagaimana melakukan pertukaran dan menjaga aliran informasi dalam format yang standar diantara pelaku rantai pasok. Sehingga, penelitian ini fokus pada pengembangan model sistem untuk proses dokumentasi dan transfer informasi berbasis pada konsep digital business ecosystem (DBE).
Penelitian ini bertujuan untuk menganalisis kebutuhan serta mendesain sistem traceability. Fokus penelitian ini adalah untuk menawarkan gagasan sebuah sistem traceability produk udang beku, kemudian melakukan verifikasi dan validasi sistem untuk mengevaluasi kinerja sistem. Business process model and notation (BPMN) merupakan alat utama untuk analisis tugas-tugas dalam proses pendokumentasian dan transfer data diantara stakeholder. Diagram BPMN dibuat berdasarkan interaksi di antara pelaku rantai pasok yang ada di dalamnya, dimana setiap aktor memiliki peran masing-masing untuk mencapai tujuan bersama.
Hasil analisis menunjukan bahwa sistem traceability berbasis DBE ini melibatkan lima stakeholder. Proses transfer data ke dalam bentuk digital dilakukan oleh setiap stakeholder menggunakan aplikasi digital yang merupakan perumpamaan spesies dalam ekosistem digital (digital spesies). Spesies digital didesain dan dikembangkan dengan menggunakan bahasa pemrograman Java. Atribut data yang harus selalu dokumentasikan ditetapkan dengan menggunakan metode Relief. Suhu air dan komoditas ikan ditentukan sebagai atribut yang harus selalu direkam selama proses produksi. Sistem ini dapat menegaskan keamanan produk menggunakan teknik komputasi Cosine Similarity. Jumlah waktu yang dibutuhkan untuk penanganan produk yang cacat, dapat diprediksi menggunakan metode Fuzzy Associative Memory (FAM). Diasumsikan bahwa input sistem FAM, dipengaruhi oleh variable jumlah persediaan produk, jumlah produk recall dan jumlah waktu yang dibutuhkan untuk melakukan inspeksi lapang pada unit-unit penganangan produk. Verifikasi sistem dengan melakukan inspeksi berbasis metode white box digunakan untuk membuktikan apakah kerangka logis dari proses pemrograman sistem berfungsi secara benar pada setiap stakeholder. Proses validasi dilakukan dengan menggunakan metode interview dan simulasi berbasis metode black box. Hasil pengujian menunjukan bahwa sistem telah siap untuk digunakan dalam dunia nyata.
© Copyright 2015 by IPB
All Rights Reserved
No part or all of this thesis may be excerpted without or mentioning the sources. Excerption only for research and education use, writing for scientific papers, reporting, critical writing or reviewing of a problem. Excerption doesn’t inflict a financial loss in the paper interest of IPB.
Thesis
as partial fulfillment of the requirements for the degree of Master of Science in the Agroindustrial Technology Study Program
AN ANALYSIS AND DESIGN OF FROZEN SHRIMP
TRACEABILITY SYSTEM BASED ON
DIGITAL BUSINESS ECOSYSTEM
GRADUATE SCHOOL
BOGOR AGRICULTURAL UNIVERSITY BOGOR
2015
Thesis Title : An Analysis and Design of Frozen Shrimp Traceability System Based on Digital Business Ecosystem
Name : Aditia Ginantaka
NIM : F351130361
Approved by Supervisor
Dr Eng Taufik Djatna, STP, MSi Chairman
Dr Irvan Faizal, MEng Member
Acknowledged by
Head of
Agroindustrial Technology Study Program
Prof Dr Ir Machfud, MS
Dean of Graduate School
Dr Ir Dahrul Syah, MScAgr
PREFACE
Praise to Allah Subhanahu Wa Ta’ala the Almighty for the overall conducive conditions for me to pursue my study and thesis work in Graduate School of Bogor Agricultural University, Indonesia and His blessings to successfully complete it.
Firstly, I would like to express my sincere appreciation to Dr Eng Taufik Djatna, STP, MSi and Dr Irvan Faizal, MEng as supervisor for the support and encouragement during my study in Bogor Agricultural University. I am also indebted to Prof Dr Ir Kudang Boro Seminar, MSc as Non-committee Examiner for his constructive comments on this thesis.
I would like to thank PT Nusa Ayu Karamba for giving me the opportunity to conduct my research and data collection. I wish to thank all lecturers and colleagues, especially TIP 2013, at the Agroindustrial Technology Study Program for cooperation and shared their valuable ideas and insights in relation to this study. It has been a pleasure to work with you.
Last but not least, I want to express my deepest appreciation to my parents who have always prayed for me and gave me moral support to complete my studies and I am grateful to my wife for their true and endless love, for never-failing patience and encouragement.
I wish that this work will be of benefit to readers and contribute to the development of knowledge.
Bogor, April 2015
TABLE OF CONTENTS
TABLE OF CONTENTS vi
LIST OF TABLES vii
LIST OF FIGURES vii
LIST OF APPENDIXES vii
1 INTRODUCTION 1
Background 1
Problem Definition 3
Research Objectives 3
Boundaries of Research 3
2 LITERATURE REVIEW 4
Traceability 4
Traceability System in Fisheries Supply Chain 5
Digital Business Ecosystem 7
System Analysis and Design 8
Data Mining and Soft Computing 12
PT Nusa Ayu Karamba 14
3 METHODOLOGY 14
Framework 14
Business Process Analysis 15
Identification of System Component 16
Determine Critical Attribute 16
Design Traceability Information System 17
Verification and validation 20
4 RESULTS AND DISCUSSIONS 21
Identification of Existing Business Process 21
Requirement Analysis 23
Design Traceability Information System 27
System Evaluation 31
5 CONCLUSIONS AND RECOMENDATIONS 33
Conclusions 33
Recomendations 34
REFERENCES 34
APPENDIXES 37
LIST OF TABLES
1 Notation used in developing the BPMN (White and Miers 2008) 11
2 Data identification and range of value processing parameters 23
3 Coding required and existing coding system 23
4 Seed data documentation result on breeding farm 24
5 Results of factor analysis with Relief method 27
6 Shrimp data documentation result from ongrowing unit 29
7 Shrimp data documentation result from processing unit 29
8 Standard data attribute of quality reference 30
LIST OF FIGURES
1 Linking database in a traceability system (Adopted from Furness and
Osman 2006) 5
2 An architecture of the traceability system in fisheries product (Adopted
from Parreno-Marchante et al. 2013) 6
3 Analytical System Entity Construct (Wasson 2006) 9
4 System development life cycle (Kendall and Kendall 2011) 10
5 Sample BPMN process (Derreck and Miers 2008) 10
6 The framework of traceability system for frozen shrimp product 15
7 Triangular membership function of Fuzzy set X for variable A 19
8 Current business process and provision of information at the company
(Adopted from Parenno-Marchante et al. 2014) 21
9 Breeding unit 22
10 Ongrowing unit 22
11 Fragment of seeds data documentation process 25
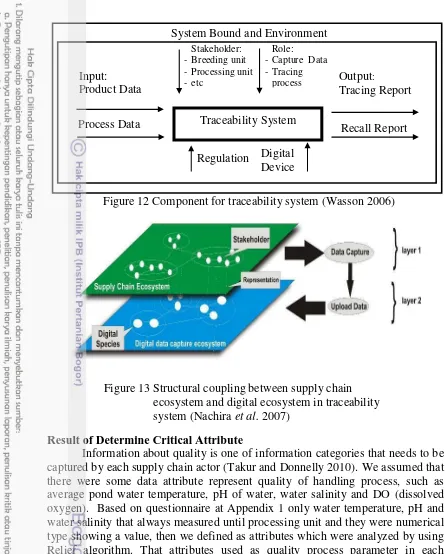
12 Component for traceability system (Wasson 2006) 26
13 Structural coupling between supply chain ecosystem and digital ecosystem
in traceability system (Nachira et al. 2007) 26
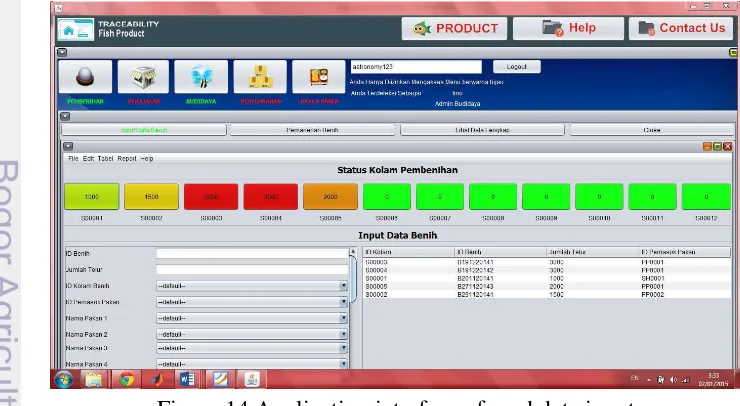
14 Application interface of seed data input 27
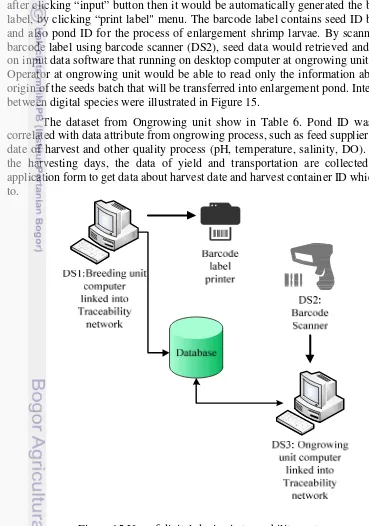
15 Use of digital device in traceability system 28
16 Possible information exchange between different actors in the frozen shrimp supply chain (Adopted from Thakur and Hurburgh 2009) 29
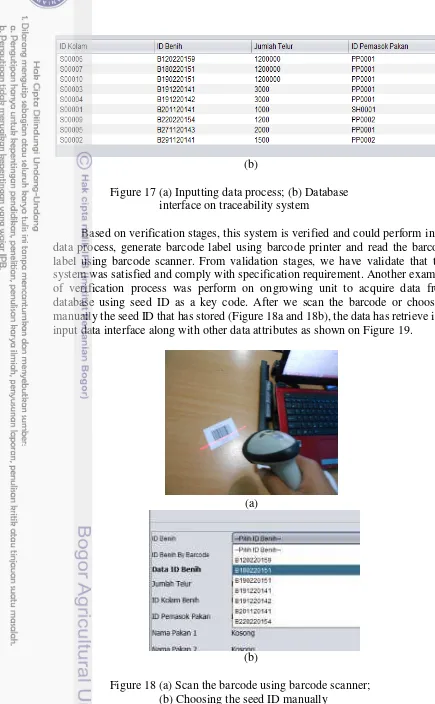
17 (a) Inputting data process; (b) Database interface on traceability system 32
18 (a) Scan the barcode using barcode scanner; (b) Choosing the seed ID
manually 32
19 Result of retrieval data process 33
LIST OF APPENDIXES
1 Questionnair TU1 37
2 Documentation result from software application 41
3 Fuzzy set formulation for Product Inventory 42
4 Fuzzy set formulation of product recall 43
5 Time required to perform several inspection process 44
6 Fuzzy set formulation for inspection time 45
7 Fuzzy set formulation for total handling 46
9 Computation result of matrix M and B 48
10 Requirement verification matrix (RVM) 50
11 Sample of application form for data capturing on breeding unit 53
12 Fragment of documentation process at ongrowing unit 54
13 Fragment of documentation process at processing unit 55
14 Fragment of documentation process at cold storage unit 56
1
INTRODUCTION
Background
Traceability is an ability to provide the information of history and location based on movement of goods in every stage of production and distribution process. The system requires the supply chain actors knowing who the immediate supplier is and to whom the product sent, that each actor have the information access, both to upstream and to downstream (Bosona and Gebresenbet 2013; Mgonja et al. 2013). Some countries require the producers to have traceability system as an effort to protect their people’s health and safety. Thus, this system is very important for the exporters to avoid rejection from importer countries. Several laws and legislation that regulate the food safety in some countries are Bioterrorism Act by the government of United States of America in 2002 (Thakur and Hurburgh 2010),
European Union’s General Food Law which was published in 2005 and Chinese Food Safety Law which had been implemented in 2009 (Hu et al. 2013).
Traceability system could reduce cost and labour related the information exchange among business partners and also in information and data logistics improvement of the company internally. Besides that, traceability system provides access to more accurate and more timely information needed in decision making process about how and what to produce, and makes the company has a competitive advantage through its ability in documenting products’ information (Olsen and Borit 2013). Customers is also very interested to receive more accurate information about food product and willing to pay more for food product that could provide service to consult about the origin and freshness declared by using traceability system. The benefit of this system can be the reason for the company to implement traceability system which not only pushed by the compliance to the regulation in some importer countries.
However, every business actor in supply chain must collecting the needed information together internally (internal traceability), continuously (record-keeping), and integrating them to supports the improvement of traceability chain system among the suppliers. That is why, the improvement of traceability system needs a technological innovation that can support the process of products identification, information collection, data storage and transformation, and system integration. Some researches were done to build the structure of information, sending and receiving information from various actors in the system. Process of standardizing the information and automation process in data identification, measurement, and storage, are very needed (Thakur et al. 2011).
environment, every supplier in digital traceability system can be assumed as a species in digital ecosystem which interacts in documenting and acquiring information.
Traceability system based on digital infrastructure have been develop in order to record-keeping necessary information on tracking and tracing process and for automatically deliver information to customers. However, there are differences in the information provided in each agricultural commodity. Thus, producers have to choose the necessary information that customers really want to know, as well as the customer's right to know. Several researchers have been proposed of the electronic chain traceability system, such as in vegetables supply chain (Hu et al. 2013), on soya beans (Thakur and Donelly 2010) and in aquaculture products (Parreno-Marchante et al. 2014).
Food product is a perishable goods and have several supply chain actors. They are started by the production of raw materials from farmer, wholesaler, processor, distributor, and retailer. These characteristics requires appropriate hold and control to keep the quality and safety. Increasing complexity of food supply chain has encourage the supply chain actors to make a vertical integration for information exchange. Therefore, traceability system based on DBE aims to construct a digital environment that provide and facilitate stakeholders in sharing and acquisition information. Each stakeholders could interact easily in digital environment. Therefore, DBE concept could use as a foundation to establish traceability system. As one of main commodities in fisheries with 162.068 tons of export volume in 2012 (KKP 2013), shrimps are potentially to be one of main income for the business owners in Indonesia. Thus, the improvement of traceability system is required to raise the trust of importers to Indonesian frozen shrimps. Ministry of Marine Affairs and Fisheries of the Republic of Indonesia also has regulate about the obligation of traceability system implementation in Ministerial Decree No KEP. 01/MEN/2007 (KKP 2007). Traceability system for fishery products was done on paper documentation, in the first appearance in 2000, and in 2008 this system was suggested to be automatically implemented (Parreno-Marchante et al. 2014). DBE has a big potentiality in helping SMEs to connect each others in order to exchange and acquire data and information between supply chain actors. Besides, tracebility based on DBE have to support the supply chain actor, in order to integrate all information including the quality and product safety. Thus, this system needs supported with the capability to estimates that whole production processes were in standard procedures. Therefore we have to measure the similarity between field data and the standard value of each data.
association from historical condition of several factors that influence time to handling issue, thus the prediction could be adaptively inferred and modified.
Problem Definition
Improvement of digital technology in the implementation of internal traceability system has produced some advantages which have more significant relationship to efficiency of time and human resource (Scheer 2006). Several of technology have been used in data documentation, such as PDA (personal digital assistant) with GPRS-based and 2D barcode in meats labeling (Ben-hai et al. 2010), traceability system with 2D barcode and RFID (radio frequency identification) in wheat flours (Qian et al. 2011), RFID and infrastructure with WSN-based (wireless sensor networks) for fishery products (Parreno-Marchante et al. 2014).
Based on the last development in traceability system, digital-based technology is needed to improve traceability system in Indonesia. There is still no any fishery business in Indonesia using integrated traceability software on each supply chain actors. Both small and medium enterprises are still using paper-based system. Therefore, it is needed to improve integrated digital traceability information system based on digital business ecosystem (DBE) concept as a model in chain traceability.
Research Objectives
According the motivation that have been delivered, the objective of this work were (1) to analyze the requirement of traceability system by means of business process analysis; (2) to design component, rule, role and integration for traceability management information system; and (3) to verify and validate the traceability system to evaluate system performance.
Boundaries of Research
Traceability system was implemented for frozen Vanname shrimp. Analyzed ecosystem was the internal ecosystem of company at product unit which represents the supply chain system such as, breeding unit, ongrowing unit, processing unit, cold storage unit, and retailer unit. Research object had implemented pond coding and data documenting manually with data compilation from production parameter including the amount of seeds, temperature, pH, feed, and so forth but not yet integrated.
Each product handling unit is the stakeholders in the system. System design focused on documenting product history at every stakeholder and tracing at retailer unit. This system can only be used by supply chain actors who have adopted ICT tools in their business activities, for instance the use of personal computers (PC), then connectivity between computers by P2P (peer-to-peer) networks, the local area network (LAN), or enabling the internet connections. System design included software development for data input and data query with login system according to stakeholder in digital ecosystem. System capability was developed for similarity measurement and prediction of total handling time using the method of Fuzzy Associative Memory (FAM) (Kosko 1990). This system produced report with needed information for stakeholders, and last but not least traceability system was evaluate.
2
LITERATURE REVIEW
Traceability
The general concept of traceability can be defined as an ability to identify the origin of goods or product based on recording information at the entire pathway of supply chain. However, various definitions have been derived for traceability, including a European Union (EU) General Food Law Regulation definition in which traceability is defined as “the ability to trace and follow a food, feed, food-producing animal or substance through all stages of production and distribution”. An International Standards Organisation (ISO) definition is also to be found that defines traceability as “the ability to trace the history, application or location of an entity by meansof recorded information” (Furness and Osman 2006). This is often termed the principle of “one-up and one-down” (Hu et al. 2013; Thakur and Hurburgh 2010).
The increasing demand a high-quality food and feed products is driven by consumer experience with food safety and health issues. Therefore, there are increasing of interest in developing a system that aims to food traceability efforts (Thakur and Hurburgh 2009). The UK Food Agency define functional roles for traceability on the food supply chain management, such as (1) to facilitate rapid response to solve food safety incidents, (2) to facilitate sampling food at critical points at the entire food supply chain mechanism, (3) provide access to gain information concerning foods or food ingredients that could support to food safety, (4) to help determine supply chain integrity with respect to food claims and false labelling (5) to prevent fraud in the food trade, (6) to support food distribution improvement processes and minimize wastage of food, (7) to support food hygiene in processing and handling of food (Furness and Osman 2006).
similarity in both categories traceability system is, concern only to the ability to trace goods, by identify the specific product and linked to the related records. However it is does not mean that all the information should be permanently visible by being included on a product label.
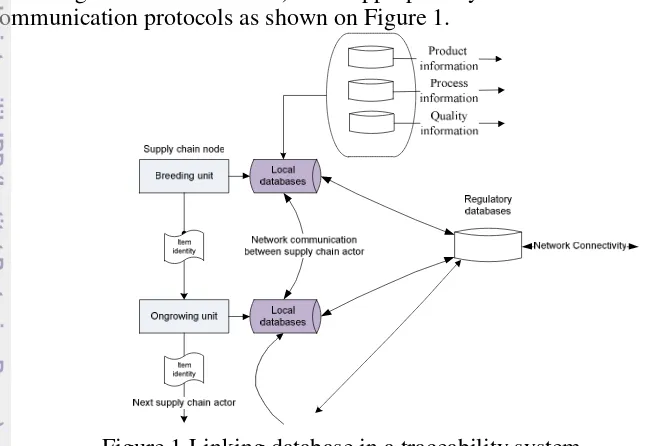
Thakur and Donnelly (2010) explains that the implementation of a traceability system requires an analysis of the product material flow, the flow of information and the information handling. There are three categories of information that needs to be captured by each supply chain actor, for instance the product information, process information, and quality information. To allow access to the information that have documented traceability system requires a network infrastructure (including use of the Internet) with appropriately authorised access control and communication protocols as shown on Figure 1.
Figure 1 Linking database in a traceability system (Adopted from Furness and Osman 2006)
Traceability system is necessary to use item-attendant identifiers, to support identification of specific information. The most probably identification technique using standard EAN UCC (European Article Numbering Universal Code Council) which is an association of international numbering. EAN UCC provides system of numbering and identification using the Global Trade Item Number (GTIN) as identifiers of the type of goods on trading transaction (Furnes and Osman 2006).
Traceability System in Fisheries Supply Chain
Fisheries sector has become one of the food-producing sector of the fastest growing, especially in the Aquaculture subsector. The appropriate management could be a key for supporting the role to meet the rising demand for fishery products. (FAO 2014). Thus, several country have implement traceability system especialy to record environmental paramenters which must be controlled and strickly maintained such as temperature and humidity in the processing environment, during transport or warehousing.
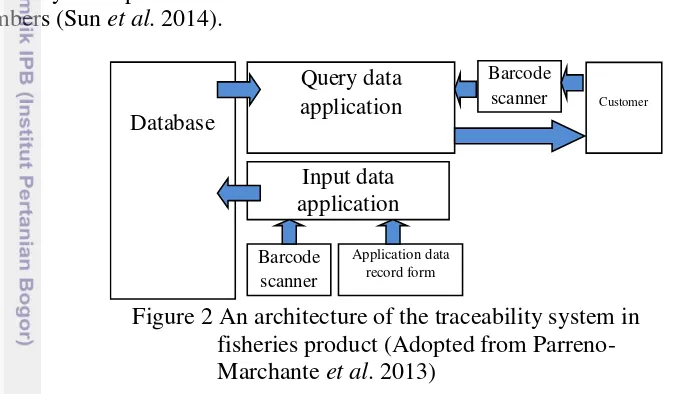
RFID readers, antennas, tags and barcode readers. The second component is the set of capture and query software that could transfer data into database or traceability repository. The third component is the traceability database to store the traceability data generated during the product handling operations. The fourth component is the website which service customer to gain the product information by using a web browser or a mobile application (Parreno-Marchante et al. 2013). For shrimp traceability system development, the architecture was adopted as shown on Figure 2.
Aquatic products have characteristic in complexity and the coexistence of large and small and high-value and low-value products. In China, a traceability system was constructed using an anti-counterfeit code for aquatic product identification. To participate in a traceability system platform, enterprises are required to use a unified anti-counterfeit code encoding method and a product label to identify their products and to ensure the benefit and brand of these enterprise members (Sun et al. 2014).
Figure 2 An architecture of the traceability system in fisheries product (Adopted from Parreno-Marchante et al. 2013)
The largest value contribution of exports Indonesian fishery products are from shrimp and from group of fish tuna, little tuna and skipjack (KKP 2013). Therefore, it is important to implement a traceability system on shrimp commodity to achieve greater sales value of shrimp.
The uniqueness unit of a product that identified at the supply chain is called traceable unit. For example, at fisheries supply chain, boat and cage could used to define traceable unit, meanwhile in fish feed, big sack and silo usually used to define the granularity of traceable unit. Aquatic production batch is also defined as the traceable unit that aquatic products was caught from the same pond with the same day. (Karlsen et al. 2011). The term of traceable unit also refer to size or lot that could be physically and individually identified and that provides the true basis of an effective system for managing emergencies and attributing responsibilities. The unique identifiers makes product possible to identified based on the units that have undergone a given production process so that they can be separated if any quality or food safety problems (Bennet 2006).
To evaluate traceability system performance, fish processing companies have to develop their own diagnostic instrument to help them assess their strengths and weaknesses, and also to attain higher control of food safety problems. The diagnostic instrument is composed of five main parts, they are (1) contextual factors,
Barcode scanner
Application data record form
Input data application
Query data application Database
Customer Barcode
(2) traceability system design, (3) traceability system execution, (4) traceability system requirements, and (5) traceability system performance, and food safety level.
Contextual factors is assumed as complexity of traceability system. There are, three indicators derived, they are (1) risk level of raw materials for safety, (2) degree of diversity of raw materials such as many species of fish, and (3) spoilage rate of raw materials. Traceability system design, related to several factors that compose traceability system such as, type of identification, mode of data registration, location of data storage, mode of information communication and the degree of data standardization. Meanwhile, system execution related to constant interaction between employees and management involve communication of traceability procedures and instructions to attain the accuracy of documentation process. For the last, the effectiveness of traceability system basically supported by determine the information that needs to trace. Thus, performance of the system can also be checked on the capability to provide information, the reliability, rapidity, and precision/accuracy of information.
Digital Business Ecosystem
Historical development of the concept of digital business ecosystem (DBE) driven by effort to provide favourable environment for SMEs Business and their networking. Individual businesses can not thrive alone, and must develop in clusters or economic ecosystems. Thus, the integrated approach for introducing DBE stressed to the creation of an environment, a business ecosystem, and the need for IT skills.
DBE constructed by adding digital term in front of business ecosystem term, which means interaction between business actors in digital environment. Decomposition of meaning in each term, is as follows:
- Digital: the technical infrastructure, based on software technology that could connect several digital devices directly. This infrastructure could transports, finds, and connects services and information over Internet links enabling networked transactions, and distribution of all digital material within the infrastructure. In other meaning, the infrastructure is an organism of digital world
- Business: An economic community that enabling organizations and individuals interact each other, in order to produces goods and services of value to customers, who themselves are members of the ecosystem. Organization or individual is an organism of business world.
- Ecosystem: a biological metaphor that depict the interdependence of all actors in the business environment, who mutual develop their capabilities and roles.
Digital ecosystem is a digital environment that consists of digital species (DS) which is analogous to biological species and usually form communities.The majority of DS consist of hardware together with its associated software. The hardware is analogous to the body of biological species whereas the software is analogous to the life of biological species. In nature, a body without life is dead. Similarly, hardware without any application running on it is useless (Hadzic et al. 2007; Hadzic and Dillon 2008).
The concept of DE has been developed specifically for the health domain which called DHES (digital health ecosystem). In a DHES, such information may be a personalized medical record, money transactions between patient and chemist when purchasing prescribed medication, which is transported within the DHES for various reasons (Hadzic and Dillon 2008). Every members in DHES could interact each other using digital health species (DES). Besides, DE also applied in form of medical records digital ecosystem (MRDES) that enables efficient use of medical records for the purpose of correct patient identification, diagnosis, appointments scheduling and the like, in everyday life as well as in emergencysituations. Medical records digital environment (MRDE) is populated by interconnected medical records digital components (MRDC) (Hadzic et al. 2007). Meanwhile, DBE has a big potentiality in helping SMEs to connect with potential customers both in business-to-business transaction and in business-to-customers transaction (Leon 2007). Based on the great function in several practices, DBE concept have to establishes by using digital divice as a digital species that would perform the role of business actor.
Digital business ecosystem reveals the opportunities to enhance the productivity and efficiency of each business services (Pranata and Skinner 2009). The following services are needed in DBE such as, payment, business contract and negotoations, information carriers, billing, trust, reputation and legal compatibility (Ferronato 2007). Methodology for the design of DBE that consists of the following five steps, they are (1) identify several types of digital species (DS) based on their roles, (2) develop intelligent capability of DS, (3) define DS collaborations, (4) enable, improve and/or construct individual DS and the last is (5) protect the DBE by implementing security requirements (Hadzic and Dillon 2008). Along with the advancement of DE technology, security has emerged as a vital element in protecting the resources and information for the interacting DE member entities in particular (Pranata and Skinner 2009).
System Analysis and Design
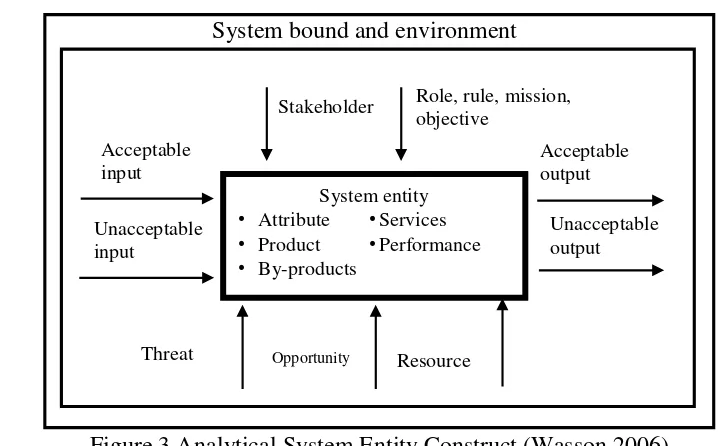
A system entities are described symbolically using a rectangular box as shown in Figure 3. As an abstraction system composed by inputs that are fed into a system then processed into an output. For more detail, system entities include desirable/undesirable inputs, stakeholders, and desirable/undesirable outputs, roles, resources and control. For more detail, system entities include desirable/undesirable inputs, stakeholders, and desirable/undesirable outputs, roles, resources and control. The objective of system analysis and design is seek to know the detail of user requirement by analyze data input or data flow systematically, process or transform data, store data, and output information in the context of a particular organization or enterprise. By doing through analysis, system analysts seek to identify and solve the right problems. Furthermore, systems analysis and design is used to analyze, design, and implement improvements in the support of users and the functioning of businesses that can be accomplished through the use of computerized information systems.
Figure 3 Analytical System Entity Construct (Wasson 2006)
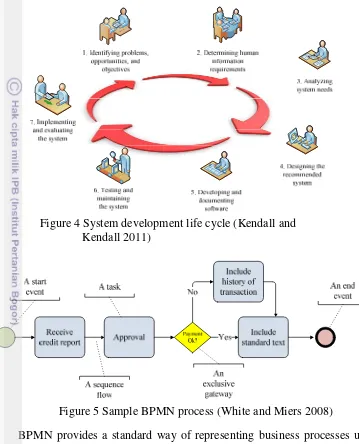
The systematic approach take to the analysis and design of information systems is embodied in what is called the systems development life cycle (SDLC). The SDLC is a phased approach to analysis and design that holds that systems are best developed through the use of a specific cycle of analyst and user activities. There are several opinions about the stages contained in SDLC. However, analysts generally agreed about organized approach which divided the cycle into seven phases, as shown in Figure 4. Although each phase is presented discretely, it is never accomplished as a separate stages. Several activities could occur simultaneously, and activities may be repeated (Kendall and Kendall 2011).
Requirement analysis on SDLC perform by using several tools method. BPMN is graphical notation to depict the sequence of process in business activities that collaborating and interacting to achieve a goal. Business process modeling constructed to aid a communication with work colleagues inside the organization, helping them form a shared understanding. Besides, BPMN also used to drive the way in which work happens in the modern organization and carry the instructions for how work should happen, who should do it, escalation conditions if it is not
System entity
• Attribute
• Product
• By-products
•Services
•Performance Acceptable
input
Unacceptable input
Stakeholder Role, rule, mission, objective
Acceptable output
Unacceptable output
done in time, links to other systems etc. BPMN uses a set of specialized graphical elements to depict a process and how it is performed, as shown on Figure 5.
Figure 4 System development life cycle (Kendall and Kendall 2011)
Figure 5 Sample BPMN process (White and Miers 2008)
Table 1 Notation used in developing the BPMN (White and Miers 2008)
No Notation Function
1 Start Event-Representing the place where a Process
can begin. There are different types of Start Events according to the actual condition.
2 Task/ Activities. Representing the steps of working
activity in a business process. This notation is usually require some type of input, and will usually produce some sort of output.
3 Gateway. Showing about how the Process diverges or
converges. This notation separates or connects a process through sequence flow.
4 Connectors. Connecting two objects on diagram of
BPMN. Several types of connectors are sequence flow
which shows the order of object flow in a process of activity, gateway, or event. Then, the message flow
which shows the communication flow between two participants or system entity, and association which is used to connect an object with artifact (data or
information source).
5 End event. Showing that a process or part of a process
is stated finish. Just like start Event, there are several types of notations of End Event which shows the differences of the categories as the result of a process.
6 Artifacts (data object). Used to illustrate mechanism
to capture of additional information from a process through flow-chart structure. This information has no direct effect to the characteristic of a process. In the development of BPMN, the type of data object is commonly used.
Performance of the system can also be checked on its capability, reliability, rapidity, and precision/accuracy. Capability is the ability of retrieving the information required without any error and maybe determined by the reliability of thetools, procedures, and information sources used. Rapidity refers to speed of responding to information requests regarding the trade items. Rapidity may be determined by the information management, tools used, and their automation as well as the level of cooperation between the supply chain partners. Precision/accuracy is the ability to pinpoint a particular food product’s movement. Precision/accuracy maybe determined by consistence of batch sizes used in the supply chain (EAN.UCC 2003).
requirements specifications and there is no need to examining the code in black box testing. This is purely done based on customers view point only tester knows the set of inputs and predictable outputs, meanwhile white box is a test the internal functioning of the software from the developer’s perspective, white box testing mainly focus on internal logic and structure of the code. White-box is done when the programmer has techniques full knowledge on the program structure (Nidhra and Dondeti 2012).
Data Mining and Soft Computing
Data mining is the process of discovering interesting patterns and knowledge from enormous amounts of data that collected from several source. The data sources can include databases, data warehouses, theWeb, other information repositories, or data that are streamed into the system dynamically. As a result of the natural evolution of information technology, data mining process consist of several tools and technique that could use to bridging gap between data and valuable knowledge that embedded in the vast amount of data. As analogy by refer to the mining of gold from rocks or sand, we say gold mining instead of rock or sand mining. Thus, similar meaning to data mining for example, knowledge mining from data, knowledge extraction, data/pattern analysis, data archaeology, and data dredging.
To discover information from large amount of data we have to perform an iterative sequence steps. The first is data preprocessing, where data are prepared for mining, which is include (1) data cleaning (to remove noise and inconsistent data) and (2) data integration (where multiple data sources maybe combined), (3) data selection and (4) data transformation. The next steps is (5) the data mining step (an essential process where intelligent methods are applied to extract data patterns) followed with (6) pattern evaluation and (7) knowledge presentation (where visualization and knowledge representation techniques are used to present mined knowledge to users) (Han et al. 2003).
Data usualy structured as an n×d data matrix, with n rows that correspond to entities in the data set, and columns represent attributes or properties of interest. Data mining process using quantitative technique which is comprises algorithms that could use to discovering insights and knowledge from massive data. Several disciplines that influence the development of data mining methods are statistics, machine learning, pattern recognition, data base and data warehouse systems, information retrieval, visualization, algorithms, high performance computing, and many application domains (Zaki and Meira 2013).
Relief (relieable eliminated of feature)
Generally, a data set is a contents of attribute. Feature selection is the problem of choosing a small subset of features that ideally is necessary and sufficient to describe the largest concept. Feature selection is important to speed up learning and to improve concept quality. Relief Method is a reliable and practically efficient method to eliminate irrelevant features. Relief algorithm composed by training data S, sample size m, and a threshold of relevancy τ, Relief detects those features which are statistically relevant to the target concept.
of Relief is to iteratively estimate feature weights according to their ability to discriminate between neighboring patterns (Sun 2007).
Cosine Similarity
As part of the operationalization of several data mining algorithm, we need to compare data quantitatively to determine similarity and proximity of data characteristics. The distance measures data could use for computing the dissimilarity or similarity of objects described by numeric attributes. Thus, the purpose of data mining methods can be obtained such as clustering and classification data from thousands of data attributes. Cosine similarity is a measure of similarity that could use to compare documents or, say, give a ranking of documents with respect to a given vector of query words. The computation based on euclidean distance, which is conceptually it is the length of the vector (Kira and Rendell 1992).
Fuzzy Associative Memory
Working with uncertain data is the reason why FAMs have been used in many fields such as pattern recognition, control, estimation, inference, and prediction. FAM was use to measure of how much one fuzzy set is a subset of another fuzzy set, whose input patterns, output patterns, and/or connection weights are fuzzy-valued. The simplest FAM encodes the FAM rule or association (Ai, Bi),
which associates, the p-dimensional fuzzy set Bi with the n-dimensional fuzzy set
Ai. More general, a FAM system encodes a bank of compound FAM rules that
associate multiple output or consequent fuzzy sets B1,..., Bs with multiple input or antecedent fuzzy sets A1,...,Ar. We can treat compound FAM rules as compound linguistic conditionals. Neural and fuzzy systems estimate sampled functions and behave as associative memories, the computation process based on associative of example data. That means FAM learning the association from samples (Kosko 1990).
FAMs belong to the class of fuzzy neural networks, which combine fuzzy concepts and fuzzy inference rules with the architecture and learning of neural networks (Bui et al. 2015). For traceability case, FAM method is used to predict total handling time to cover several issue after customer complaint. FAM was used because, it could be generate more objective rule that acquire from data sample or data training. Thus, the knowledge and rule or relation between Fuzzy set of input and Fuzzy set output could be naturally, and in many cases easily obtained. FAM combine antecedent and consequent sets with logical conjunction, disjunction or negation that would interpret the association linguistically as the condition (Kosko 1990). The associative memory means that this method allow for storage of association of data and information and also the retrieval of the desired output data.
looking up customer account info, making notes and drafting responses (Wilson 2014). We would try to construct association of handling time in traceability system as development steps using Fuzzy Associative Memory.
PT Nusa Ayu Karamba
This research was conducted in a company called PT Nusa Ayu Karamba. The company was established in May 2001. Nusa Karamba Aquaculture Farm & Hatchery was established to begin breeding Grouper Fish in Pulau Seribu. Their Aquaculture is located in Gosong Pulau Pramuka between Pulau Pramuka, Pulau Panggang and Pulau Karya, Indonesia. They breed milkfish, Cod, Pompano, Golden Trevally, Tiger Grouper, Barramundi and also produce boneless milkfish.
The whole farm has grown to cover an area of 3,000 sq. metres of various facility buildings and floating cages. Although our current concentration is in producing Grouper seeds ready for the market, we also have fingerlings and Groupers of various sizes. Their original Broodstock came from the wild of Makassar, Surabaya, Bali and Pulau Seribu.
The company have successfully bred the Panther and Tiger Groupers. They have accumulated 50 Panther and 40 Tiger Grouper Broodstock at this moment. Besides the Grouper Aquaculture venture, they would like to build further facilities that would support Marine Tourism especially Educational Marine Tours and Research purposes for Scientists and Students in the field of Fisheries and Biology. (Anonim 2015).
3
METHODOLOGY
Framework
Mainly, traceability system consisted of two large components of system. First, the system of data documenting at every traceable unit and product information tracing from customers. System designing followed the mechanism of system development life cycle (SDLC) (Kendall and Kendall 2011), which included requirement analysis, design and development, testing and evaluation. Business process model in documentation system was developed as the step of requirement analysis to identified stakeholders’ roles and the rule that traced the system to reach the aim of product data documenting. This interaction developed the first layer of digital business ecosystem.
Figure 6 The framework of traceability system for frozen shrimp product
Business Process Analysis
the business process stages in detail and completely in the digital traceability system. A business process model is generally developed as the basis of discussion among stakeholders that can support the process of communication and understanding by visualizing the whole operational activity and some improvement steps (White and Miers 2008). The output of this analysis are stakeholders identification, roles of each stakeholders, rules in business process, data flow, and more which can support a business activity. BPMN in this research was developed using PowerDesigner® version 16.1. Notations in this BPMN were developed in “swimlane” which used to help in making a separator in managing the activity of BPMN diagram, by combining some notations. The main elements of a BPMN process are the "flow objects", such as (1) activities, (2) events, (3) gateways and (4) sequence flow (Derreck and Miers 2013).
Identification of System Component
System component was identified by observation, in-depth interview, and questionnaire. The first method was done by observing the production process from upstream to downstream. The existing business process be obtained by observe and interviewing the management and technical staff of the companies. Observations focused on identification of business process and system components that could use to compose traceability system which includes the roles and interactions between units, resource, rules, and data flow of information and documents that are currently used in units of raw material handling and fish production units. In-depth interview aimed to collect the more detail information about the business process in producing frozen Vanname shrimps and technical matters by stakeholders. Distribution of questionnaire was done in collecting data attribute and range data value from some parameters of Vanname shrimps. After all information and data were collected completely, the next step was system requirement analysis using the requirement matrix.
Determine Critical Attribute
The determination of input data from stakeholders was done by using questionnaire. Data was taken by using form TU1 in Appendix 1. Factor analysis was done to identify the most important data in traceability. It was the basis for source code application setting, that the documenting couldn’t be done further before the most important data had been documented. The analyzing was done by Relief algorithm (reliable eliminated of feature) with measuring the value of weight attribute (wi). Relief algorithm chose the attributes based on average weight of each
attribute according to the threshold
τ
. Relief used p-dimensional Euclid Distance. In this algorithm, first, defines ith feature as fi where F = {f1, f2,..., fk} wherefk € F, the weight of the ith feature as w
fi where W = {wf1, wf2,…,wfk} where wfk € W, an instance value of fi definesas xi where X = {x1, x2,…,xk} where xk € X. The
iteration runs using pairwise between data instance xi and the neighbor yj. Then in
each iteration (t = 1, 2,…, T), if the neighbor is the same class termed the nearest hit (hi) where NH = {h1, h2,…, hk} where hk € NH and the other, if the neighbor is
different class termed the nearest miss (mi) where NM = {m1, m2,…, mk} where mk
€ NM. For each iteration, the feature weight wfi is then updated as follows
( 1) 1 1 ( , ) ( 1) n n t j t j t
i
diff x y
w n − = = + = −
∑ ∑
The differences of feature values between two instances xi and yi (hi or mi) are
defined by following function diff (Kira and Rendell 1992):
| |
+ (if and are different class) ( , )
| |
(if and are the same)
t j t j i i t j t j t j i i x y x y max min
diff x y
x y x y max min − − = − − − Where:
wi = Weight of attributes-i
xt =instance of attribute-t (t= 1,2,3…n)
yj = neighbor of attribute-j (j=2,3,4…n)
maxi = maximum value of attribute-i
mini = minimum value of attribute-i
Design Traceability Information System
System design process focused to providing component for acquiring, processing, organizing and maintaining information generated on each stakeholder. Several programming techniques required for development capturing and acquiring system of data and information, for instance JAVA, XML and web site development-based programming (Gunasekaran dan Ngai 2004). Therefore in this research we software developed by JAVA programming language. NetBeans 7.3.1 used as integrated development environment (IDE) to implement the source codes. Design information database system can adopt Sybase, Oracle, FoxPro, Access, SQL server and other large database systems (Lei dan Wen-li 2012). In this research, SQL Server is used. Traceability system is divided into two major parts, they are capturing data and tracing data.
Capturing Data
The entire data attribute was documented during the activity of handling process in the data application form on each stakeholder. Every stakeholder carried out the same process namely data input process into desktop computers to be stored in a server. Software application for capture data designed by adding several service to inputting relevant shrimp data in the database system. Both batch quality and batch activity data corresponding to a shrimp batch must be inputted. Digital traceability system that developed in the European Union relied on barcodes to identify for traceable units and XML for internet-based transfer of data between operators (McMeekin et al. 2006). Therefore, the software would develop by including capability to generate a barcode label and then printed it. The printed barcode in label became the key for product registration handled by using hand held barcode scanner to icquiring information on previous traceable unit.
(1)
Tracing Data
A database for this traceability information system was constructed for data query using several computation model follow as tracing process manually, such as sorting and searching, then arrange as source code software by using java programming. A relational database management system is used to perform tracing processes.
System Computation
Generally, the traceability system is focused on component modeling for the process of collecting information and information retrieval. However, some computation functions are needed for some goals. In order to ensure that processing practices comply with the food safety regulations, the supply chain actor must be able to show that the processing conditions used to manufacture a product (temperature, environmental condition etc) are in compliance with the food safety regulations (Thakur and Hurburgh 2009). Thus, in this research, the function of system computation was used to determine the level of data similarity from the documentation, which was searched by defined standard data in database.
Data similarity measurement was done by using the data mining technique with the method of Cosine Similarity, which was measured by the formulation below (Han et al. 2006):
(
1, 2)
1. 2 || 1|||| 2||sim X X = X Xt X X
Where X1 and X2 is two vectors for comparison. X1 is used as variable for
data which is collected from field measurement, meanwhile X2 is variable for
standard data value that defined by the company. Notation ||X|| is Euclidean norm of vector X = (x1, x2, x3….xp) which defined as:
(
)
12 2 2 2 2
1 2 3 p
||X = || x +x +x + ... +x
Where:
x1, x2,…xp= Element of vector X
p = Number of elements.
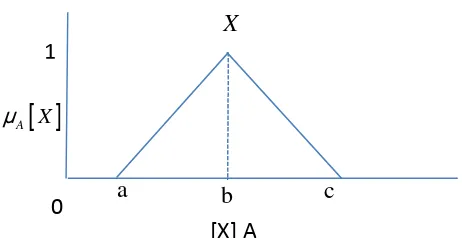
In the other hand, as the initial respond to finish the correcting process on searched products, the measurement of total handling time was used to provide initial information about time needed in solving the actual problem when there was any complaint from the customers. In this research, handling time was defined as time needed to do some activities after the process of data tracing from complained products by customers. Determination of total handling time was formulated using the Fuzzy Associative Memory (FAM) which mapped and predicted the total handling time if there was any variable change. Before defining the handling time computation capability in the source code, FAM was formulated using variables that affect the handling time. The set of variables is partitioned into three linguistic scale (Choudhury et al. 2002) using triangular fuzzy set membership function as shown on Figure 7.
(3) (3)
Figure 7 Triangular membership function of Fuzzy set X
for variable A
The membership value computed as follow:
[ ]
( ) / (0 ) ;; ( ) / ( ) ;A
x a or x c
X x a b - a a x b
c x b - c b x c
µ ≤ ≥ = − ≤ ≤ − ≤ ≤ Where:
= Membership function of an item value x on Fuzzy set X at variable A a, b, c = a, b, c are parameters of membership function curve and b is midpoint. The value of the membership function formed into elements of the matrix FAM, whereby the input variable set as matrix A and output variable set as matrix B. the association between matrix A and B defined on FAM rules. Matrix A and B encoded using Correlation minimum encoding scheme, then resulting matrix memory (M) as the correlation matrix FAM (Kosko 1990), which compute as follows:
T =
M A oB with mij =min( ,a bi j)
The computation for handling time then defined on source code to obtain the output value B using the relation composition of A and M. The output value encoded using max-min composition relation which computed as follows:
=
B A Mo with
1
max min( , )
j i ij
i n
b a m
≤ ≤
=
Where:
M = Matrix memory
A = Vector input Fuzzy set A B = Vector output Fuzzy set B
mij = As component M at row-i and coloum-j ai = As component A at row-i
bj = As component B at coloum-j
The result of matrix operation could computed using the Fuzzy centroid defuzzification scheme, which compute using this equation:
1 1 [ ] * [ ] p
j B j j p B j j y y B y µ µ = = ⋅ =
∑
∑
X0 a b c
Where:
B* = Single output Fuzzy [ ]
B yj
µ = Membership value of Fuzzy set yj for output (B) variable
yj = Value in the output universe
p = Number of output element
Verification and validation
The agreement of requirements and system verification documented as a requirements verification matrix (RVM) (Wasson 2006). Inspection method was chosen to proven whether the logic of the model in each stakeholders is implemented correctly or not. The system is checked during design and develop phase and when finished. Verification stages perform in also to check the completeness and correctness of logical function implementation through several actions as follows:
1. Testing, inspection, analysis of system mission and analysis system specification (Meyer et al 2007), by using white box testing.
2. Based on RVM we define statement and question to perform general checklist. 3. To verification that data and information could collect and retrieve, several
devices has provided for test method, such as barcode scanner and barcode printer, to prove automatically input and generating report.
Validation has performed using user interview method and simulation test to ensure that system design comply requirements and satisfies the user needs. The validation has to confirm that the simulation system or model corresponds to the reality. This means that the investigated aspect has to be simulated realistically, and the results have to be comparable to the real user espectation. Validation stages, perform by conduct several steps (Meyer et al. 2007), based on black box testing as follows:
1. Checking simulation and investigate system behavior.
2. Documenting output of the investigation in order to testing, recognize and eliminate error in several part, such as:
- In the software program it self ; - In the program run ;
- In the user interface, and
- In the original real world system
3. Evaluate and comparing to the real-world system are taken concerning the goal of the project.
4
RESULTS AND DISCUSSIONS
Identification of Existing Business Process
Field Observation
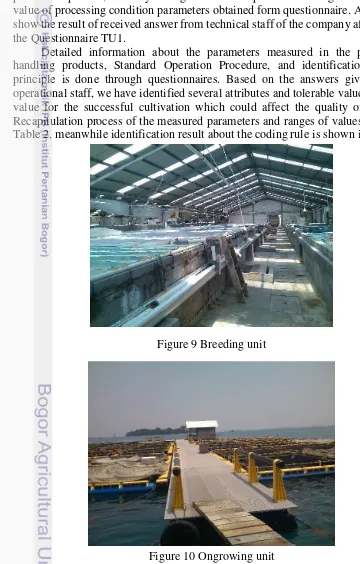
Field observations performed several times at the company during which all stages of production were carried out from upstream to downstream. Based on observation and interview process, the basic business processes for handling fisheries product are generally divided into 4 diferent location such as breeding unit, ongrowing farm units, processing units and sales unit as shown in Figure 8. The activities that take place at breeding unit are divided into three subprocesses. The process begins by choosing broodstocks to produce seeds, followed by hatching then transferred into the seed ponds for rearing the seeds until larvae are ready to be harvested and could brought up in ongrowing ponds. The breeding units can be seen in Figure 9.
The larvae transferred to ongrowing unit that can be seen on Figure 10. Larvae reared to the standard of weight and size to be harvested. On the harvesting time, fish harvested and stored at the countainer filled with sea water and ice, then transferred to the processing unit. There are three subprocesses in this unit, fish is received then processed by cleaning, sorting by size, freeze and packing in plastic packaging using vacuum sealer and the last labeling the packaging. After that, the product transferred to the sales unit then perform stock control to meet the purchase orders at their store unit or distributed to retailer.
Figure 8 Current business process and provision of information at the company (Adopted from Parenno-Marchante et al. 2014)
Data Identification
filling the information board which is also containing standard operation procedure and hygiene procedure. They also measuring processing condition such as pH, temperature and water salinity. The staff just entered the data into paper logs that stored by the administrator of the company. Although the company has perform data and information collection, it is not intended to support the product tracing process because the datas just used as a report of the production process and have not been integrated. The company has marked the ponds code that used during the production process, but not yet integrated with the product handling data. The range value of processing condition parameters obtained form questionnaire. Appendix 1 show the result of received answer from technical staff of the company after fill out the Questionnaire TU1.
Detailed information about the parameters measured in the process of handling products, Standard Operation Procedure, and identification number principle is done through questionnaires. Based on the answers given by the operational staff, we have identified several attributes and tolerable value as a limit value for the successful cultivation which could affect the quality of the fish. Recapitulation process of the measured parameters and ranges of values shown in Table 2, meanwhile identification result about the coding rule is shown in Table 3.
[image:36.595.72.432.192.756.2]Figure 9 Breeding unit
Table 2 Data identification and range of value processing parameters
No Supply Chain unit
Data attribute Temperature
(°C) pH
Salinity (ppt)
DO (ppm) 1 Breeding
seed production 29-33 7.5-8.5 32-33 5-7 seed harvesting 19-22 7.5-8.5 28-31 9-12
2 Ongrowing 7.5-8.5
rearing 29-32 7.5-8.5 25-33 4,7-7
harvesting 19-22 7.5-8.5 29-33 9-12
3 Processing 15-18 7.5-8.5 28-31 9-12
4 Cold storage NA NA NA NA
5 Retailer NA NA NA NA
DO = dissolve oxygen; NA= not available
Table 3 Coding required and existing coding system No Supply Chain
unit
Code required Coding system
Coding format
1 Breeding Seed ID No NA
Seed Pond ID Yes 1,2,3 etc Feed Supplier ID Yes N, PL
2 ongrowing Rearing Pond ID Yes Letter with figure Feed Supplier ID Yes Based on size
Batch ID No NA
3 Processing Packaging ID Yes Type, size, date 4 Cold storage Cold storage ID No NA
5 Retailer Retailer ID No NA
NA= not available
Requirement Analysis
Business Process Analysis
The existing business process of the company, found from field observation. Based on result of current business process analysis we create a new business process model that would made digital traceability system worked properly. Business process in traceability system is modeled in BPMN 2.0. The Development of BPMN is conducted. It is started from the making of simple flow chart, granting information related roles, process, data and information to description, therefore it can be analyzed and simulated. System analysis is conducted for parse a system be resolved into components so it the interaction between components and its environment can be seen. Results of analysis showed the capacity of the system as seen from its ability to add value from input to output. System has divided into four structure systems:
1. Input of traceability system
with various identity components that support the formation of these products. Meanwhile, the data related to the process cover some of the indicators of the process that are set up on the stage of the seed production. Among them are pH of water, water salinity, survival rate, and temperature of water. The data related to the quality of the standard value according to SNI are the total plate count (TPC), the levels of lead, the levels of histamine and others. This system, however, is not documenting related data quality due to lack of infrastructure system.
2. Pre-process on collecting data
The results of identification of the data attribute are then observed and documented in the application form for a period of time during material handling process.
3. Collecting data process
The main processes include documentation of process traceability system using an application data input of each stakeholder and tracing product process from end user stakeholder. Every stakeholder performs the process of documentation into application data input that was installed in the desktop computer on each unit of stakeholder.
As an example, in the breeding unit, the data attribute among others were seeds ID, pond ID, provided feed mill supplier, pond water temperature, pH, water salinity etc (Table 4). After login into software application, users should inputting seed ID data, choose a pond ID, feed supplier ID and all of measured data during handling process. Another stakeholder would perform the same stages after handling process finished. The process is then continued by printing the report in the form of label contains barcode ID and and destination unit as product identification for the next handling process. The barcodes on the labels function as product identification that can be read using barcode scanner. Readable barcode labels subsequently can be added to the data on the next process. The barcode is printed back and imprinted on the next product label. A fragment on business process for barcode generate shown on Figure 11. For tracing purposes, it is essential to know the relationship between ingoing and outgoing idents of a relation type, in example knowing which shrimp batch or pond ID is inside a box of shrimp product (Hulzebos and Koenderink 2006). Business process for another stakeholder can be seen on Appendix 12-15. Table 4 Seed data documentation result on breeding farm
Seed ID Number of seed
Pond ID Feed supplier ID
Date of input data
Pond tempera
ture (°C)
pH Sali-nity (ppt)
Date of hatch
B191020143 1540000 S00001 S00003 25/10/2014 29 7.8 32 26/10/2014
B211020144 1800000 S00003 S00003 28/10/2014 29 7.8 32 27/10/2014
B251020145 2000000 S00002 S00003 31/10/2014 29 7.8 32 30/10/2014
Seed ID: seed identification number; Pond ID: body of water identification number, Feed supplier ID: vendor that supply feed for cultivation process identification number.
4. Output of traceability system
The data set will store in the traceability repository include the relevant traceability data generated during the company operations (Parreno-Marchante
following typical several information for instance (1) component source and quality attribute, (2) recall list which contain all the needed information to contact affected customers and (3) suspect lots or unit process with nonstandard procedure.
Based on the analysis, traceability system must fulfill basic architecture of Input-Process-Output components as shown in Figure 12. Traceability based on DBE could be seen on Figure 13. Each actor in the traceability system is a model of organism in digital business ecosystem (DBE) which interact each other in data capture and tracing process (1st layer). Through the development of DBE, every technical phase in the process of documenting data can be conducted by using the support of ICT based infrastructure that is analogized as digital species in digital ecosystem. The technique of product search can also be represented in the form of formulation and logic of computer programming hence the digital application design is attained for the process of data documenting