ISSN: 2477-233X
I
!
II
\
\
\
\
\
'.
\
I
International
Symposiulll on Geoinfornlatics
20'15
December 3
rd2015, Brawijaya University
Malang East Java, Indonesia
MMWMMMMイセMMGt
.-.-_..- .
- - - '
ItA 1 » 4 . " 40(1!" セ ...⦅ セ
"
iᄃLNクLᄃセセセャᄃ
\..lInternational Symposium on Geoinformatics (ISyG)
2015
Brawijaya University, Malang, Indonesia
December 3
rd,2015
Published by:
Proceeding
International Symposium on Geoinformatics (ISyG) 2015
ISSN: 2477-233X
Chief Editor: Fatwa Ramdani
Chief of Managing Editor: Candra Dewi Managing Editor: Muhammad Tanzil Furqon
Managing Administration: Retno Indah Rokhmawati
Editor Team: Hanifah Muslimah Az-Zahra, Komang Candra Brata, Lutfi Fanani
Faculty of Computer Science f.k.a PTIIK Brawijaya University
JI.Veteran No.8 Malang, Indonesia - 65145
Ph. +62 341 - 577 911
-Table of Content
Welcome Message from General Chairs i
Welcome Message from Dean of Faculty of Computer Science Brawijaya University ii
Program at Glance iii
Table of Content v
Keynote Speech
Masayuki Tamura - Kyoto University 1
Invited Paper
Near-Real Time Meteorological Drought Monitoring and Early Warning System for Croplands in Asia
W. Takeuchi, S. Darmawan, R. Shofiyati, M. V. Khiem, K. S. 00, U. Pimple andS.Heng 11
Presented Paper
Climate Trends and Dynamic Change of Land Use Patterns in Krueng Peusangan Watershed, Aceh Indonesia
Ichwana, Ashfa Achmad, Susi Chairani
19
Comparison of Worldview-2 and Lidar Images for Mangrove Tree Crown Delineation Using Geographic Object-Based Image Analysis Approach
Muhammad Kamal,StuartPhinn, Kasper Johansen, Sanjiwana Arjasakusuma 26
Implementation of Dasymetric Method for Estimation of Dwelling Population Density
Raditia Isawisuda, Albertus Deliar, Riantini Virtriana 29
Prediction of Paddy Field Cropping Pattern Using Time Series Modis Image in East Java
Million Muhammad, Liyantono, Yudi Setiawan, Alvin Fatikhunnada 36
Precise Orientation Measurements of UAV Based Imagery Using Photogrammetric Methods
M. Edwin Tjahjadi 41
Least Cost Path Analysis to Promote An Ecological Connection for Gunung Merapi and Gunung Merbabu National Parks
Andhika Chandra Ariyanto.A. G. (Bert) Toxopeus, Hartono .46
ISYG20l5 ISSN: 2477-233X
PREDICTION OF PADDY FIELD CROPPING PATTERN USING
TrME SERIES MODIS IMAGE IN EAST JAVA
Million Muhammad*
(1),
LiyantoJ/o (I), Yudi Sefiml'an
(2),
Alvin 1'atikhunnada (2)
Faculty of Agricultural Technology and Engineering, Bogar AgIicultural University,
Bogar 16680, lndonesia( I)
Center for Environmental Research, Bogar Agricultural University,
Bogar 16680, Indonesia (2)
*
E-Mail: [email protected]
ABSTRACT
Land com'ersion of paddy field that continuously in East Jm'a I\'ill afTecting the production in the area of paddy field. Cropping intensity can supported the food safety. Mapping or distribution cropping pattcrn paddy field is necessarily important to obtain sustainability paddy field area. This research aimcd to prcdict the area ofー。、、セG field in East Jm'a Prol'ince using MODIS image product with EVI composite I(,-day resolution of 250 meters and show the distribution cropping pattern of paddy field. Growldcheck was conducted as actual I'alidation to know the cropping pattern in their location. The cropping area is 1,369,613 ha and han'ested area of paddy field is 1.310.307 ha.
Key wort/: MODIS, padd\' field, cropping pallern
I.INTRODUCTION
Adequacy of food needs can be done by ensuring the availability of agricultural land. The total population of East Jm'a as 37.476.757 people [41, and also further increase economic development in East Java is generally accompanied by a land conversion from agriculture to the others. When this occurs \I'ith high frequency and anlOtmt, it will threaten food security. Therefore it is necessary to predict the cropping pattern in agricultural land. especially paddy in relation to cropping intensity.
According to data ofl'illage potential in 2006 [5J , there arc significant transitions of land use conversion of paddy field from 2003-2006. Paddy field land use \Vas decreased and conl'erted into 5.665 ha (31.86%) of non-paddy land use. lL'167 ha (4R.16%) of residents. 1.204 ha (677%) of industrial building, (,93 ha (3.90%) of land for oOice or corporation building. and U,SI ha (9.29%) for other purpose. This transition of land use will afTect the rice production in East Java [I). while the inOuence of EI Nino
This contribution has been peer-reviewed
36
and La Nina conducled Liyantono et al2012 showed that El Niiio does not afTect agricultural production in Nganjuk, and the other hand La ina has an inOuence [6].
This study was conducted to determine the type of cropping pattern in East Java by usingk-mean algorithm in MATLAB soft\\·are. This is done to help determine the intensity of land use of agricultural land. especially paddy rice cult i"ation.
2. METHODOLOGY
2.I.Study Area
East ]m'a Province geographically located between 111 °0' - 114°4' Longitude and 7° 12'-8°48" Latitude. East Java Province is bordered between Central Java and Bali. It
has an area of 47,%3 km2which consist of two main part,
east java and Madura island 141- The regency is administratively divided into 29 Regencies and 9 cities.
2.2. Method of Prediction
2.2.1 Collecting Data
At this stage, the data are collected in the form of image MODIS data. Map administration of East Java Province obtained from the Geospatial Information Agency (BIG). Landuse East Java obtained from government of agricultural sub-section land databases. Distribution of paddy field area of East Java obtained from Statistical Center Agency (BPS).
The MODIS product used in this study is MOD l3Q I. It
comprises the Vegetation Indices (VI) Composite 16-day 250 m. which prol'ided the seasonal [or the paddy field patterns. This dataset had been systematically corrected for the efl'ects caused by gas and aerosol scattering. The EVI
ISYG 2015 ISS : 2477-233X
P.\JOD!S,NIR - P.\fOD.ls.R
EVI
=
GMMMセZZNZNZZNNZMMMMM]NNZNNNNZNNNZZNNNZNN]NZNMMMP.V!R
+
C1X P,\fOD!SR - C: X Pbl:;.o ...;... L M,lp .\,II,...J.ll ••lJll.:nl!avlt
Sbll
t
MODIS
uua"r;セオGュ ..
セQGQT
l.o\ll\lIh':
p•.,Id:-ldli
j'••\.St.':l\.1
Where G is a gain factor, Cland C: describes the use of the blue band in correction of the red band for atmospheric aerosol scattering and alsoLas coeflicient.
2.2.2. Handling and Analysis
16-day composite MODIS data for 14 years
(2000-2(14) collected to get EYI value. The \'a1ue then stacked
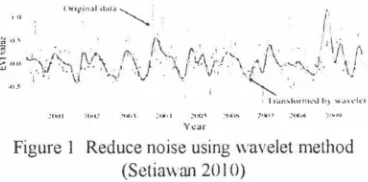
llild joined using MATLAB software regarding to East Java Province area. from this stad.ing result. cropping pattern can be determined as one pixel thoroughly which is actually sized 250 m Wavelet transform was used to reducing noise (filter). Figure I show the wavelet method to reduce noise on pattern.
Yo,:ar
FigureI Reduce noise using wavelet method (Setiawan 20 10)
QMNQNセQiNcZLィNャャャ E,'I
\'Jlllc
,"hl'I'III,l.II"I.lVCJI.I}' u,,,101,.·QNャキャオNセ ..p...ltry Ildl1
セ
Sutlll:lh ...IUull.t.tIJ•
+
セ- ,
I ャᄋィャGi」[uiBuセBL ャniセ , ,"'"'''''1''''''''''J
セ Mセ --,cセBᄋBLL
-'セ
IIl1.11IlLit.lll.'fl I [image:6.610.138.525.84.435.2]O'upfll'"luuclit j
+.. :
Figure 2. rIowchart methodology
4. RESULT AND DISCUSSION
4.t.Recognize Cl'opping pattem in East Java
[image:6.610.332.529.85.444.2]The process of recognizing patterns of rice plants using EYI value, as described in the methodology. Table I sho\\'s that the a"erage top EYI value for the pattern of one "ear with three cropping seasons and also the average age of the cropping pattern. There are three types of paddy cropping pattern that can be recognized with this method as sho\\ n in Table 1. In addition to cropping paddy pattern, other plants also detected four cropping pattern that cannot be defined. Table I. Recognize cropping pattern of paddY field
The pattern on this MODIS data analyzed usingk-meon
algorithm. At this stage, the object for clustering is a signal
that is formed based on the EYI with continuous temporal data Determination of the clusters number or value ofK is done using MATLAB software. Treatment of iterations performed to obtain class convergent. BPS data and ground check have been done to fulfill accuracy assessment.
Recognizing cropping pattern using temporal data from EYI value and the average age of cropring pattem. Normally paddy field have fourth month approximately for cultivation from preparation planting until harvesting.
Season 1 Season 2 Season 3 Season I Season 2 SeasonJ
8.09±0.604 G.95±O.7GG G.5G±ll.707 O.527±O.03X O.53C>±O.031 0.21 J:O.02-l 7.524±O.823 6.X86±O.G37 6.504±1l.7GX O.600±0.029 O.542±0.O35 OA60±O.02lJ
8.2I4±I.080 5.929±O.593 3.692±1.012 0.541±O.029 0.370±O.O26 0.251 ±O.O23
l8.36±0.622 0.54±0.019 18.57 0.548 IlU9 OA75 O.27l Cropping pattern Paddy-paddy-bare land Paddy-paddy-secondary crop Paddy-secondary crop-bare land Sugarcane
Mix and paddy in first season dominantly
Mix and annual crop dominantly
Mix and fishpond dominantly
Age EYI value
37
[image:6.610.92.276.320.411.2] [image:6.610.74.533.559.754.2]ISYG2015 lSSN: 2477-233X
Mix and housing dominantly 0.379
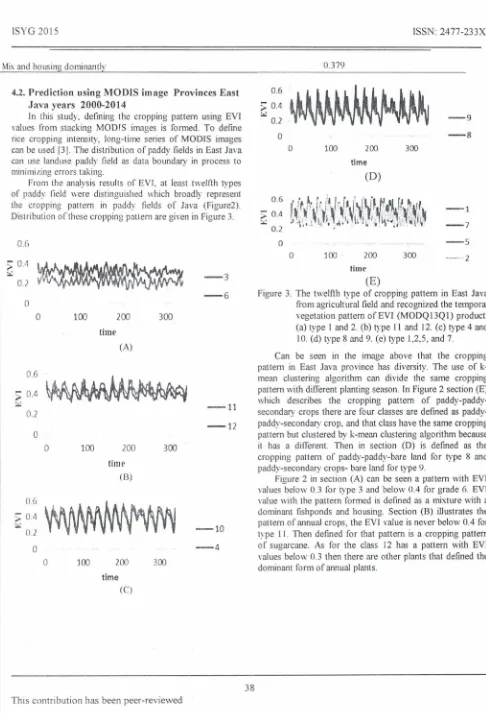
4.2. Prediction using MODIS image Provinces East Java years 2000-2014
In this study. defining the cropping pattern using EVI values from stacking MOorS images is formed. To define rice cropping intensity, long-time series of MODIS images
can be used 13]. The distribution of paddy fields in East Jaya
can use land use paddy field as data boundary in process to minimi;:ing errors taking.
From the analysis results of EVI. at least twelfih types of paddy field \\'ere distinguished which broadly represent the cropping pattem in paddy fields of Java (Figure2). Distribution of these cropping pattern are given in Figure 3.
- 9
- 8
- - 5
--·2 - - 1
- - 7
300 300 (D) 200 200 time time 100 100 .
o
o
0.6>
0.4 セ 0.2o
0.6 ;;: 0.4 ;.; 0.2 o (E)Figure 3. The twelfth type of cropping pattern in East Java from agricultural field and recognized the temporal vegetation pat1ern ofEVI (MOOQI3Ql) product. (a) type I and 2. (b) type II and 12. (c) type 4 and
10. (d) type 8 and 9. (e) type 1,2,5, and 7.
Can be seen in the image above that the cropping pattern in East Java province has diversity. The use of k-mean clustering algorithm can divide the same cropping pattern with different planting season. In Figure 2 section (E) which describes the cropping pattern of secondary crops there are four classes are defined as paddy-paddy-secondary crop, and that class have the same cropping pattern but clustered by k-mean clustering algorithm because it has a different. Then in section (D) is defined as the cropping pattern of paddy-paddy-bare land for type 8 and paddy-secondary crops- bare land for type 9.
Figure 2 in section (A) can be seen a pattern with EVI
values below 0.3 for type 3 and below 0.4 for grade 6. EVI
\'aluewith the pattern formed is defined as a mixture ""ith a
dominant fishponds and housing. Section (B) illustrates the pattern of annual crops, the EVI value is never below 0.4 for
type II. Then defined for that pattern is a cropping pattern
of sugarcane. As for the class 12 has a pattern with EVI
\'a1ues below 0.3 then there are other plants that defined the dominant form of annual plants.
- 3 - 6 300 time (A) 100 200
o
o
02 0.6 0.6 ;; 0.4セ - 1 1
0.2
- 1 2
0
0 100 200 300
timf.'
(8)
(l.6
;; 0.4
セ - 1 0
0.2
0 - - 4
0 100 200 300 time
Ie)
>
0.4セ
38
[image:7.602.43.529.65.778.2]ISYG 2015
Table 2. Summary of cropping pattern and value of prediction
ISSN: 2477-233X
Type Cropping Pattern Pixel Cropping
Area Harvested Area of Paddy Sugarcane Another Cropping
Paddy-paddy-secondary crop 13,655
2 Paddy-paddy-secondw)' crop (com 9,660
dominw1t1y)
3 mix and fishpond dominantly 4,550
4 mixand paddy in first season dominantly 32,191
5 Paddy-paddy-secondary crop (tobacco 17,886
dominantly)
6 mix and housing dominantly 13,469
7 Paddy-paddy-secondary crop 12,257
8 Paddy-paddy-bare IW1d 13,505
9 Paddy-secondary crop-bare land 11,949
10 mix and paddy in first season dominantly 31,583
II sugarcane 25,289
12 mix and annual crop dominantly 33,144
[image:8.597.59.523.166.506.2]Total 219,138 85,344 60,375 28,438 201,194 111,788 84,181 76,606 84,406 74,681 197,394 158,056 207,150 1.3(,9,613 170,688 120,750 201,194 223,576 153,212 168,812 74,681 197.394 1,3 10,307 158.056 I5l:!. 056 28,438 201,194 84,181 197,394 207,150 517,163
Table 2 was Sh0\\11 identity of every single type and also value of prediction. Cropping pattern of paddy field showed on type 1,2,5,7,8,and 9. Sugarcane on type II and mix vegetation in another type. This condition has been affected
because land convertion from paddy field to another
vegetation and also size of MODIS image have 250 m in one pixel. That size represent 6.25 ha in one pixel however within the area that represented on one pi.xel, there are not filled with only paddy field.
111at table also shown the total cropping area is 1,369,613 ha and total harvested area of paddy field is 1,310,307 ha. That approach value assest from pixel area in distribution cropping pattern of paddy field on East Java province. Sugarcane area predicted 158,056 ha [rom pattern and distribution that value.
Another cropping value are cropping pattern within mix vegetation that meW1 the cropping pattern cannot be defined currently. Because in one pixel there is have two or more vegetation and also for every EVI value vegelation is different.
Distribution cropping pattern in East Java can be shown
in Figure 3. That show eight cropping pattern with
distribution, each region has some cropping patterns, and also has a dominant cropping pattern.
39
This contribution has been peer-reviewed
Figure 3. Distribution of these cropping pattern in East Java
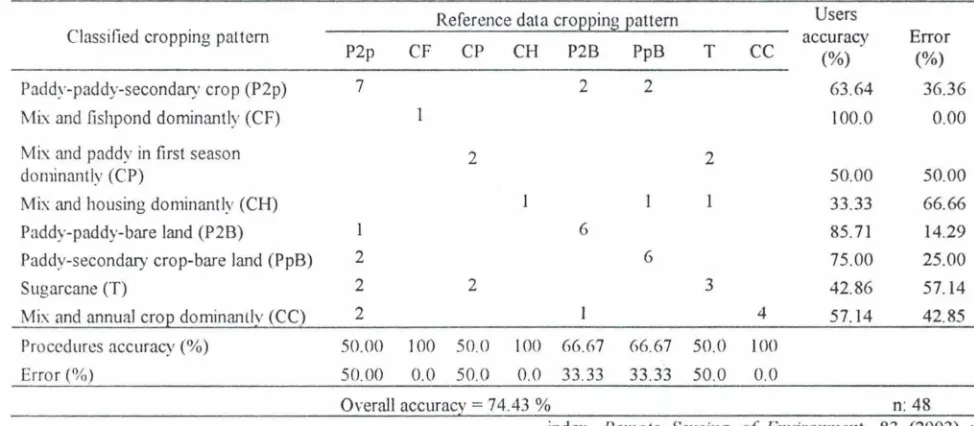
4.3. Accuracy assessment
The use of cropping pattern of paddy fields in East Java, which is obtained based on the EVI and the results of prediction are three main cropping pattern
paddy-paddy-secondary crop, paddy-paddy-bare land, and
paddy-secondary crop-bare land. Classifications of specific types were evaluated by 48 reference samples, which revealed the
overall accuracy to be 74.431%, that calculation can be
ISYG 2015
Table 3 Confusion matrix for cropping pattern of paddy field on East Java
ISSN: 2477-233X
Reference data cropping pattern Users
Classified cropping pattern accuracy Error
P2p CF CP CH P2B PpB T CC (%) (%)
Paddy-paddy-secondary crop (P2p) 7 2 2 63.64 36.36
Mix and fishpond dominantly (CF) 100.0 0.00
Mix and paddy in first season 2 2
dominantly (CP) 50.00 50.00
Mix and housing、ッュゥョ。ョエャセG (CH) 33.33 66.66
Paddy-paddy-bare land (P2B) I 6 85.71 14.29
Paddy-secondruy crop-bare land (PpB) 2 6 75.00 25.00
Sugarcane (T) 2 2 3 42.86 57.14
Mix and annual crop dominantlv
(cq
2 4 57.14 42.85 Procedures accuracy (%) 50.00 100 50.0 100 66.67 66.67 50.0 100Error (%) 50.00 0.0 50.0 00 33.33 33.33 50.0 0.0
Overall accuracy
=
74.43 % n: 48 Based on the results of the calculation are shown inTable 3 are the biggest error paddy-paddy-secondary crop with 36.36% error, secondary paddy crop-bare-Iand \vith a
25.00% error. paddy-paddy-bare land ||セエィ 14:29% error. Low accuracy results showed inability MODIS image to identify vegetation and also the value reaches 100% accuracy is a lack of samples in evaluating cropping patterns that exist in the field.
5. CONCLUTION
In this study, image satellite is used to recognize the cropping pattern in East Java province. Methods for prediction the cropping pattern in East Java successfully with predictable eight patterns are three main patterns secondar)' crop with accuracy 63.64%, paddy-paddy-bare land with accuracy 85.71 %, and paddy-secondruy crop-bare land with accuracy 75.00%. and the method to estimate cropping pattern area is 1,369.613 ha and harvested area of paddy field is 1.310,307 ha
6.REFERENCES
[11 Hidayat 81. 2008. Analisis Konl'ersi Lalmn Sawah di Prol'insi lawa Timur (ID)..!llrnal SEP. Vol. 2 No.3. Hal-l8-58.
\21
Huete AR, Didan K, Miura T. RodrIquez EP, Gao X, Ferreira LG. 2002. Oren'iew of the radiometric and biophysical performance of the MODIS vegetationThis contributionhasbeen peer-reviewed
40
index. Remote Sensing of l'.:nvironment. 83 (2003) 195-213.
13
JSetiawan Y, Rustiadi E, Yushino K, Liyantono, Effendi H. (20 (4) Assessing the Seasonal Dynamics of the Java's Paddy Field Using MODIS Satellite Images.ISPRS International JOllrnal of Geo-Information. 3
(2014): 110-129. doi: 1O.33901ijgi301 01 10. 141 www.jalim.bps.go.id
[5] Hidayat S1. 2008. Analisis Konversi Lahan Sawah di Provinsi Jawa Timur.J-SE? 2 (2008): 48-58.
[61 Liyantono, Kato T, Yoshida K, Kuroda H. 2012. The influence of El Nino southern oscillation on agricultural production sustainability in tropical monsoon region: case study in nganjuk district, east jawa, Indonesia.
Journal of Development in Sustainable agriculture. 7