ISPRS International Journal of
Geo-Information
ISSN 2220-9964 www.mdpi.com/journal/ijgi/ Article
Assessing the Seasonal Dynamics of the Java’s Paddy Field
Using MODIS Satellite Images
Yudi Setiawan 1,*, Ernan Rustiadi 2, Kunihiko Yoshino 3, Liyantono 4 and Hefni Effendi 1
1
Center for Environmental Research, Bogor Agricultural University, Kampus IPB Darmaga, Bogor 16680, Indonesia; E-Mail: [email protected]
2
Faculty of Agriculture, Bogor Agricultural University, Kampus IPB Darmaga, Bogor 16680, Indonesia; E-Mail: [email protected]
3
Faculty of Engineering, Information and Systems, University of Tsukuba, Tennoudai 1-1-1, Tsukuba, Ibaraki 305-8573, Japan; E-Mail: [email protected]
4
Faculty of Agricultural Technology and Engineering, Bogor Agricultural University, Kampus IPB Darmaga, Bogor 16680, Indonesia; E-Mail: [email protected]
* Author to whom correspondence should be addressed; E-Mail: [email protected]; Tel.: +62-251-8621-262; Fax: +62-251-8622-134.
Received: 10 December 2013; in revised form: 20 January 2014 / Accepted: 22 January 2014 / Published: 27 January 2014
1. Introduction
Information on agricultural land use over wide areas is essential to support sustainable agriculture and a food security program. As population growth drives demand for food, accordingly, at least agricultural production must be increased following the rate of population growth; otherwise, there is a need to import food to fulfill those demands [1,2]. Rice consumption per capita of Indonesia is the highest in the world, at 139 kg per person [2]. The Indonesian government also estimates that its people rely on rice for roughly 40%–50% of their daily protein and caloric requirements, respectively [3]. For Indonesia’s population of more than 237 million people, the status of its domestic rice supply is synonymous with its food security [1].
Understanding the potential production of paddy fields accurately including its future trends is necessary to improve the effectiveness and efficiencies of the agricultural land development programs. Moreover, an updated and accurate database concerning the rice cropping intensity, including its dynamics changes, is essential. A new research on the land use paddy fields in Indonesia and the general relationships between environmental variability in water resources and crop production will improve to up-to-date information about the potential production of rice and to predict the effect of global climatic change on agricultural activity and ecosystems.
In tropical regions (e.g., Java, Indonesia), information related to some sequential cropping patterns exist in the paddy field, such as (a) paddy-secondary crops-barrenland; (b) paddy-paddy-barrenland; and (c) paddy-paddy-secondary crops, where the sequences are repeated, year after year, following the seasons [4]. Therefore, characterization of seasonal vegetation dynamics due to monitoring its seasonal changes continuously would provide sufficient information of the specific use in the paddy fields, including the rice cropping intensity.
Remote sensing technology seems to be a powerful tool to produce land-use land cover maps and to identify on-going change processes, and their locations, either in a global or regional scale [5]. However, the main challenge on this technology is to ensure that a change is not a result of short-term variations in land cover [6]. Recently, most of available database of paddy field in Java were determined by remote sensing data through applying single-date satellite imagery and/or aerial-photographs, which was necessarily coincident with temporarily cover types, either barren land or inundated (water). Then, accuracy assessment of their results indicates the need to evaluate such conventional approach.
This study will investigate the seasonal vegetation dynamics of long-term paddy field, considering climatic variability in Java. The characterization of paddy fields in this study is based on available imagery, which is not necessarily coincident with temporarily barrenland when employing a single-date image, as we consider variability in temporal vegetation dynamics of paddy field. The characterization of temporal vegetation dynamics due to monitoring its seasonal changes continuously would provide sufficient information of paddy field, including cropping intensity. Therefore, a distribution map of the specific use in paddy fields as single cropping, double cropping, and triple cropping systems will be provided. Then, we will analyze the dynamics change of these cropping systems. Moreover, through this pattern analysis, disturbance events on rice-crop growth, either by natural processes (e.g., drought event) or land conversion, could be recognized.
2. Methodology 2.1. Study Site
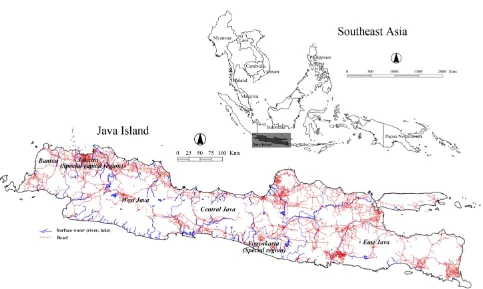
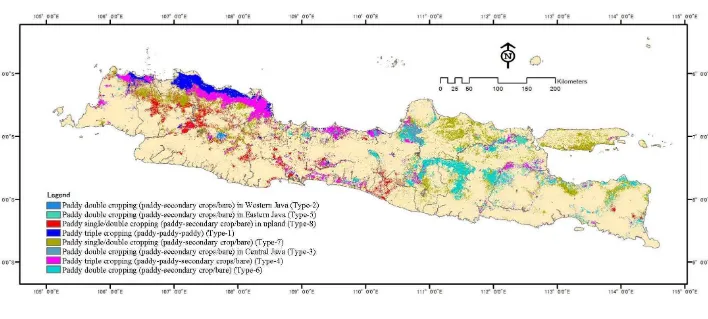
The island of Java, which is located on the southern rim of the Indonesian archipelago is a unique island due to its high population density and its highly productive intensive agricultural system [12]. The island has an area of 132,792 km2 and is administratively divided into six provinces, namely Banten, Jakarta, West Java, Central Java, Yogyakarta, and East Java (Figure 1). In addition, recently,
the agricultural land of Java provides food for about 60% of Indonesia’s population [2]. Figure 1. The study site.
about 70.62% of Java is considered to be agricultural land use; paddy fields, mixed gardens, uplands/dry lands, open grass, fishponds, and plantations, with as much as 5.43% of the area covered by settlements.
2.2. Data Satellite and Image Pre-Processing
The MODIS product used in this study is MOD13Q1 [13]. It comprises the Vegetation Indices (VI) Composite 16-day Global 250 m SIN Grid V005, which provided the seasonal dynamic for the paddy field patterns. This dataset had been systematically corrected for the effects of gas and aerosol scattering. We used MODIS EVI datasets, which are embedded in MOD13Q1. The acquired datasets represented the period from January 2001 to December 2007 and obtained, at no cost, from the NASA Land Processes Distributed Active Archive Center [14]. The MODIS Land Discipline Group [15] developed the EVI for use with MODIS data using this equation:
(1) where, ρ*nir, ρ*red and ρ*blue are the remote sensing reflectances in the NIR, red, and blue, respectively.
L is a soil adjustment factor, and C1 and C2 describe the use of the blue band in correction of the
red band for atmospheric aerosol scattering. The coefficients, C1, C2, and L, are empirically determined
as 6.0, 7.5, and 1.0, respectively. G is a gain factor set to 2.5 [16].
Nevertheless, the time series of these data inevitably contain disturbances caused by residual noise when the atmospheric disturbance cannot be removed effectively by the MODIS VI algorithm. Consequently, noise reduction or fitting a model to observation data is necessary before phenological stages can be determined [17,18].
In this study, we used the MODIS EVI datasets, which were filtered by wavelet transforms, in order to reduce inevitable disturbances in the time-series datasets [4]. The wavelet transform decomposed signals in time-frequency space in order to identify and reduce the overall noise, as well as maintain useful information in the time series data. Furthermore, the wavelet transform gave the best time profile of EVI for the purpose of detecting phenology stages [17].
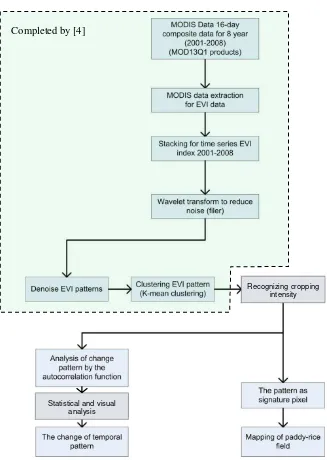
The image pre-processing was designed to provide a sufficient quality of multi-years MODIS images in order to evaluate a distinct temporal variation of paddy field seasonally. Figure 2 illustrates the flow of data handling and image analysis in this study.
To examine the details of the temporal pattern of the MODIS EVI, we used a finer spatial resolution Landsat 5 TM and 7 ETM+, as well as reference data derived from field survey points. The study area is covered by 14 scenes of Landsat images, collected from 2001 to 2007. The Landsat data acquired covers the land during two seasons, rainy and dry seasons. Moreover, field surveys were conducted to gather information during the rainy and dry seasons in 2012.
complicating factor of moderate spatial resolution imagery is that the intrinsic scale of spatial variation in many land covers is finer than the scale of sampling imposed by the image pixels. A previous classification of the land use land cover by [20], using Landsat ETM+, indicated the paddy field size of Java had an effective minimum map unit (MMU) of 2.4 ha and revealed that approximately only 20% of the MODIS pixels contained homogeneous cover types [4].
Figure 2. Flow of data handling and image analysis.
Extending the theme mentioned above, representative pixel samples were selected based on random sampling. Each location was overlaid with a 250 m fishnet corresponding to the pixels of the MODIS data, and then each cell was overlaid with the paddy field classified using Landsat data [20]. This procedure provided the ratio for the 30 m by 30 m paddy field contribution in a 250 m grid. In this study, 250 m grids with over 70% of paddy field area were taken to be homogeneous and used as pixel sample in the analysis of rice cropping intensity.
Recognizing cropping intensity Completed by [4]
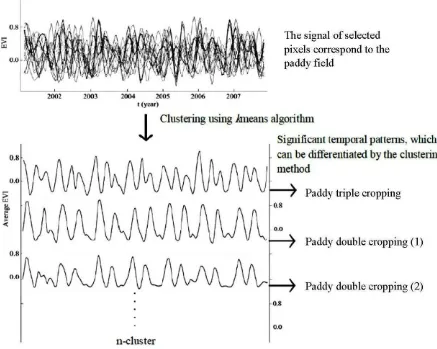
Distinguishing different temporal patterns in order to recognize rice-cropping intensity was accomplished using the k-means clustering method, based on Euclidean distance, in an EVI-space in which each EVI image provides one dimension of the cluster space, analogous to spectral clustering. Distinct clusters then represent different patterns of cropping intensity. These patterns were then used to discriminate among pixels in paddy field of Java.
The clustering method subdivides datasets into k clusters through an iterative process in order to optimize a criterion function [21]. Clustering yields a number of significant patterns, which correspond to cropping intensity (illustrated by Figure 3). The number of significant patterns, each representing a rice-cropping intensity, was determined based on a statistical measurement of how similar that pattern is to patterns in its own cluster, compared to patterns in other clusters, and then combining clusters as needed.
Figure 3. Clustering temporal patterns to distinguish cropping intensity in paddy fields.
Figure 4. (a) Landsat ETM+ dates in conjunction with the seven-year datasets; (b) temporal pattern of MODIS EVI profile. The profile below was assigned to double cropping paddy field in Java Island. The EVI value of the red rectangle of each image in Figure 4a is located by the red point in Figure 4b.
(a)
(b)
In Figure 4(a) note: green = vegetation, light magenta = bareland/fallow, darker magenta(red) = built up, dark blue = inundated paddy rice/fishpond, black = water body(sea)shadow, white = cloud.
2.4. Signal Analysis on Annual Temporal Dynamics
2.4.1. Autocorrelation Analysis
A temporal pattern is essentially a combination of events when repeated in the same order at different time continuously. In this study, these temporal patterns are then analyzed due to temporal correlation. It was determined based on a statistical measurement of how fit that pattern is to its own pattern. A set of correlation coefficients will indicate whether the temporal pattern of the data has a periodical pattern or not, and is represented by the autocorrelation coefficient (AFC).
The correlation coefficient between x and y statistically is given following the function below:
(2)
The correlation between x1 and x1 + 1 is given by:
(3)
where is the mean of the first N − 1 data and is the mean of the last N − 1 data.
As given by Equation (3), measurement of the correlation between successive data is then called the autocorrelation. For reasonably large N, as used in time series EVI data in this study, the difference between the sub-period means and can be ignored and r1 can be approximated by:
(4) where is the overall mean.
Equation (4) can be generalized to give the correlation between dataset separated by k time steps: (5) the quantity rk is called the autocorrelation coefficient at lag k.
In this study, the autocorrelation function of average EVI was estimated, and graphically plotted in a correlogram graph, to describe the rk correlation between the average of the EVI pairs in given
periods and their time separations (lag).
In order to identify the difference among time ranges, the temporal pattern changes were analyzed for each year and, also, the disparity during the seven-year periods. Standard errors of each lag are marked on the correlogram graph to indicate its reliability. The autocorrelation value will be high for the small lags and, later, decreasing when the lags are decreased.
2.4.2. Determining Threshold for Change Patterns
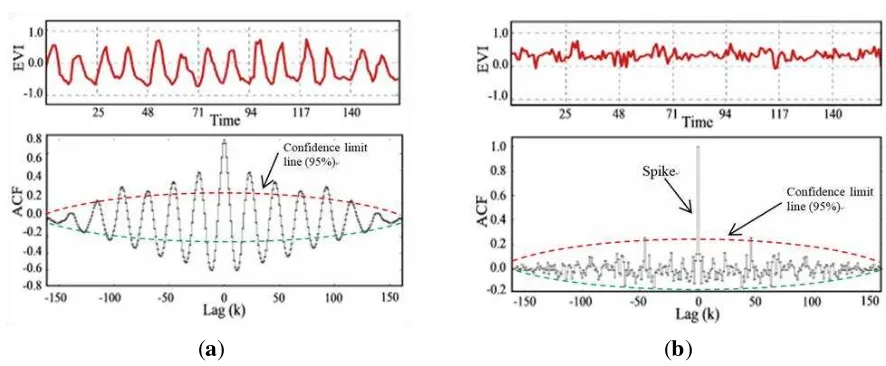
Additionally, the t-statistic test was performed to check the significance level of the temporal autocorrelation. This test is a robust criterion under conditions of model uncertainty [22]. In this study, the change in temporal pattern is defined by the smallest lag, when the temporal autocorrelation is not significant by the t-statistic test. Moreover, identification of the results can also be analyzed visually; when the coefficient is fit pattern and significantly larger than the 95% confidence interval lines, it indicates a periodical pattern or periodical components (Figure 5a), meanwhile, when the coefficient is lower than the confidence interval lines and shows a spike in the middle of correlogram graph, this means that the temporal pattern does not have any periodic components (Figure 5b).
2.5. Accuracy Assessment
during the rainy and dry season in 2012. Site exploration, as well as an interview, was carried out in each site location. The final number of samples in the reference data was 450 samples.
Figure 5. The correlogram graphs. (a) Periodic pattern and (b) Non-the periodic pattern.
(a) (b)
The accuracy of the result was assessed using several accuracy parameters: total accuracy, user’s accuracy, and producer’s accuracy. These accuracy parameters involve error matrices describing the
number of pixels correctly classified or misclassified, which can be characterized as commission error
(user’s accuracy) and omission error (producer’s accuracy), respectively [23].
Moreover, we performed a statistical comparison with the statistics data at village level [24–26] in order to assess the results. This was possible due to availability of data regarding irrigated area,
irrigation infrastructure, harvested area, field rate, and data production for each village. The statistics’
data of 24,962 villages (1,988 sub-districts) in Java Island was used. These data provided more detail about the accuracy, because they were based on a local census.
3. Results and Discussion
3.1. Recognizing Rice-Cropping Intensity
In this study we defined rice-cropping intensity from long-time series MODIS images. The seasonal dynamics change, which then indicates the cropping time and patterns, can be clearly recognized from the fluctuation pattern of vegetation index. For example, while the paddy field is submerged during the rainy season and then vegetation starts to emerge.
The number of cultivation cycles (seedling to harvesting) in paddy fields that occur yearly depends on the availability of water, and regarding the EVI patterns, the rice paddy fields in Java could be sorted into several types of cropping systems. In the irrigated areas, paddy rice can grow during dry season, so that rice crops can be grown one to three times in this land within a year. For that reason, the crops, which are planted in irrigated areas, display continuous EVI fluctuation, even in the dry season.
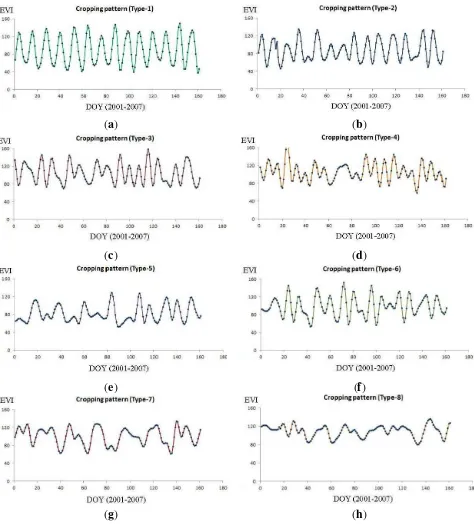
Figure 6. The eight types of annual cropping intensity in Java’s paddy field recognized through the temporal vegetation patterns of EVI (MOD13Q1 product). (a) Paddy triple cropping (paddy-paddy-paddy). (b) Paddy double cropping (paddy-secondary-crop/bare) in Western Java. (c) Paddy double cropping (paddy-secondary-crop/bare) in Central Java. (d) Paddy triple cropping (paddy-paddy-secondary crops/bare). (e) Paddy double cropping (paddy-paddy-secondary crops/bare) in Eastern Java. (f) Paddy double cropping (paddy-secondary-crop/bare). (g) Paddy single/double cropping (paddy-secondary crops/bare). (h) Paddy single/double cropping (paddy-secondary crops/bare) in upland.
(a) (b)
(c) (d)
(e) (f)
3.2. Change Analysis of Seasonal Dynamics over Seven-Year EVI Data
The autocorrelation analysis on temporal pattern EVI during the seven years indicates that the availability of water, which is represented by the fluctuation in annual rainfall, affected significantly to the cropping intensity. The pattern analysis of the paddy-rice field with a double cropping system in most of upland area, as given in Figure 8a, shows that the land has been cropped two times per year continuously, however, in the last year, 2006 (October–December 2006), the pattern changed as represented through the coefficient correlation under the confidence limit. Moreover, an extreme dry season from July to September 2006 caused a disturbance to the rice crops in many areas of Northern Java.
Figure 8. Autocorrelation patterns of intensive paddy fields in three specific areas. (a) Paddy field with double cropping system in upland area. (b) Paddy field with double cropping system in lowland area. (c) Paddy field with triple cropping system.
Furthermore, regarding to the autocorrelation pattern analysis on the paddy-rice field with double cropping system in specific areas that exists in several districts of Central Java, such as Demak and Kudus, the land remains barren-land or without cropping activities in dry season every year; it occurs annually from September to October (Figure 8b). The pattern emphasizes such phenomena, when the autocorrelation coefficient is lower than the upper threshold. These areas are located in lowland areas covered by alluvial soils. A past study [27] explained that these areas exist in lowland areas with seawater invasion in the dry season. The seawater level between high and low tide is approximately 50 cm under ordinary circumstances. However, the level can rise about 2 m; it can then invade lands
(a)
(b)
for up to 15–20 km. This condition leads to the potential salt damage on these lands. Therefore, most
crop varieties in this lowland area are the “Ciherang” variety, a crossed variety of IR 64 and other varieties, which is resistant to such conditions.
3.3. Change Analysis of Seasonal Dynamics in Inter-Annual EVI Data (2001–2007)
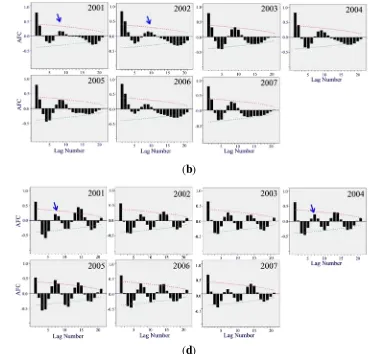
The results of the autocorrelation analysis in inter-annual EVI data are given in Figure 9. Figure 9a shows that the cropping system of paddy field in upland areas changed in 2003, even if the plots of average EVI seem similar year to year. The trend of this temporal pattern can be explained mainly by several characteristics: (1) in general, the area was influenced by annual rainfall, and the vegetation provided a negative response during the dry season and starts to emerge during the rainy season; then, (2) the rainy season tended to come early in 2003; (3) in 2005, there was a water crisis in this area, which is shown by the correlation result, moreover, the average EVI over this time also shows a drought situation. Monitoring annual and seasonal variability in the temporal pattern indicates that this agricultural land has a five-year cycle.
Figure 9b explains that the agricultural lands, with a double cropping system, have a periodic component. Moreover, after the second cropping in 2001 and 2006, cropping was postponed in 2001 and 2006 due to the extreme dry season throughout the areas. This figure represents the characteristics of the type 6 of cropping pattern in Figure 6. Although the autocorrelation pattern of the paddy field with a double cropping system in specific areas (type 2, type 3, and type 8) has a periodic component, the second criteria do not seem significant according to the statistics test. This indicates that during the second cropping period a different crop was sown. The land is classified into the paddy rice field with rain-fed system; consequently, the paddy rice is only planted during the rainy season, meanwhile, during the dry season the land remained fallow.
Figure 9. The inter-annual autocorrelation pattern analysis of paddy field. (a) Paddy field in upland area; (b) Paddy field with double cropping system in rain-fed area; (c) Paddy field in lowland and irrigated area; (d) Paddy field with triple cropping system in irrigated area.
(a) (b)
Regarding the seasonal change analysis, we summarize the result for each type of paddy field as given in Table 1.
Table 1. A summary of the seasonal change analysis of the eight specific paddy fields.
Type Type of Paddy Field Change Occurrence in the Field
1 Paddy triple cropping
(paddy- bare/pond) Eastern Java No change (Consistent)
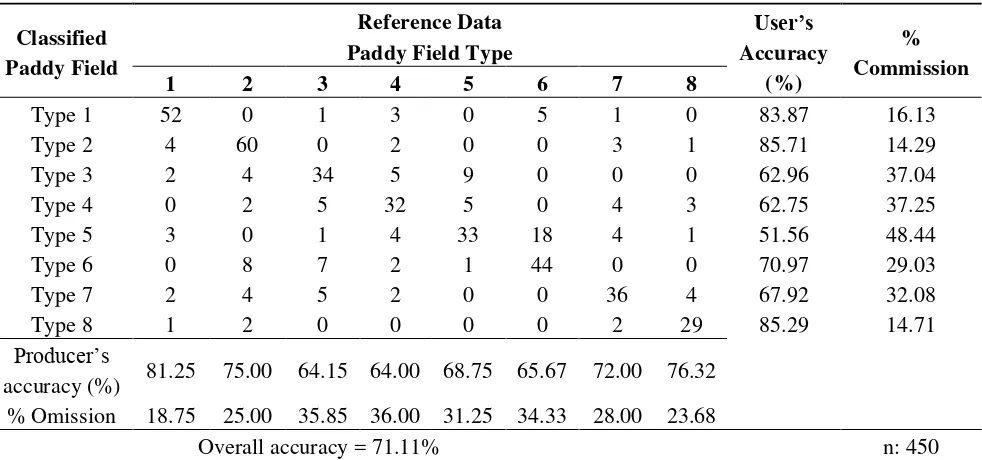
6 Paddy double cropping different inter-annual specific uses such as single, double and triple cropping system. Classifications of specific types were evaluated by 450 reference samples, which revealed the overall accuracy to be 71.11% (Table 2).
Table 2. Confusion matrix for eight specific types of paddy fields.
The greatest error was associated with the paddy field type 3, type 4, type 5, and type 7. Specifically, 37.04% of type 3, 37.25% of type 4, 48% of type 5, and 32.08% of type 7 were assigned to an incorrect category. The lower accuracy in these types indicated the inability of MODIS to define the mixed type of vegetation. However, there is high confidence in pixels categorized as paddy field with triple and double cropping system (Paddy field types 1 and 2).
3.5. Comparison of the Results and Statistical Datasets
The paddy-rice field classified from the long-term MODIS EVI was compared with the statistics tabulation by [24] as shown by Figure 10. The areas estimated by MODIS EVI for Western, Central and Eastern Java were 10% higher, 26% lower, and 42% lower, respectively, than areas defined from statistical data. Moreover, the figure indicated that the MODIS EVI procedure overestimates the area represented by large paddy areas and underestimates the number of small paddy fields. Analysis of the distribution revealed that most of the overestimates (points distributed below the best fit straight line) are located in western part of Java; most of the underestimates (points above the correlation line) are located in Central and Eastern Java. Such results suggest different characteristics of paddy-rice in Western Java as compared to Central and Eastern Java.
Figure 10. Comparison of the paddy field area estimated by this study and the statistical datasets.
In some areas of central and eastern Java, it is difficult to resolve the minimum unit of paddy area with MODIS EVI; consequently, it is also difficult to characterize the temporal dynamics of paddy rice. Even if the irrigation infrastructure exists locally in these areas, if irrigated water is relatively limited, particularly likely in East Java, double or triple cropping may not be possible in a given year.
for example the ENSO (El Niño Southern Oscillation), which caused an extreme dry season in 2006, has significantly affected an availability of water due to the low-intensity rainfall. Accordingly, some agricultural lands became barren in those periods because there was insufficient water for plant growth.
Figure 11. Comparison of the detection results of the change in temporal vegetation dynamics and BPS-Statistics of Indonesia in the paddy fields for two change periods. (a) Period 2003–2006 and (b) Period 2006–2008.
Under normal conditions, the cropping of paddy corresponds to a specific crop calendar, therefore, the change in temporal vegetation pattern reflects a change which occurred on that land either conversion to other land uses or change caused by other factors. Figure 11 shows comparison of the area of paddy field changed at the sub-district level between the detection result of this study and the tabulations by [24–26]. The change areas estimated by this study for change period 2003–2006 and 2006–2008 were 21% higher and 25% lower, respectively, than the areas determined by the statistical data. The result is related to the minimum unit of changed area that could be detected with MODIS data, as mentioned earlier; the approach could detect a change of MODIS pixels if approximately more than 40% of the sub-pixel changed.
4. Conclusions
In this study, long-term satellite imagery was used to recognize the rice-cropping pattern on Java Island. Our method was applied the time-series MODIS imagery from 2001 to 2007 in order to reveal temporal changes of rice phenology (dynamics vegetation pattern) with reference to variations in water resources availability (irrigated/rain-fed area). One of the characteristics of paddy-rice in rain-fed lands is the yearly change of rice-cropping patterns, meanwhile, in the case of irrigated lands, double/triple cropping can be done in the periods, as the lands have the capability to hold sufficient water for crop growth, even in the dry season.
The results indicate that for most of the paddy-rice fields in Java, even where the plots average EVI seems similar year to year, areas were influenced by annual rainfall. For example: land with double
(a)
Change period 2003–2006
(b)
cropping can be changed to be triple cropping when water availability is sufficient, such as in 2005. Then, in 2006, the pattern provided a negative response during the extreme dry season, which is shown by the correlation result, moreover, the average EVI over this time also shows a drought situation.
Indeed, characterizing the long-term vegetation dynamics of paddy-rice field (vegetation phenology) provides information about the characteristics and trends of change in this land use type, either caused by natural factors (climate variability) or human activities (land conversion). Consequently, the effectiveness and efficiencies of the agricultural land development program/policy could be improved for each specific region.
Acknowledgments
The authors would like to thank the Center for Environmental Research, Bogor Agricultural University (PPLH-IPB) for giving us opportunity to get the research funding. This research was partly funded by Osaka Gas Foundation of International Cultural Exchange (OGFICE) Japan for fiscal year 2012–2013. We would like to thank the Professional Fieldwork (“Kuliah Kerja Profesi/KKP”) Program, Faculty of Agriculture, Bogor Agricultural University and Wilona Octora for providing us with an intensive field observation data as reference dataset. Thanks to Devena Haggis who caught misprint mistakes in the manuscript.
Author Contributions
Yudi Setiawan, Ernan Rustiadi and Kunihiko Yoshino designed the study, developed the methodology, performed the analysis and wrote the manuscript. Ernan Rustiadi, Liyantono and Hefni Effendi helped to collect the data and interpret the results.
Conflicts of Interest
The authors declare no conflict of interest. References
1. Food and Agriculture Organization of the United Nations. FAOSTAT. Available online: http://faostat.fao.org (assessed on 5 October 2013).
2. United States Department of Agriculture-Foreign Agricultural Service. INDONESIA: Stagnating Rice Production Ensures Continued Need for Imports; Foreign Agricultural Service, US Department of Agriculture: Washington, DC, USA, 2012.
3. Badan Pusat Statistik. Statistics of Indonesia 2010; Badan Pusat Statistik: Jakarta, Indonesia, 2010. 4. Setiawan, Y.; Yoshino, K.; Philpot, W.D. Characterizing temporal vegetation dynamics of land
use in regional scale of Java Island, Indonesia. J. Land Use Sci. 2013, 8, 1–30.
5. Herold, M.; Latham, J.S.; di Gregorio, A.; Schmullius, C.C. Evolving standards in land cover characterization. J. Land Use Sci. 2006, 1, 157–168.
7. Zhang, X.; Friedl, M.A.; Schaaf, C.B.; Strahler, A.H.; Hodges, J.C.F.; Gao, F.; Reed, B.C.; Huete, A. Monitoring vegetation phenology using MODIS. Remote Sens. Environ. 2003, 84, 471–475. 8. Mahmood, R. Impacts of air temperature variations on the boro rice phenology in Bangladesh:
Implications for irrigation requirements. Agric. For. Meteorol. 1997, 84, 233–247.
9. Wilson, D.R.; Muchow, R.C.; Murgatroyd, C.J. Model analysis of temperature and solar radiation limitations to maize potential productivity in a cool climate. Field Crops Res. 1995, 43, 1–8. 10. Galford, G.L.; Mustard, J.F.; Melillo, J.; Gendrin, A.; Cerri, C.C.; Cerri, C.E. Wavelet analysis of
MODIS time series to detect expansion and intensification of row-crop agriculture in Brazil. Remote Sens. Environ. 2008, 112, 576–587.
11. Martinez, B.; Gilabert, M.A. Vegetation dynamics from NDVI time series analysis using the wavelet transform. Remote Sens. Environ. 2009, 113, 1823–1842.
12. Olson, J.M.; Berry, L. Land Degradation in Java, Indonesia: Its Extent and Impact; Global Mechanism with Support from the World Bank: Washington, DC, USA, 2004.
13. US Geologic Survey Land Processes Distributed Active Archive Center. Data Pool. Available online: https://lpdaac.usgs.gov/lpdaac/get_data/ data_pool (accessed on 10 August 2009).
14. US Geologic Survey Land Processes Distributed Active Archive Center. MODIS Data Product Table. Available online: http://lpdaac.usgs.gov/products/modis_products_table (accessed on 3 December 2010).
15. Vegetation Indices 16-Day L3 Global 250 m. Available online: https://lpdaac.usgsgov/lpdaac/ products/modis_products_table/vegetation_indices/16_day_l3_global250m/mod13q1 (accessed on 29 May 2010).
16. Huete, A.R.; Liu, H.Q.; Batchily, K.; van Leeuwen, W. A comparison of vegetation indices over a global set of TM images for EOS-MODIS. Remote Sens. Environ. 1997, 59, 440–451.
17. Sakamoto, T.; Yokozawa, M.; Toritani, H.; Shibayama, M.; Ishitsuka, N.; Ohno, H. A crop phenology detection method using time-series MODIS data. Remote Sens. Environ. 2005, 96, 366–374.
18. Lu, X.; Liu, R.; Liu, J.; Liang, S. Removal of noise by wavelet method to generate high quality temporal data of terrestrial MODIS products. Photogramm. Eng. Remote Sens. 2007, 73, 1129–1139. 19. Atkinson, P.M.; Cutler, M.E.J.; Lewis, H. Mapping sub-pixel proportional land cover with
AVHRR imagery. Int. J. Remote Sens. 1997, 18, 917–935.
20. Ministry of Environment. Menuju Indonesia Hijau 2008; The Deputy of Controlling for Environmental Damage and Climate Change, Ministry of Environment: Jakarta, Indonesia, 2008. 21. Jain, A.K.; Murty, M.N.; Flynn, P.J. Data clustering: A review. ACM Comput. Surv. 1999, 31,
264–323.
22. Perrier, E.; Wilding, L. An evaluation of computational methods for field uniformity studies. Adv. Agron. 1986, 39, 265–312.
23. Congalton, R.; Green, K. Assessing the Accuracy of Remotely Sensed Data: Principles and Practices; CRC Press: Boca Raton, FL, USA, 1999.
24. Badan Pusat Statistik. Statistics of Indonesia 2003; Badan Pusat Statistik: Jakarta, Indonesia, 2003.
26. Badan Pusat Statistik. Statistics of Indonesia 2008; Badan Pusat Statistik: Jakarta, Indonesia, 2008.
27. Matsumoto, E.; Suvijanto, S.; Yoshihiro, K.; Yoshikazu, T. Environmental conditions of three representative villages in Central Java: The natural environment and the socio-economic behavior of farmers in Thailand and Java. South Asian Stud. 1974, 12, 300–307.