DOI: 10.12928/TELKOMNIKA.v13i3.1786 1021
Earth Image Classification Design Using Unmanned
Aerial Vehicle
Barlian Henryranu Prasetio*1, Ahmad Afif Supianto2, Gembong Edhi Setiawan1, Budi Darma Setiawan2, Imam Cholissodin2, Sabriansyah R Akbar3
1
Computer System and Robotics Lab, Program of Information Technology and Computer Science, University of Brawijaya, Malang 65145, Indonesia
2
Intelligent Computing and Multimedia Lab, Program of Information Technology and Computer Science, University of Brawijaya, Malang 65145, Indonesia
3
Computer Networking Lab, Program of Information Technology and Computer Science, University of Brawijaya, Malang 65145, Indonesia
Corresponding author, e-mail: [email protected], [email protected], [email protected], [email protected], [email protected], [email protected]
Abstract
The research aims to build software that can perform the classification of earth image from UAV (Unmanned Aerial Vehicle) monitoring. The Image converted into YUV format then classified using Fuzzy Support Vector Machine (FSVM). UAVs will be used for monitoring as follows: (1) the control station, which used to send or receive data, and display the data in graphical form, (2) payload, camera captured images and send to the control station, (3) communication system using TCP/IP protocol, and (4) UAV, using X650 quad copter products. The image of the monitoring carried out on the UAV sized 256 x 256 pixels with 450 training data. It is 16x16 pixel image data. Tests performed to classify the image into 3 classes, namely agricultural area, residential area, and water area. The highest accuracy value of 77.69% obtained by the number of training data as much as 375.
Keywords: image transformation, embedded system, FSVM, YUV format
Copyright © 2015 Universitas Ahmad Dahlan. All rights reserved.
1. Introduction
Image classification is the process of grouping image pixels into a number of classes, so that each class can describe an entity with certain characteristics [1]. One area of applications developed using the classification technique is a satellite image. Object identification in satellite image becomes important given the benefit gained is also so great. For example, it can get information about the type and extent of the area of food sources, building or residential area, and the water area (such as rivers, lakes, and reservoirs). By knowing this information then the food security of certain areas and at certain times can be obtained. One alternative way of making images that would be classified is by using a UAV (Unmanned Aerial Vehicle).
UAV (Unmanned Aerial Vehicle) or drones appear due to have several advantages over manned aircraft. Applications UAV is widely used to overcome human limitations in their work, for example, to do the work that tends to routine or dangerous, such as the monitoring of ongoing or that cannot be reached by humans. By utilizing the Human UAV still require information directly from these places, either in the form of pictures, video and other data. The result of information obtained from the UAV can be processed into useful data for humans such as monitoring for land or territory or also information on the monitoring of the military operations area. With advances in the development of an integrated electronic circuit (Integrated Circuit) triggering mass UAV development so that today the UAV can be obtained at an affordable price [2] and be inexpensive alternative solution in the field of aviation.
UAV have become supporting equipment in areas monitoring research such as forest fire monitoring [3], agricultural areas [4] and transport traffic on the highway [5].
be easily integrated with the aircraft where the monitoring system is able to perform low-power communication between the UAV flight control station and sending earth image. (b) Designing and building station software to implement the YUV color model and a FSVM to perform object classification of agricultural land in the results of UAV monitoring image. The results of the software implementation for further analysis to determine the accuracy level of the classification process.
The benefits of this research are: (a) the results can be useful for monitoring the development of an area in need of UAVs as a tool for exploration. By utilizing low power communication mechanism, is expected to be active UAV here longer because power consumption is used to communicate tends to be low. (b) Obtained information agricultural land object class in a UAV imagery. The results of the classification can be used to determine how the extents of the object. By separating objects from an image of farmland, further research can be developed and focused on the identification of agricultural land objects, being food source areas. Identification of the food source areas can be used to implementation national food security information system.
2. Research Method
The methods used in a research greatly affect the performance of the system to work optimally. The methods used in the research are: (a) Material Preparation: In the material preparation carried out activities for collecting literature review is used as the basis for the implementation of the research "Monitoring System using UAVs". The collections was obtained through a literature review of previous research journal search as supporting literature, books, and also collect the datasheet of Pi raspberry equipment that will be used as a cargo UAV and UAV low power communication devices with the control station. (b) Identification: Identification is to identify problems with the obvious limitations of observing equipment used. These observations were made to test each element of the object of research. (c) Requirement Analysis: After all the data obtained through the identification phase, followed by a stage of analysis needs. This stage begins to analyze the needs of both hardware and software is in conformity with the provisions of which have been designed in the identification stage.
2.1. UAV Design
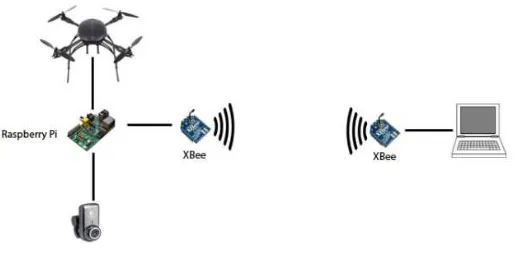
UAV system design consists of payload and ground station. block diagram of the system can be seen in Figure 1.
Figure 1. UAV System Block Diagram
Figure 2. Payload Application Flowchart
The ground station system flowchart can be seen in Figure 3.
Figure 3. The control system flowchart
2.2. Ground Station Design 2.2.1. Data Collection
Data obtained on JPG format. The data that have been obtained are grouped into two categories (training and testing). The research used 450 training data and each class consisting of 150 data.
Training image data captured in 16x16 pixels. Example training data can be seen in Figure 4. Each 16x16 pixel image data is processed using 3x3 pixels window and shifted every single horizontally and vertically pixel. Each window is calculated the average for each color channel. The 3x3 pixel window will be used to perform testing of test images. Test images taken by 5 sample images with 256x256 pixels. The Example test data can be seen in Figure 5.
a b c d e
f g h i j
k l m n o
Figure 5. Examples of test images 256x256 pixels
2.2.2. Algorithm Design
Training phase using window-based classification techniques. At this phase there are a few steps, (i) the selection of training objects for each class is predetermined, (ii) the conversion of an RGB image to the YUV format that will be used as input to the next stage [6], (iii) feature extraction of the input image by performing signal analysis for each signal Y, U and V, and (iv) the components calculation of non-linear classifier using SVM [7], in this case using a gaussian function RBF as its kernel function trick. Training phase is intended to get the value of the parameter w and b are optimal, these parameters are then used to construct the optimal hyperplane as a classifier in the testing phase.
Testing phase will process the image data from UAV to classify into three classes. The steps are (i) tracking window on the testing images, (ii) image conversion into YUV models, (iii) feature extraction by analyzing the signal for every signal Y, U and V, (iii) image classification per window using FSVM [8] with parameters obtained from the training and classification using decision function.
2.3. Algorithm Implementation
Stage algorithm implementation is done to build applications that will be used to determine the outcome of the classification of the proposed method. Based on the design of algorithms described in the previous section, the general implementation consists of two main modules, namely modules in the training stage and the modules in the testing phase.
In the training module there are several procedures that are needed to build applications. Procedures required to build a training module consists of a procedure Training Data, Feature extraction procedures, and procedures svmTrain. Training Data procedure aims to regulate the process of data retrieval and grouping them into classes that have been determined. Feature extraction procedure aims to make the process of extraction of the features that transform RGB to YUV. The svmTrain procedure aims to make the training for data training process. The results of these procedures are the component parameters to be used in the testing phase.
In testing the modules are also several procedures required to build applications. Procedures required to build a testing module consists of a Data Testing procedure, Feature extraction procedures, svmClassify procedures, FSVM procedures, and accuracy procedures. Data testing procedure aims to regulate the process of data collection, tracking window. Feature extraction procedure aims to make the process of feature extraction, namely the transformation of RGB to YUV on each window results of tracking.
class settlements with water. FSVM procedure aims to determine the window into the classroom [9]. Accuracy procedure aims to calculate the accuracy of the test results.
3. Results and Analysis
Testing focused on UAV system communication and image classification then analyzing the results of tests such as maximum accuracy and optimal amount of test data.
3.1. UAV System
UAV transmit images using the XBee protocols. Data sent in a text and sent 10 times. UAV system testing focused on XBee data communications and Serial data reception.
3.1.1. Xbee Data Communication
Testing wireless data communication is done by connecting the XBee module with serial port on a computer via USB to Serial converter. This computer is assigned to transmit serial data which will be transmitted using radio waves by the XBee module. The transmitted data will then be captured by another XBee module is also connected to the computer. The received data will then be displayed on the computer. The test is performed using X-CTU program issued by Digi International. This program is used to configure and perform testing for XBee module. The block diagram of wireless data communications test is shown in Figure 6.
Figure 6. The block diagram of wireless data communications test
In this test, the sender is in the left hand of the figure 6 will send the words "abcdefghijklmnopqrstuvwxyz1234567890" twice by writing the text into the X-CTU program twice. The paper will then be transmitted wirelessly using XBee modules. Transmitted data captured by the XBee receiver and displayed into the X-CTU program on the recipient's computer.
3.1.2. Serial Data Reception
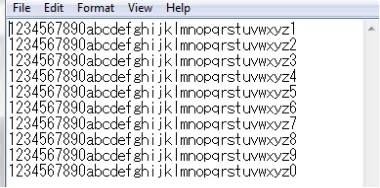
Data sent in a text file that is sent to be broken up into several parts. In this test the original text file size of 3900 bytes will be split into 10 files with each size is 390 bytes. Thus sending the whole file is done in 10 times. The breakdown of the text file can be seen in Figure 7.
Figure 7. The results of solving a text file that will be sent
3.1.3. Application Image Data
image that is displayed by the monitoring application.
3.2. Image Classification
Testing phase is using two scenarios. There are test the effect of parameter accuracy value and test the effect of training data number on accuracy level.
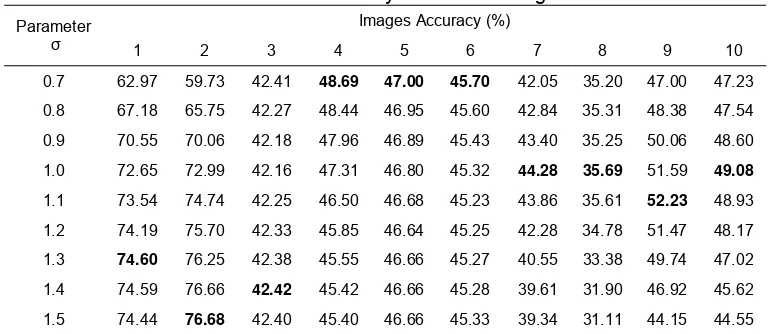
The first scenario was tested using 150 images data where each class consists of 50 image data. Then σ parameters determined in this test ranging from 0.7 to 1.5. The determination of these parameters is the parameter value σ achieve the highest level of accuracy in the value of 0.7 [10].Thus, the testing parameters σ starting from 0.7. The test results in this scenario can be seen in Table 1. Accuracy value in bold are the highest accuracy score for each test images.
Table 1. Value accuracy with 150 training data
Parameter
σ
Images Accuracy (%)
1 2 3 4 5 6 7 8 9 10
0.7 62.97 59.73 42.41 48.69 47.00 45.70 42.05 35.20 47.00 47.23
0.8 67.18 65.75 42.27 48.44 46.95 45.60 42.84 35.31 48.38 47.54
0.9 70.55 70.06 42.18 47.96 46.89 45.43 43.40 35.25 50.06 48.60
1.0 72.65 72.99 42.16 47.31 46.80 45.32 44.28 35.69 51.59 49.08
1.1 73.54 74.74 42.25 46.50 46.68 45.23 43.86 35.61 52.23 48.93
1.2 74.19 75.70 42.33 45.85 46.64 45.25 42.28 34.78 51.47 48.17
1.3 74.60 76.25 42.38 45.55 46.66 45.27 40.55 33.38 49.74 47.02
1.4 74.59 76.66 42.42 45.42 46.66 45.28 39.61 31.90 46.92 45.62
1.5 74.44 76.68 42.40 45.40 46.66 45.33 39.34 31.11 44.15 44.55
From Table 1, it can be seen that for each of the test images, the maximum accuracy obtained with different parameter values . The 1st image classification with 150 training data and parameter =1.3 showed on Figure 8.
Figure 8. The 1st image classification with 150 training data and parameter =1.3: (a) Image Testing; (b) Image classification result
375, and 450 image data with different parameter values as according to the results test accuracy rate previously [11]. The level of accuracy for each training data number is shown in Table 2.
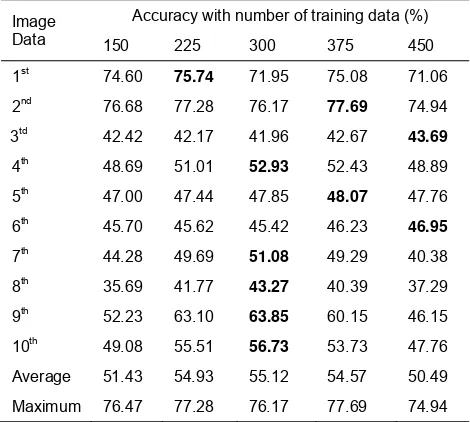
Table 2. List of accuracy level of training data
Image Data
Accuracy with number of training data (%)
150 225 300 375 450
Table 2 shows that the change in the amount of training data used have an influence on the accuracy of the results, but for all the test data used cannot be determined exactly at a certain amount of data to be generated value maximum accuracy. It was shown from the results of the acquisition value of the maximum accuracy for each test image data.
3.3. Analysis
Table 1 showed, for the 1st image, the maximum accuracy value obtained from parameters determination = 1.3 and the 2nd image, it is obtained with the parameter values = 1.5, respectively 74.60 % and 76.68 %. The 3rd image, it is obtained from determination of the parameter values = 1.4 with an accuracy 42.42 %. The 4th, 5th, and 6th image, the maximum accuracy values obtained with the parameter values = 0.7 respectively 48.69 %, 47.00 %, and 45.70 %. The 7th, 8th image, and 10th image obtained the maximum accuracy parameter values with = 1.0 respectively 44.28 %, 35.69 %, and 49.08 %. The 9th image obtained from the determination of parameter values = 1.1 with an accuracy 52.23 %. These results indicate that the next determination of the parameters cannot use a single value, but different for each test images according to the maximum accuracy value.
From Table 2, it can be seen that 5 of the 10 test images, the highest accuracy occurs when number of training data is 300. So it is recommended by 300 training data. And based on the average accuracy results, it appears that the acquisition value of the highest accuracy when the training data is 300. Maximum accuracy rate of all test images was 77.69% in the 2nd image with number of training data for 375.
4. Conclusion
References
[1] Richards John A. Remote Sensing Digital Image Analysis: An Introduction. Verlag Berlin Heidelberg: Springer. 2012.
[2] Mahmood S. Unmanned Aerial Vehicle Communications. Master Thesis. Sweden: Blecking Institute of Technology; 2007.
[3] Merino L, Caballero F, Martinez RJ, Maza I, Ollero A. Automatic Forest Fire Monitoring and Measurement using Unmanned Aerial Vehicles. VI International Conference on Forest Fire Research DX Viegas. 2010.
[4] Herwitz SR, Johnson LF, Dunagan SE, Higgins RG, et al. Imaging from an Uunmanned Aerial Vehicle: Agricultural Surveillance and Decision Support. Computers and Electronics in Agriculture 44.
2004; 49(61).
[5] Coifman B, McCord M, Mishalani RG, Iswalt M, Ji Y. Roadway Traffic Monitoring from an Unmanned Aerial Vehicle. IEE Proc. Intell. Transp. Syst. 1. 2006; 153.
[6] Rubert C, Fonseca L, Velho L. Learning Based Super-Resolution Using YUV Model for Remote Sensing Images. Conference. Proceedings of WTDCGPI. - [s.l.] : WTDCGPI. 2005.
[7] Abe, Shingo, Abe S, Takuya I. Fuzzy Support Vector Machine for Multiclass Problems. Bruges, Belgia: European Symposium on Artificial Neural Network. 2002.
[8] Takuya I. Fuzzy Support Vector Machine for Multiclass Problems. European Symposium on Artificial Neural Networks. Bruges, Belgia. 2002.
[9] Yuyong C, Zhiyuan Z. Remote Sensing Image Classification Based on the HSI Transformation and
Fuzzy Support Vector Machine. IEEE International Conference on Future Computer and
Communication. 2009: 632-635.
[10] Sutrisno, Afif S, Imam C. Implementasi Metode Watershed Dan Morfologi Untuk Segmentasi Pada Citra Satelit Area Universitas Brawijaya. 2012: 1-8.