VOL. 10, NO. 18, OCTOBER 201 5 I SSN 18 19- 6608
ARPN Jour nal of Engineer ing and Applied Sciences
© 20 06- 2015 Asian Resear ch Publishing Net w or k ( ARPN) . All r ight s r eser ved. www.arpnjournals.com
8413
MONITORING GRID FREQUENCY
Mohd Firdaus bin Mohd Ab Halim, Mohamad Haniff Harun, Khalil Azha Mohd Annuar and Suziana Ahmad
Research Group Creative, Innovative and Technology, Faculty of Engineering Technology, Universiti Teknikal Malaysia Melaka (UTeM), Durian Tunggal, Melaka, Malaysia
E-Mail: mohd.firdaus@utem.edu.my
ABSTRACT
The grid frequency of a 50 Hz system varies from 49.8 Hz to 50.2 Hz. Every 0.01 Hz of change in grid frequency correspond to approximately 6% to 8% of power supply dropped in the grid (S. Pourmousavi et al. 2009). Hence high resolution of measurement device is a must to monitor the grid frequency. Most frequency measurement devices such as oscilloscope usually caters high frequency measurement range. Even though some oscilloscope able to measure low frequency signal, its accuracy and resolution is not up to the challenge of measuring grid frequency. Phasor Measurement Unit (PMU) uses by most power system company is not economical to be used by small scale power generation company or for research purpose. In this paper, a simple zero crossing method will be employ to measure the grid frequency with a resolution of 0.003 Hz using Arduino Uno controller. The test and validation of the frequency data took place in Europe specifically at University of Applied Science Rosenheim.
Keywords: grid frequency, arduino, monitoring.
INTRODUCTION
The frequency of transmission grid differs from one country to another. Most countries adopt 50 Hz grid frequency system while some countries uses 60 Hz. Regardless of its technical reason on choosing which frequency suits their respective needs, each and every power provider company is obligated to monitor and analyze the behavior of the grid frequency consistently. The allowable frequency deviation for any transmission grid is +/- 200 mHz (European Network of Transmission System Operators for Electricity, 2014). If the grid frequency fluctuated more than it is allowed, the power transmission system will become unstable and eventually collapsed. The drop in frequency at the grid indicates that the demand is higher than the supply, while the jump in frequency indicates otherwise. Hopefully the measurement device that is developed could assist the relevant stakeholders to monitor the quality of the grid frequency thus increase the awareness of the importance of understanding the behavior of the grid frequency
GRID FREQUENCY MEASUREMENT
Measurement techniques
Before designing the measurement device, the scope of the measured parameter has to be defined. The nominal system frequency in Europe is 50 Hz and the allowable deviations from the nominal values are +200 mHz and -200 mHz while the range is between 49.8 Hz to 50.2 Hz. In the United States, the system frequency is slightly higher, that is 60 Hz but the frequency deviation limit is also +200 mHz and -200 mHz. The standard resolution of the measurement devices found in the past work is about 0.004 mHz while its accuracy between 0.004 Hz to 0.008 Hz. There are numbers of grid frequency monitoring website around the world. Some of the most notable websites are fnetpublic.utk.edu manage by the University of Tennessee (Z. Zhong et al. 2005),
dynamicdemand.co.uk manage by not for profit organization in UK (J. Short, 2009), mainsfrequency.com manage by (T. Gobmaier, 2011) and netzfrequenz.info run by (M. Jaschinsky, 2011). These researchers share some information on how the device is designed and build but not in depth hence made the task of designing measurement device more challenging.
The most popular frequency measurement algorithm is zero-crossing techniques. However, according to (L. Wang et al. 2007), the measured data can be effected by the noise from the signal source. Squares Approximation algorithm can reduce the noise effect but as the frequency deviation range increase, the error would also become larger. Kalman Filter technique can eliminate unwanted noise from the signal source but only if the source function is known. Frequency Disturbance Recorder (FDR) developed by (Z. Zhong et al. 2005) uses Phasor Analysis technique because it meets the accuracy standard of measuring grid frequency besides minimum requirements for its hardware. This techniques is a combination of the techniques mentioned earlier while adding other algorithm like artificial neural network, prony’s method and state estimation. FDR’s is not a commercialized product. Over 1000 units were distributed worldwide mainly in United State. Figure-1 shows the frequency monitoring network architecture.
VOL. 10, NO. 18, OCTOBER 201 5 I SSN 18 19- 6608
ARPN Jour nal of Engineer ing and Applied Sciences
© 20 06- 2015 Asian Resear ch Publishing Net w or k ( ARPN) . All r ight s r eser ved. www.arpnjournals.com
8414
PMU on the other hand is a commercialized frequencymeasurement device uses specifically by the main stakeholder such as power company, transmission operation company and authorized body which monitor the overall quality of the power system. The device converts the electrical signal into mathematical information of magnitude and phase. A simple computation is then used to get the voltage, current and frequency at the location where it is installed. Basically PMU enables the user to see the overall picture of power grid narrowing down to small location. Since it is hardwired communication medium, the problem that occurs in communication via wireless is eliminated.
Each technique has its own characteristic which can be used in different kind of application and situation. FDR is one of those devices that is capable of doing the job but since it is not available in the market, by having a similar device, a small group of researcher and small organization could perform monitoring of the grid frequency according to their expectation and needs. The measurement device which is discussed in this paper uses the zero-crossing technique coupled with a noise reduction circuit to filter noises such as power harmonic, power surge or many other common noise in power grid.
Simulation and hardware development
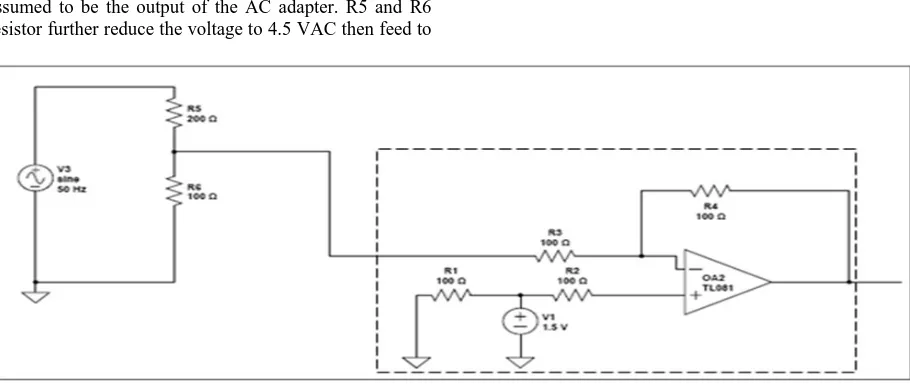
Typical voltage and current power outlet in Germany are 240 VAC 10 Amp respectively. To ensure the safety of the measurement device and the user, the voltage must be reduced to a working condition level which is around 5 VAC. In this project, an AC adapter connected to the power outlet with an output of 9 VAC. A simple circuitry is constructed as shown in Figure-2 while in Figure-3 shows the desired output. CircuitLab software is used to simulate the circuit design. Voltage source V3 is assumed to be the output of the AC adapter. R5 and R6 resistor further reduce the voltage to 4.5 VAC then feed to
the offset circuitry indicated by dotted box below. The offset circuit increases the entire waveform from 0 V to 4.8 V as shown above. The reason for the offset circuit is due to the nature of the microcontroller board which only read positive value of the input signal.
VAC is connected to the input of microcontroller board, for this project we use Arduino UNO board. The microcontroller on Arduino board is ATmega328 which is 32 KB chip with 2 KB EEPROM. The maximum analog input for the board is 5 VAC which included in the initial design strategy. Arduino board communicates with the PC through USB board and the output can be monitor from the serial port monitor at Arduino IDE.
The Arduino Uno comes with its own driver and programming language called sketch. In the early stage of designing the measurement device, the Arduino has to be programmed from scratch. To test the board and the program, the board is first supplied with function generator. The voltage was set to be between 0-5 V sine wave via offset and calibrated with oscilloscope. The setup diagram is shown in Figure-4 as follows. The first step of validating the board functionality is to read the analogue input and print it as output.
The analog input captured via analogRead() command which the board support Analog to Digital (ADC) converter . The values captured are converted into 10 bit integer values between 0 to 1023. In order to read a meaningful data from the values converted, the captured values have to be calculated automatically by the sketch before it is printed at the serial port of the board. Since the voltage signal varies from 0 to 5V, the voltage is thus calculated by the equation number 1.
V= (1)
Figure-2. Schematic diagram to produce desired output voltage.
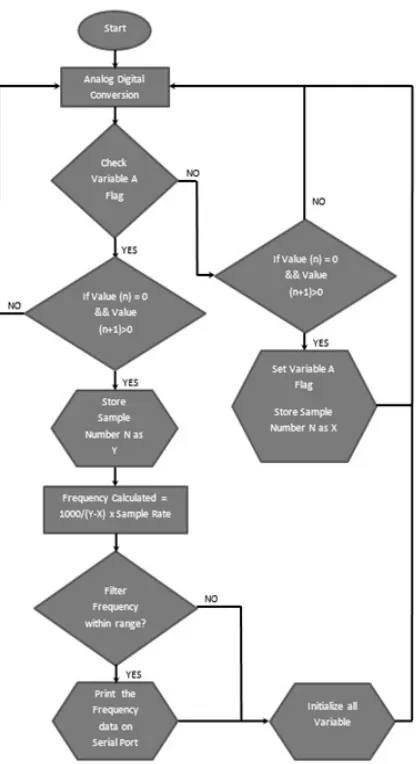
Algorithm of frequency calculation
Figure-3 shows the algorithm of frequency calculation which is programmed inside Arduino board.
VOL. 10, NO. 18, OCTOBER 201 5 I SSN 18 19- 6608
ARPN Jour nal of Engineer ing and Applied Sciences
© 20 06- 2015 Asian Resear ch Publishing Net w or k ( ARPN) . All r ight s r eser ved. www.arpnjournals.com
8415
condition is met, the value of the digital input and samplenumber are captured and save. The period of the signal, P can be calculated by equation number 2 while the frequency, F is by equation number 3.
P = (y-x) × sampling rate (in millisecond) (2)
F =1000/Period (3)
Figure-3. Frequency calculation algorithm.
Validation of the measurement device
The frequency measurement result is send to the serial port. Arduino program does not have the capability to control the user PC, an additional software, GoBetwino is used to perform the data logging coming from the serial port and save into the specific file. This program is open source software that can communicate with the Arduino board. No programming is required and user only need to change the format of the serial print output from the Arduino sketches as stated in Table-1.
Table-1. Command and description at Arduino code changes made.
The data logged by GoBetwino was copied to an excel file and compared versus the reference data from “http://www.netzfrequenz.info/ “.The website gave a helpful graph which the user could make a comparisons. It has 1 minute data graph, 15 minutes data graph and 1 hour data graph. The pattern of the graph, Figure-4 looks similar with both data points peaks and low were matches. The blue scatter plot at the upper part is used as the reference value while the tri-color scatter plot is the data from Arduino.
Figure-4. Real time data feed (T. Gobmaier, 2011) and the data from Arduino (minimum, avergae and maximum).
If we try to observe closely, the measurement data versus reference data, we could make a rough estimation of the error. Refer to Figure-4; at 12:46 PM to 12:48 PM the lowest reading recorded was 49.980 while the reference reading was 49.984 Hz, which yield 0.008% error. At 12:49 PM the reading has only one peak whiles the reference reading showing 2 peaks. At 12:58 PM to 13:00PM, the lowest value recorded was 49.950 Hz while the reference reading shows 49.955Hz, which yield 5 mHz differences.
CONCLUSIONS
VOL. 10, NO. 18, OCTOBER 201 5 I SSN 18 19- 6608
ARPN Jour nal of Engineer ing and Applied Sciences
© 20 06- 2015 Asian Resear ch Publishing Net w or k ( ARPN) . All r ight s r eser ved. www.arpnjournals.com
8416
versus the reference frequency; this can be due to thedevice clock performance and the calculation method. In earlier section, in one second there are around 20 cycle of voltage waveform, thus 20 frequency data can be measured. Noise in the form of outlier is removed from the calculation by specifying the boundary of the expected frequency value. The filtered frequency values were then averaged for every 10 count. In this case, the frequency data is available at the serial port for every 1 to 2 second. From the reference data, the author observe that the data was published in a consistent rate, that is 1 second per-data. If the data skip one cycle of calculation, it means an outlier was filtered out thus forcing the program to wait for the next frequency value before it is available to send to the serial port.
As overall view, the author believe that the data has a negligible error considering that the purpose of the data is to study the behavior of grid frequency and not for automation or control which has higher specification. Even for the European Network of Transmission System Operators for Electricity (ENTSO-E) standard, the accuracy of the frequency measurement for primary reserve control should be below 10 mHz. In terms of functionality, this device has achieved the desired target while in terms of cost, the hardware only cost not more than 100 US Dollar. This device may not have the high end function like in PMU but it provides an alternative for small organization and researcher to have their own monitoring system that works and affordable.
REFERENCES
[1] Gobmaier T. 2011. Online-measurement of the mains frequency. Mainsfrequency.com, 2011. [Online]. Available: http://www.mainsfrequency.com/. [Accessed: 21- August- 2014].
[2] Jaschinsky M. 2011. Netzfrequenz.info - aktuelle Netzfrequenz online', Netzfrequenz.info, 2011. [Online]. Available: http://www.netzfrequenz.info/. [Accessed: 23- July- 2014].
[3] Pourmousavi S., Cifala A. and Nehrir M. 2012. Impact of high penetration of PV generation on frequency and voltage in a distribution feeder. 2012 North American Power Symposium (NAPS).
[4] Short J. 2014. Dynamic Demand.
Dynamicdemand.co.uk, 2009. [Online]. Available:
http://www.dynamicdemand.co.uk/grid.htm. [Accessed: 27- July- 2014].
[5] UCTE Operation Handbook on Load Frequency Control and Performance P1, 2nd ed. Brussel: European Network of Transmission System Operators for Electricity, 2014, p. 5.
[6] Wang L., Burgett J., Zuo J., Xu C., Billian B., Conners R. and Liu Y. Frequency Disturbance Recorder Design and Developments. 2007 IEEE Power Engineering Society General Meeting.
[7] Zhong Z., Xu C., Billian B., Zhang L., Tsai S., Conners R., Centeno V., Phadke A. and Liu Y. 2005. Power System Frequency Monitoring Network (FNET) Implementation. IEEE Transactions on Power Systems, Vol. 20, No. 4, pp. 1914-1921.
![Figure-1. Frequency monitoring network architecture [8].](https://thumb-ap.123doks.com/thumbv2/123dok/490254.54095/1.612.317.539.612.717/figure-frequency-monitoring-network-architecture.webp)