SUPERVISOR DECLARATION
“I hereby declare that I have read this thesis and in my opinion this thesis is sufficient in terms of scope and quality for the award of the degree of
Bachelor of Mechanical Engineering (Thermal-Fluids)”
SIGNATURE : ………
SUPERVISOR : ENGR. MUHAMMAD ZULFATTAH BIN ZAKARIA
EMSSION INVENTORY FOR AREA SOURCES (CASE STUDY FOR PETROL STATION)
NURUL NAJWA BINTI WAHAB
This thesis is submitted as
partial fulfillment of the requirement for the award of a Bachelor of Mechanical Engineering (Thermal-Fluid) with Honours.
Faculty of Mechanical Engineering Universiti Teknikal Malaysia Melaka
ii
DECLARATION
“I hereby declare that the work in this thesis is my own except for summaries and quotations which have been duly acknowledged.”
SIGNATURE : ………... AUTHOR : NURUL NAJWA BINTI WAHAB
iii
Special for
Ayah, umi, angah, emiey, adik and for the special one
iv
ACKNOWLEDGEMENT
I would like to express my deepest appreciation to all those who provided me the possibility to complete this thesis. A special gratitude I give to our final year project Supervisor, Engr Zulfattah Bin Zakaria, and to my second supervisor Dr. Tee Boon Tuan whose contribution in stimulating suggestions and encouragement, and helped me to coordinate my project especially in writing this thesis.
v
ABSTRACT
Melaka Historic City Council (MBMB) has been choose to join this programme. There are many air pollutant that emit to the enviroment for example
Ammonia (NH3), Carbon monoxide (CO), Nitrogen oxides (NO2), Non-methane
vi
ABSTRAK
Majlis Bandaraya Melaka Bersejarah (MBMB) telah dipilih untuk menyertai program inventori pelepasan gas pencemaran alam sekitar. Terdapat pelbagai jenis gas
pencemaran udara yang telah dilepaskan oleh banyak sumber seperti Ammonia (NH3),
Karbon Monoksida (CO), Nitrogen dioksida (NO2), Non-methane volatile organic
vii
TABLE OF CONTENT
SUPERVISOR DECLARATION i
DECLARATION ii
ACKNOWLEDGEMENT iv
ABSTRACT v
ABSTRAK vi
TABLE OF CONTENT vii
LIST OF TABLES ix
LIST OF FIGURES x
LIST OF APPENDICES xi
CHAPTER 1 1
INTRODUCTION 1
1.0 BACKGROUND STUDY 1
1.2 PROBLEM STATEMENT 3
1.3 OBJECTIVES 4
1.4 SCOPE 4
CHAPTER 2 5
LITERATURE REVIEW 5
2.0 INTRODUCTION 5
2.1 TYPES OF MANUAL USE FOR EMISSION INVENTORY
PROGRAMME 6
2.1.1 UNITED KINGDOM NATIONAL ATMOSPHERIC EMISSION
INVENTORY (NAEI) 6
2.1.2 PROAIR 7
2.1.3 UNITED STATES ENVIRONMENTAL PROTECTION
viii
2.1.4 CORE INVENTORY AIR EMISSION (CORINAIR) 11 2.2 PROCESS OF EMISSION INVENTORY FOR
PETROL STATION 15
2.3 CASE STUDY 18
CHAPTER 3 21
METHODOLOGY 21
3.0 INTRODUCTION 21
3.1 GANTT CHART 22
3.2 FLOW CHART 22
3.3 DATA COLLECTION 22
3.3.1 SURVEY 23
3.4 CALCULATION OF EMISSION NMVOC 24
3.5 PLOTTING EMISSION OF NMVOC 25
CHAPTER 4 27
RESULT AND ANALYSIS 27
4.0 INTRODUCTION 27
4.1 STUDY AREA 28
4.2 DATA AND RESULT 29
4.2.1 CALCULATION FOR EMISSION OF NMVOC 31
4.3 DATA ANALYSIS 34
4.3.1 FACTOR AFFECT EMISSION OF NMVOC AT PETROL
STATION 35
4.3.2 PLOTTING ANALYSIS 37
4.3.3 PROBLEMS OF THE STUDY 40
CHAPTER 5 41
CONCLUSION AND RECOMMENDATION 41
5.0 CONCLUSION 41
5.1 RECOMMENDATION 43
REFERENCES 44
ix
LIST OF TABLES
Table 2.1: The type of tier use in CORINAIR (Goodwin, 2014) 12 Table 2.2: List of the advantages and disadvantages of the emission
programme (EI) 17
Table 2.3: Comparison of suggested method and time duration to run 20 Table 3.1: Tier 2 emission factors for source category 1.B.2.a.v
x
LIST OF FIGURES
Figure 1. 1: The region of MBMB territory 2 Figure 2. 1: Flow chart to determine the method to estimate air pollution emission either use tier 1, tier 2 or tier 3 13 Figure 2.2 : Car refuelling activity will contribute emission of NMVOC 15 Figure 2.3: Process distribution of petrol from petrol station 18 Figure 2.4 : Percentage of contribution of VOC to the total emission sources of
Chiang Mai 19
Figure 3.1: Survey form 24 Figure 3 2: Plotting template for emission of NMVOC by using Software Map Info
10.0 26
Figure 4. 1: Type of petrol station company at MBMB area 28 Figure 4. 2: Schematic diagram calculation of emission NMVOC by petrol
station 32
xi
LIST OF APPENDICES
Appendix 1: Gantt chart PSM 1 48
Appendix 2: Gantt chart PSM 2 49
Appendix 3: Flow chart for PSM 1 and PSM 2 50 Appendix 4: Sample Calculation of emission for petrol 51 Appendix 5: Sample calculation of emission for diesel 52
Appendix 6: Type of petrol 53
1
CHAPTER 1
INTRODUCTION
1.0 BACKGROUND STUDY
Emission inventory (EI) is the program that trains for clean air in smaller cities. This program also known as a quality management program. This program is about a comprehensive of database that contain information about location of sources, type of sources, process that resulting emission of air pollutant, and the rates of emission that emitted into the air and into surrounding. Besides that, this EI program is used to conduct and use EI as part of the measurement of air quality level and to manage the air quality of the environment. This EI program will be covering the area of Melaka Historic City Council (MBMB) Melaka, Malaysia. The administration area for MBMB
is around 30.86 km2. Figure 1. 1 shows the map of MBMB territory such as Tanjung
2
Figure 1. 1: The region of MBMB territory (http://www.mbmb.gov.my/warga-mbmb)
In this program, there are four major emission sources that going to involved
3
Next, all the data must be taken based on location of the emission sources,
quantity of pollutant that emitted from the sources and type of sources can effect on the quality of air of each study area. The reasons to conduct this program is to get an idea and strategies to improve the quality of air of affected area. Besides that, this program also use to evaluate and make some review of emission of pollutants and impact to the pollution of some places. The reasons of this program is to make a legal decisions and action and revise the current air quality of the affected area.
There are many types of factor that can make pollutant emitted from emission
sources to the environment. Major factor of the air pollution is caused by human activity for example the activity like open burning, forest fire, construction site, and many more. All this kind of human activity can give harm to human health, animal life, plant growth, and changes of climate and weather. Types of pollutant that emitted
from the emission sources that is Carbon Monoxide (CO), Nitrogen Dioxide (NO2),
Sulfur Dioxide (SO2), Lead (Pb), Volatile Organic Compound (VOC), Ozone (O3) and Carbon Dioxide (CO2). The type of emission that will be studied is area sources and the case study is for a petrol station. Petrol stations are one of the places that contributes pollution to the environment, the most pollutants that emitted from the petrol station is Non-methane Volatile Organic Compound (NMVOC).
1.2 PROBLEM STATEMENT
4
In addition, there are various type of process that need to be covered at petrol station but in this study, only the process of automotive refuelling activity that need to give more attention. However, the major problem in this study is to get the data from the petrol station due to the fact that most of this data are private and confidential.
1.3 OBJECTIVES
The objectives of this study are to obtain data of emission of NMVOC released by petrol station. Other than that, this study is to calculate the amount of pollutant NMVOC that will be released by petrol station in MBMB territory. Next, the objective is to analyse the emission of NMVOC that emit from the petrol station to the environment by using map analysis.
1.4 SCOPE
5
CHAPTER 2
LITERATURE REVIEW
2.0 INTRODUCTION
6
2.1 TYPES OF MANUAL USE FOR EMISSION INVENTORY PROGRAMME
The emission inventory programme has so much concern about the amount of pollutant sources in studied area. In this programme, there are various types of method that can be apply to get the quantitative and qualitative data from various types of pollution sources. In this study, most of pollutants that emit from the petrol station is a volatile organic compound (VOC) and non-methane volatile organic compound (NMVOC). This pollutant will emit when oil distributing process of petrol occurs at petrol station. Emission of oil distribution process can be occurred in various process that is from bulk storage tank, from the petrol station to storage tanks, transportation of refuelling activity from tank to the vehicle and other sources of NMVOC and VOC emission.
There are various type of manual can be used to obtain the data needed and how calculation of emission for each petrol station need to be calculated. Therefore, type of manual that can be used in this study are United Kingdom National Atmospheric Emission Inventory (NAEI), a programme to improve the air quality in
Mexicali, Baja California, USA (PROAIR), United States Environmental Protection
Agency (USEPA), and Core Inventory air emission, (CORINAIR). Each method is
different in the step to get the data, time period to do the research that depends on the geography of the area of the country, and type of pollutant that emit to the environment in various sources.
2.1.1 UNITED KINGDOM NATIONAL ATMOSPHERIC EMISSION INVENTORY (NAEI)
7
as Ammonia (NH3), Carbon monoxide (CO), Nitrogen oxides (NOX as NO2),
Non-methane volatile organic compounds (NMVOCs) Sub-10 micron particulate matter (PM10), Sulphur dioxide (SO2), and Lead (Pb) (J.MacCarthy, G. Thistlethwaite et al., 2012).
The NAEI is made up of the Greenhouse Gas Inventory (GHGI) and the Air Quality Pollutant Inventory (AQPI) and deliver these estimates, the GHG inventory team at Ricardo-AEA collect and analyse information from a wide range of sources – from national energy statistics through to data collected from individual industrial plants (“National Atmospheric Emission Inventory”, 2013). Method that will use is based on the number of resources that will used to analyse UK emission for NAEI point data base, emission mapping by grid data, regional data based on the activity data trends to develop Greenhouse Gas (GHG) inventories, and generic parameter and proxy data (J.MacCarthy, G. Thistlethwaite et.al., 2012).
For NAEI point data base on production data. This data request from the manufacturer industry. The emission of pollutant is based on production data for example data from power station, refineries and cement and lime manufacturer and others. Besides that, the location of site will extract all emission with geographical area. The point source database covers nearly 100% of emissions, and is regarded to be the best available dataset for such sources, which is based on energy use and emissions data derived from regulatory agency sources that are subject to quality checking and independent verification (J. MacCarthy, G. Thistlethwaite et.al., 2012)
2.1.2 PROAIR
8
reducing the concentration pollution in atmosphere and to control emission by industry. There are five strategies on each group with different specific action that applied according to;
Industry, commerce, and services
Motor and vehicles
Urban and transport management
Ecological recovery
Research and international agreement
Mexico has set standards for six categories of pollutants: ozone, carbon monoxide, total suspended particulate maters, sulfur dioxide, lead, and nitrogen oxide (Margarito Quintero, Lourdes Meza et.al., 2010). Type of emission is based on three types that is point sources, area and natural sources, and motor vehicles sources. Emission of point source, area source, and motor vehicle emissions that all result from human activities, natural source emissions represent emissions occurring regardless of human presence.
Natural emissions should be estimated in order to provide an accurate assessment of background conditions for a particular area, to understand the relative significance of each source category contributing to the total emissions, and to develop appropriate air quality control strategies (“Mexico Emissions Inventory Program Inventory Methodology Development for the Country of Mexico: Lessons Learned from the Application of the Mexico Emissions Inventory Methodology in the City of
Mexicali, Baja California,” 2000). VOC sources is emitted from major contributor
9
2.1.3 UNITED STATES ENVIRONMENTAL PROTECTION AGENCY (USEPA)
United State environmental protection agency (USEPA) is one of the manual that can be used to obtain data from the emission process. USEPA has been identified air pollutants of concern because of their impacts on health and the environment (Williams and Kilaru, 2014). The type of pollutant involve are ozone (O3), penetrate
matter (PM), Carbon monoxide (CO), Nitrogen Oxide (NO2), Sulphur dioxide, (SO2)
and Lead (Pb).
Besides that, many air pollutants can remain in the environment for long periods of time and are carried by the wind hundreds of miles from their origin and effects resulting air pollutants that may be seen associated after short-term for example, hours to weeks or long term exposures like a months to years. In addition, air pollution can also effect environmental that including climate change, acid rain, smog and haze. Air quality is a complex and may take a years to gain understanding of air pollution.
10
Base on case study for petrol station, USEPA also use this method to determine the emission that occur in petrol station. USEPA is study about the emission from oil and gas process that involved from the extraction and production of oil and natural gas. Besides that, the emission of pollutant such as VOC will emitted by processing, transmission, and distribution of oil and gas (Beusse et al., 2013). VOC is made up by carbon compound and participate in atmospheric photochemical reactions. VOC sources is emitted from “fuel combustion” that is from coal, gas and oil. Other than that, VOC also emitted from “industrial process” by process of production and fuel combustion. VOC also can be emitted from “on-road vehicle” and “non- road vehicle”. The example for on-road vehicle is car, motorcycle, and truck for the non-road vehicle like aircraft, boat, ship and others. All of them use petrol or diesel to move from one place to another place ( Thesis on environment, 2008).
The method used to determine quantifying emission is by direct measurement of emission and collecting data from the process. Next, a pollutant that released to the environment will represent as emission factor. In EPA the emission factor is used to predict the emission produce for specific process. Lastly, the emission will be used as engineering parameter and will referred to calculate the emission level.
11
2.1.4 CORE INVENTORY AIR EMISSION (CORINAIR)
Another method use in emission inventory programme is Core Inventory air emission (CORINAIR). This method is used based on human activity that can emit air emission for instance is combustion process, production of industrial and agricultural and forestry sector. Besides that, in CORINAIR natural process also one of the factor of emission of pollutant (Adams, 2013). The type of pollutant that emit to the air is
Sulphur dioxide (SO2), Nitrogen oxide (NOX), Volatile Organic Compound (VOC),
and Particulate matter (PM). Generally, the basic policy in estimating emission inventory of air pollutant is by emission estimation method. The basic formula for mobile, area, and point sources of emission is;
Emission = Emission Factor × Active data (2.1)
Where; Emission factor is the average of emission of pollutant per unit for activity data for category, Active data indicate the activity that cause the emission that collected from statistic survey and the emission is the amount of pollutant that emit from the source.
According to Eq. (2.1) this equation will use to calculate the emission for various type of emission sources. There are two method that use to determine emission estimation, which is simple and detailed method. For simple method use top-down approach and estimate emission by multiplying emission factor with activity data based on amount of fuel used over a period of time, using data which indicates the active data over a period of time of the emission source to be estimated. Besides that, for detailed method use bottom-up approach estimate by accumulating the information of each emission sources (“Guidelines for Developing Emission Inventory in East Asia,” 2012) .
There are two type of emission inventory method that can be applied that is top-down approach and bottom-up approach. The method is;
Top-down approach
12
consumption, production, vehicles and other activity and will covered larger region (Sylke Davison, Sef van den Elshout, 2011).
Bottom- down approach
The emission inventory that construct from more about the emission sources, location and consumption data. Easy to diagnose the situation and local police because each location and activity area are determined (Sylke Davison, Sef van den Elshout, 2011).
Combined approach
Emission inventory by using combined approach is the combination from the top-down approach and the bottom-down approach. This is because there are some weakness of using bottom-down approach because lack of available input data and for top-down approach data is based on individual sources. So the combination of two other method can help to approach the construction to make sense because has double counting or forgetting emission (Sylke Davison, Sef van den Elshout, 2011).
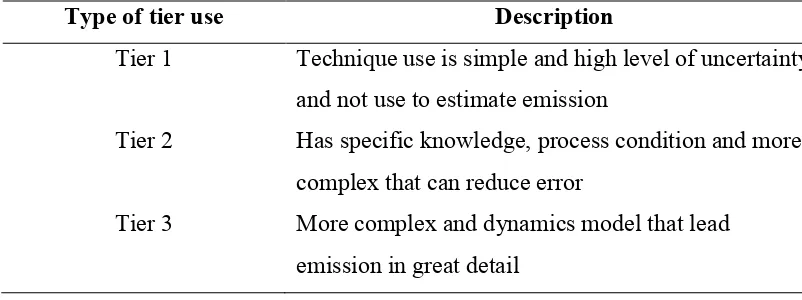
CORINAIR is developed by the European Environmental Agency (EAA) that serve general database for emission information and calculation of different levels. In addition, CORINAIR is based on point and area sources. Other than that, CORINAIR is divided into three type of method that can be apply for emission inventory programme. Table 2.1 shows that, the description about the type of tier use in CORINAIR for point, area and mobile sources.
Table 2.1: The type of tier use in CORINAIR (Goodwin, 2014) Type of tier use Description
Tier 1 Technique use is simple and high level of uncertainty
and not use to estimate emission
Tier 2 Has specific knowledge, process condition and more
complex that can reduce error
Tier 3 More complex and dynamics model that lead