T
he purpose of the present study was to examine genetic and environmental contributions to individ-ual differences in maximal isometric, concentric and eccentric muscle strength and muscle cross-sectional area (MCSA) of the elbow flexors. A generality versus specificity hypothesis was explored to test whether the 4 strength variables share a genetic component or common factors in the environment or whether the genetic/environmental factors are specific for each strength variable. The 4 variables under study were measured in 25 monozygotic and 16 dizygotic male Caucasian twin pairs (22.4 ± 3.7 years). The multivari-ate genetic analyses showed that all 4 variables shared a genetic and environmental component, which accounted for 43% and 6% in MCSA (h2= 81%), 47%and 20% in eccentric (h2= 65%), 58% and 4% in
iso-metric (h2 = 70%) and 32% and 1% in concentric
strength (h2= 32%) respectively. The remaining
varia-tion was accounted for by contracvaria-tion type specific and muscle cross-sectional area specific genetic and environmental effects, which accounted for 38% and 14% in MCSA, 18% and 15% in eccentric, 12% and 26% in isometric and 0% and 67% in concentric strength respectively. This exploratory multivariate study suggests shared pleiotropic gene action for MCSA, eccentric, isometric and concentric strength, with a moderate to high genetic contribution to the variability of these characteristics.
From a general health perspective, muscular fitness is associated with performing activities of daily living (ADLs) independently (Landers et al., 2001). Indicators of functional status of skeletal muscle (strength, power and endurance) are positively associ-ated with bone health (Rhodes et al., 2000) and psychological wellbeing (Payne et al., 2000) and nega-tively associated with falls and fractures (Rutherford, 1999), morbidity (Rantanen et al., 1998) and mortal-ity (Fujita et al., 1995). The age-associated decline in muscular strength and mass may also be related to prolonged disuse and/or chronic disease, such that a
vicious cycle is created wherein inactivity leads to sar-copenia (age-related loss of muscle mass, strength and function), which further worsens the ability to perform ADLs. Results of these studies raise the ques-tion to what extent genes and environmental factors influence musculoskeletal fitness components which are determining factors for predicting health status, particularly in the elderly.
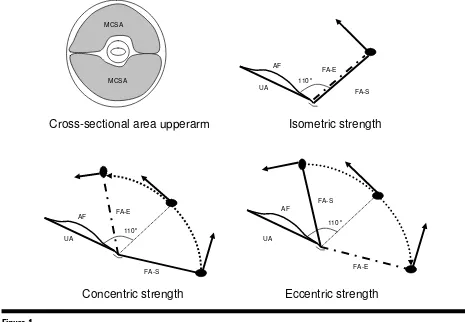
Muscle strength is a complex phenotype with iso-metric strength being the force generated by a muscle at a specific joint angle (e.g., 110° with extended arm = 180°) without lengthening or shortening of the muscle fibers (Figure 1). Dynamic concentric contrac-tions are characterized by shortening of the muscle fibers (e.g., concentric arm flexion from extended to flexed arm position), while in dynamic eccentric con-tractions the muscle fibers are lengthened against an external force (e.g., eccentric arm flexors are length-ened from flexed to extended arm position against an external force that is directed to the extending arm). Dynamic actions are the most common types of muscle action and can be executed at different con-traction speeds (e.g., 120° s–1).
Individual differences in isometric and dynamic strength performances and muscle cross-sectional area (MCSA) within the population are well documented in the literature (Hortobagyi & Katch, 1999; Hulens et al., 2001). Results of these studies demonstrate variability in muscle strength at different angles, speeds, and contraction types (concentric, eccentric, isometric). Furthermore, strength differences seem not to vary independently from each other within and between individuals. Statistical evidence for strength ‘generality’ was suggested with high intercorrelations
Covariance of Isometric and Dynamic Arm
Contractions: Multivariate Genetic Analysis
Gunther De Mars,1Martine A. I. Thomis,1An Windelinckx,1Marc Van Leemputte,1Hermine H. Maes,2 Cameron J. Blimkie,3Albrecht L. Claessens,1Robert Vlietinck,4and Gaston Beunen1
1Department of Biomedical Kinesiology, Research Center for Exercise and Health, Faculty of Kinesiology and Rehabilitation Sciences, Katholieke Universiteit Leuven, Leuven, Belgium
2Department of Human Genetics,Virginia Institute for Psychiatric and Behavioral Genetics and Massey Cancer Center,Virginia Commonwealth University, Richmond,Virginia, United States of America
3Department of Kinesiology, McMaster University, Hamilton, Ontario, Canada
4Department of Human Genetics, Faculty of Medicine, Katholieke Universiteit Leuven, Belgium
Received 23 May, 2006; accepted 17 August, 2006.
(r > .80) among different expressions of strength (bench press slow, isokinetic fast and 1 repetition maximum [RM]; Hortobagyi et al., 1989).
Previous genetically informative studies have sug-gested that individual differences in strength and muscle mass are for the most part accounted for by genetic factors. However, few studies have investigated whether the same or different genetic factors account for the high correlations observed within individuals for the strength phenotypes. Differences in the genetic and environmental contributions to the variation in isomet-ric versus dynamic strength, concentisomet-ric versus eccentisomet-ric strength and strength components versus MCSA could be indicative of the action of different genes and expo-sure to different environmental conditions between these three types of muscular strength and MCSA. Evidence for high genetic correlation would be indica-tive of a same set of genes with pleiotropic actions on these different strength/muscle phenotypes.
Univariate analysisof muscle circumferences of the extremities in 10- to 14-year-old boys and girls revealed a genetic component A (a2 = 87%–95%)
which was more important than the unique environ-mental contribution E (e2= 4%–14%) to the variance
in these traits (except for calf circumference at 14 years where A, E and the common environment C explained 64%, 10% and 26% of the variance, respectively; Loos et al., 1997). Results of other studies confirm these findings with a2greater or equal
to 85% and e2less than or equal to 15% (Loos et al.,
1997; Thomis, Beunen, Maes, et al., 1998; Thomis, Beunen, Van Leemputte, et al., 1998; Thomis, Van Leemputte, et al., 1997). However, no evidence could be found for the presence of a common environmental factor C. Isometric strength at different angles, ages and in different muscle regions has been thoroughly analyzed in twin studies resulting in moderate to high heritability estimates ranging from 44% to 78%, whereas the contribution of E was low to moderate (Beunen & Thomis, 2000; Thomis, Beunen, Maes, et al., 1998; Thomis, Beunen, Van Leemputte, et al., 1998; Thomis, Van Leemputte, et al., 1997; Tiainen et al., 2004, 2005). Eccentric arm contractions at 110° flexion at different speeds (30°/s, 60°/s, 120°/s) were evaluated in a pre-, posttraining design (Thomis, Beunen, Maes, et al., 1998) where the genetic contri-bution to the variance (74%, 77% and 65% respectively in the pretraining design) was more important than E. In contrast, E played a larger role in concentric torques at the same angle and speeds (50%, 55% and 69% respectively) than genetic factors did. However, a study with older female twins (Tiainen et al., 2005) found a larger genetic (a2= 61%) than
envi-ronmental (e2= 29%) impact.
Multivariate genetic analysis is carried out to esti-mate the contribution of genetic and environmental factors to the covariance between traits. The presence of a general genetic and environmental component for muscle circumference measurements in the extremities
was found by Loos et al. (1997). For MCSAs, 60% to 93% of the variance was caused by a common genetic factor Ac, while the environmental common factor Ec explained only 1% to 21% of the variance. The con-tribution of specific genetic and environmental factors was less than 30%. To capture the entire variability in isometric muscle strength, Tiainen et al. (2004) used measurements on multiple muscle groups (ankle plantar flexion, handgrip, knee extension). An ACE model best explained the covariances between the variables, suggesting the importance of common genes and environmental factors. The remaining variance was explained by environmental factors specific for each variable. From previous studies it is known that isometric strength and MCSA are related: multivariate analyses suggested a general set of genes that control muscle area (82%) and isometric strength (50%–66%; Thomis, Van Leemputte, et al., 1997; Thomis et al., 2000). Recently, a similar study was conducted by Tiainen et al. (2005) which indicated the presence of Ac and Ec which contributed to the covariance between isometric knee extensor strength and concen-tric leg extension power (Tiainen et al., 2005).
These studies suggest that MCSA, isometric (Fiso), concentric (Fcon) and eccentric (Fecc) muscle strength are under large genetic and environmental control with evidence for a larger generality versus specificity limited model in exploring MCSA versus concentric or isometric strength. However, the covariance between MCSA and all three contraction types (Fcon, Fiso, Fecc) has not been studied before.
The purpose of the present study was therefore to examine to what extent the relation between MCSA and three different muscle-contraction types was caused by the action of the same genes or by common factors in the environment. Further knowledge of the underly-ing pleiotropic action of genes (which affect several different phenotypes) in different muscle phenotypes is useful in the study of quantitative trait loci for muscu-lar strength (Boomsma, 1997; Huygens et al., 2004).
Materials and Methods
Subjects
pro-tocol before giving their written consent. The project was approved by the local medical ethics committee.
Determination of zygosity was assessed by exami-nation of the following genetic markers: ABO, Rhesus (D, C, Cw, c, E, e), MNSs and Duffy (a, b). The power to detect dizygotic (DZ) twins with this set of genetic markers was 91%. Differences in two genetic markers were used to establish dizygosity. The probability of monozygosity of pairs with the same genetic markers was calculated (Vlietinck, 1986). All monozygotic (MZ) pairs had a probability of monozygosity of at least 95%. Twenty-five pairs were classified as MZ and 16 pairs as DZ.
Measurement Protocol and Variables
The phenotypes under study were maximal isometric torque (Nm) of arm flexion at 110° (extended arm = 180°), maximal torques during maximal concentric and eccentric muscle contraction at a velocity of 120° s–1 measured at the 110° flexion position, as well as arm muscle cross-sectional area (Figure 1). The selec-tion of these strength phenotypes was based on their relationship with the performance of ADLs: the three contraction types represent relevant movements in daily life, while low levels of MCSA are related with sarcopenia and thus are important in explaining and predicting the occurrence of falls and fractures
(espe-cially in the elderly; Fisher, 2004). The evaluation of maximal isometric and dynamic voluntary contrac-tions was done after 1 week of adaptation to a training apparatus using low training loads (50%–70% 1 RM) on an active programmable dynamometer (Promett; Vande Broek et al., 1995). Subjects were seated in a comfortable, standardized position, strapped to the chair with their right arm resting on the measurement device. They were asked to build up their maximal isometric strength and to hold this maximum for 3 s. The highest registered torque during this contraction was selected as the maximal isometric strength measure expressed in Newton meter (Nm). The test–retest correlation was .97. The observer was able to evaluate each subjects’ maximal effort by visualized torque and electromyo-graphic signals registered at M. Biceps Brachii, M. Brachioradialis, M. Brachialis and as a control for cocontraction, M. Triceps Brachii. Maximal concen-tric and eccenconcen-tric contractions of the arm flexors at 120° s–1 were evaluated in a range of motion from 170° to 50° and from 50° to 170°, respectively. The torque at 110° during these concentric and eccentric measures was selected to evaluate maximal concentric and eccentric strength. All dynamic measures started in full relaxation and were initiated with an audible and sensible short and rapid movement of the handle
Concentric strength
Isometric strength
Eccentric strength
MCSA
Cross-sectional area upperarm
MCSA
FA-S AF
UA
FA-E
110°
AF
UA
FA-S
FA-E 110° AF
UA
FA-E
FA-S 110°
Figure 1
Graphical representation of MCSA, isometric, concentric and eccentric strength.
on which the subjects were asked to perform maximal flexion moments ending in 2 s of isometric maximal flexion at the end position of the handle until the handle returned to the starting position.
Measurement of arm muscularity was assessed by computed tomography (CT) techniques. Exact mea-surements of muscle cross-sectional area were determined by CT (Thomis, Claessens, et al., 1997). Starting from mid-humerus position, three scans were done at 3 cm intervals in the direction of the hand with the relaxed arm in 180° flexion. A fourth scan was taken at the second position with the relaxed arm in 150° flexion. Tissue within the limits of –50 Houndsfield Units (HU) and +200 HU was defined as muscle tissue, within –200 to –50 HU as adipose tissue and within +200 to +3071 HU as bone. Technical error of measurement (TEM), measured as the square root of sum (D)2/2N, where D is the differ-ence in scores between two observers (Knapp, 1992), for muscle area was 0.16 cm2with a coefficient of reli-ability (R = 1 – (TEM2/SD2) and interobserver intraclass correlation (ICC) of .99 for all measures (Thomis, Claessens, et al., 1997). The averaged muscle cross-sectional area (both elbow flexors and exten-sors) of four scans was used in further analyses.
Statistical Analysis
Birth-order effects and differences in means or vari-ances between MZ and DZ twins were tested with t
tests and F tests, respectively. Pearson correlations between first- and second-born twins were computed for MZ and DZ twins. Results were considered statisti-cally significant if pwas less than .05.
The biometric approach using path-analytic models was applied to determine the relative contribution of genetic and environmental factors to the observed (co-)variation in CT-evaluated MCSA, maximal eccentric and concentric moment at 110° and 120° s–1and isomet-ric moment. This approach uses linear models to represent hypotheses about causal paths (from latent to observed variables) and correlational paths (between the latent variables) to explain the observed variation in a trait based on observed phenotypes and known relation-ships between these latent variables in genetically related individuals. The latent causal factors can be genetic, with additive (A) or dominance (D) gene action, and environ-mental causes can be shared by twins or family members that are reared in the same family (C, common environ-ment) and nonshared or specific environmental factors (E, also includes random measurement error). The influ-ence of these sources A, D, C and E on the phenotypic variation is given by parameters a, d, cand e, which are equivalent to the standardized regression coefficients of the phenotype (PT1: phenotype Twin 1, PT2: pheno-type Twin 2) on A, D, C and E, respectively (PT1 =aAT1 +cCT1 + dDT1 + eET1 and PT2 =aAT2 + cCT2 + dDT2 + eET2). Squaring the factor loading yields the variance explained by each component (VA = a2, VD = d2, VC = c2, VE = e2). The
contribution of genes and environment to the total vari-ance is reported in the standardized form, by dividing the specific variance component by the total phenotypic variance. In this model, it is also assumed that genetic and environmental factors do not correlate or interact, and that there is no significant parental correlation for these characteristics. Furthermore, in the classical twin design cand dcannot be tested together in one model.
Multivariate Genetic Analyses
Data on Twin 1 and Twin 2 were summarized in 8-by-8 variance–covariance matrices for MZ and DZ twins. The maximum likelihood estimation of parameters a, (d or c) and e was assessed using Mx (Neale, 2004). The goodness-of-fit between the observed measures and the expected values based on the model parame-ters was assessed by a χ2 test. Low χ2 values indicate consistency of the model with the data, while signifi-cant χ2values indicate poor fit. The simplest model is the one in which all variation is explained by the lowest number of parameters. Akaike’s Information Criterion (AIC = χ2 – 2df) combines the goodness-of-fit of a model (the discrepancy between expected and observed covariance matrices) with its simplicity (the degrees of freedom of the model), resulting in a measure of parsimony. The maximum likelihood esti-mates of the parameters of the most parsimonious model were computed. These parameter estimates were expressed in percentages of the total variance explained by genetic and environmental factors. To test whether the same genes influence isometric and dynamic strength at 110° arm flexion, the contribu-tion of genetic and environmental factors to the covariance between elbow flexion torques was esti-mated using multivariate models. Midarm MCSA was also included in this multivariate analysis because this is a key physiological determinant and an important covariate of isometric and dynamic strength (Huygens et al., 2004; Thomis, Van Leemputte, et al., 1997; Thomis et al., 2000).
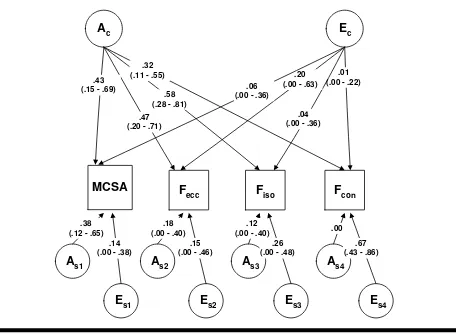
additive genetic (As) factors explained the rest of the variance (summarized as SA E). This independent pathway (IP) model (Figure 2) allows the estimation of the contribution of genetic and environmental factors in an underlying ‘generality factor’ (Ac, Ec). At the same time residual contraction type specific variance is decomposed into ‘specificity factors’ As and Es. A first submodel tested the significance of a specific unique genetic factor (As). A second model limited to the ‘specificity structure’ was tested to explore the signifi-cance of the general factor (SAE; model 3).
Results
Descriptive Statistics
All variables followed a Gaussian distribution except eccentric torque. No differences in means (except for MCSA), variances (SD) and birth-order effects between MZ and DZ twins were found (Table 1).
Correlations between the three strength measure-ments and MCSA ranged from .43 to .64 (Table 1). This implies the possible presence of a general strength factor which explains the covariance between the four variables. The observed intrapair correlations between MZ and DZ twins are presented in Table 1 (within-twin, cross-trait correlations are omitted). Both
trait-specific and bivariate cross-trait MZ correlations varied between .34 and .81. DZ correlations were gen-erally lower than half of the MZ correlations which implies the possible presence of dominant genetic factors (D) as well as additive genes (A) and unique environmental sources (E) of variance to explain the trait-specific and bivariate (co-)variances. However, MZ–DZ intrapair correlations for Fiso (trait specific) and Fiso-Fecc (bivariate cross-trait) suggested no influ-ence of dominance.
Multivariate Genetic Analysis
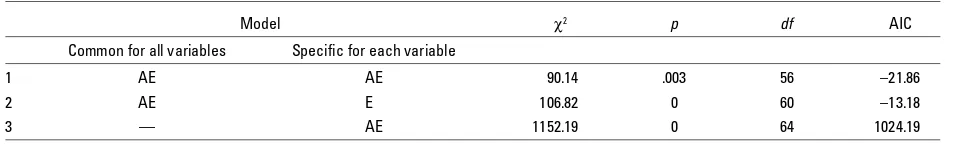
Results of the model-fitting procedure for the multi-variate analysis are presented in Table 2. Generally, the fit of the models is not optimal (high χ2 and AIC values). The ‘specificity model’ AsEs (number 3) gave a bad fit (χ2 = 1152.19, df= 64, AIC = 1024.19) which demonstrates the significance of a general factor in explaining the variance of the four strength pheno-types studied. IP model AcAsEs (number 2) gives a bad fit (χ2 = 106.82, df= 60, AIC = –13.18), indicative of genes being responsible for the variance in each phenotype separately. IP model AcEcAsEs (number 1) provides a good fit and is parsimonious (χ2 = 90.14,
p= .003,df = 56, AIC = –21.86). The contribution of
MCSA
F
con
F
isoF
eccA
s1.38 (.12 - .65)
E
cA
c.01 (.00 - .22)
.47 (.20 - .71) .43
(.15 - .69)
.04 (.00 - .36) .58
(.28 - .81) .32
(.11 - .55) .20
(.00 - .63) .06
(.00 - .36)
E
s1.14 (.00 - .38)
A
s2.18 (.00 - .40)
E
s2.15 (.00 - .46)
A
s3.12 (.00 - .40)
E
s3.26 (.00 - .48)
A
s4.00
E
s4.67 (.43 - .86)
Figure 2
AcEcAsEs model with variance components values of each path in muscle cross-sectional area (MCSA) and the three contraction types.
each path with corresponding 95% confidence inter-vals is expressed as a percentage of explained variance for each phenotype (Figure 2). The heritability of each trait can thus be calculated by summing the contribut-ing variance component of specific and common genes. Heritability was high for MCSA (h2= .43 (A
c) + .38 (As) = .81), eccentric (h2 = .18 (A
c) + .47 (As) = .65), and iso-metric strength (h2 = .12 (A
c) + .58 (As) = .70). Concentric strength on the other hand was less deter-mined by genes (h2 = .00 (A
c) + .32 (As) = .32). The importance of paths Ac and Ec over paths As and Es gives a good indication of the generality versus speci-ficity hypothesis. The contribution of general (Ac + Ec) and specific latent factors (As + Es) to the total variance are 49% and 51% for MCSA, 67% and 33% for Fecc, 62% and 38% for Fiso and 33% and 67% for Fcon, respectively. More in detail, a set of common additive genes explains a large part of the variance within MCSA (ac1= .43), Fecc (ac2 = .47) and Fiso (ac3 = .58) which points to genetic generality (pleiotropic gene action). Genetic effects specific for MCSA explain 38% of the variance (as1= .38) but are less important for Fecc (as2 = .18), Fiso (as3 = .12) and Fcon (as4 = .00). Unique environmental factors seem to play a more important role for Fcon (es4= .67) in comparison to the contribution of a common set of shared genetic or envi-ronmental effects (ac4 = .31, ec4 = .01).
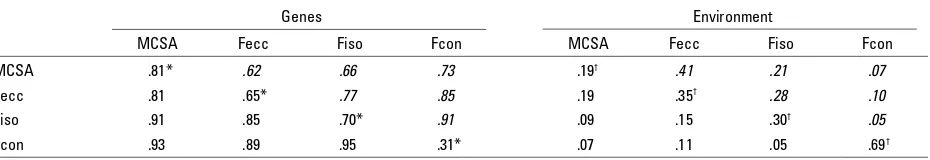
In Table 3, proportions of covariances explained by genetic and environmental factors and genetic/environ-mental correlations were estimated as they contribute to the explanation of the underlying generality hypothe-sis. The covariance in muscle cross-sectional area and the different contraction types was for a large part
explained by genes (covariances ranged from .81 to .95) and to a lesser extent by the environment (.05–.19). This information is in line with the high genetic correlation between the four strength dimen-sions (correlations between .62 and .91), while the environmental correlation between MCSA and the three contraction types are fairly low (correlations between .05 and .41).
Discussion
To our knowledge, this is the first study that has investigated the variances/covariances within and between muscle cross-sectional area, isometric, con-centric and eccon-centric muscle strength using a multivariate design with special focus on the presence of a general cause of variation for all variables under study. A univariate design by contrast can only study one variable at a time and thus cannot investigate evi-dence for a relationship with other traits. The major finding in this study is the presence of a major set of genes common to the strength phenotypes and MCSA referring to an underlying genetic cause of strength generality (Hortobagyi et al., 1989).
The IP AcEcAsEs model was selected as the best model to explain the data. The main reasons for choosing this model were that it fitted the data well, was theoretically plausible, provided evidence for the presence of covariance as described in earlier studies (Akima et al., 2001; Peltonen et al., 1998) and logi-cally followed from previous results of univariate models (Thomis, Beunen, Van Leemputte, et al., 1998; Thomis, Van Leemputte, et al., 1997).
Table 1
Descriptive Statistics (Means and Standard Deviation) for Muscle Cross-Sectional Area (MCSA), Eccentric (Fecc), Isometric (Fiso) and Concentric Strength (Fcon)
Descriptive Pearson correlations Intrapair correlations MZ Intrapair correlations DZ statistics
Mean SD MCSA Fecc Fiso Fcon MCSA Fecc Fiso Fcon MCSA Fecc Fiso Fcon
MCSA cm2 49.3 * 7.4 MCSA 1.00 .81 .34 .51 .38 .01 –.19 –.06 .10
Fecc Nm† 55.0 11.5 Fecc .55 1.00 .50 .69 .75 .46 .18 .09 .13 .02
Fiso Nm 51.2 11.4 Fiso .56 .64 1.00 .66 .42 .76 .42 .27 .24 .34 –.20 Fcon Nm 24.5 7.3 Fcon .43 .49 .50 1.00 .65 .36 .71 .37 .02 –.09 .13 –.13
Note: Cross-trait Pearson correlations. MZ and DZ intrapair correlations. Significant differences in means between MZ and DZ twins (*) and significant (p < .05) deviation from normality (†).
Table 2
Goodness-of-Fit Statistics for Three Alternative Models
Model χ2 p df AIC
Common for all variables Specific for each variable
1 AE AE 90.14 .003 56 –21.86
2 AE E 106.82 0 60 –13.18
A recurrent problem in twin studies is the power to detect small genetic and environmental latent factors as genetic analyses require large samples. This study has enough power to detect a significant contribution of additive genetic factors against a model with only unique environmental contributions. In contrast, small proportions of additional familial environmental factors or genetic dominance in the presence of sub-stantial additive genetic factors would only be detectable in much larger samples. Power simulations were performed to gain an indication of the sample size needed to detect sources of genetic dominance. With the current sample size, a model with additive genes, genetic dominance and unique environment explaining 20%, 70% and 10% of the variance/covariance respec-tively could be detected (power = 25%; Ac = 10%, Dc = 50%, Ec = 5%, As = 10%, Ds = 20%, Es = 5%). On the other hand, detecting only 30% of genetic dom-inance with a power of 80% (Ac = 25%, Dc = 20%, Ec = 10%, As = 15%, Ds = 10%, Es = 20%) would require a sample size of approximately 1925 subjects. The low DZ correlations for MCSA, Fecc and Fcon might be due to sampling error, as in other studies DZ correlations are considerably higher (Arden & Spector, 1997; Ropponen et al., 2004).
The heritability coefficient for MCSA was high (81%) and confirms the findings of previous studies (Loos et al., 1997; Maes et al., 1996; Thomis, Beunen, Maes, et al., 1998; Thomis, Van Leemputte, et al., 1997) with heritabilities ranging from .82 to .95. Two studies on the variation in the musculature of the calf measured by radiographic analysis reported sibling sim-ilarities (rmales= .56, rfemales = .63: preschool age) and MZ intraclass correlations (rmales = .83, rfemales = .85: 12–13 years) which indicate an important genetic contribution to the estimated calf muscle mass (Hewitt, 2005; Hoshi et al., 1982). Genetic factors accounted for 61% of eccentric strength in this study which is consistent with Thomis, Beunen, Van Leemputte, et al. (1998) who found heritabilities between .62 and .82 with the same dataset but at different velocities as compared to the present analyses. For isometric strength (h2 = .70),
several studies reached similar findings (.61–.82; Maes et al., 1996; Perusse et al., 1987; Thomis, Beunen,
Maes, et al., 1998; Thomis, Beunen, Van Leemputte, et al., 1998; Thomis, Van Leemputte, et al., 1997), while others found no evidence for a genetic contribution (Karlsson et al., 1979) or low to moderate heritabilities (.22–.49) in isometric strength (Arden & Spector, 1997; Carmelli & Reed, 2000; Tiainen et al., 2005). Possible explanations for these discrepancies could be (i) a dif-ferent statistical method used for calculating heritabilities (Arden et al., 1997, computed h2based on
correlation analysis where h2 = 2*[rMZ – rDZ]); (ii) a
difference in sample sizes; (iii) sample not representative for the population (Karlsson et al., 1979) or older sub-jects (mean age between 63–76 years; Carmelli & Reed, 2000; Tiainen et al., 2005). Tiainen et al. (2004) com-pared variances in isometric strength for three different muscle groups (handgrip, knee extension and ankle plantar flexion strength). For isometric strength of the knee extensors 68% of the variance was explained by genes, while a CE model fitted best for both other strength characteristics. However, the poorer fitting AE models with higher AIC values showed comparable a2
values of .65 and .72.
Only 32% of the variance in concentric strength was explained by genes. However, Sklad et al. (1992) and Maes et al. (1996) reported results that pointed to a high genetic contribution for concentric strength (.74–.79). Discrepancies between this high genetic contribution and the low contribution of genes in the present study could in part be explained by the use of different strength mea-sures and different contraction speeds.
Unique environmental factors (e.g., nutritional status and physical activity that influence each individ-ual subject specifically) explained the remaining variance (Figure 2) in MCSA and the strength pheno-types. For concentric strength, the importance of the specific environmental factors should be emphasized (.67). Again, different strength measures and a higher contraction speed used in the present study could account for discrepancies with the above studies.
Differences in heritabilities for the three contrac-tion types can be related to the factors that contribute to these differences. Contractile and elastic elements contribute to the force production during eccentric muscle action, while only contractile elements Table 3
Proportions of Covariances and Correlations for MCSA and Three Contraction Types Determined by Genes and Environment and Calculated From Maximum Likelihood Estimations for the IP AcEcAsEs Model
Genes Environment
MCSA Fecc Fiso Fcon MCSA Fecc Fiso Fcon
MCSA .81* .62 .66 .73 .19† .41 .21 .07
Fecc .81 .65* .77 .85 .19 .35† .28 .10
Fiso .91 .85 .70* .91 .09 .15 .30† .05
Fcon .93 .89 .95 .31* .07 .11 .05 .69†
Note: *Sum of Ac and As = total heritability (on diagonal)
†Sum of Ec and Es = total environmentality
contribute to the force production during concentric muscle action (Cress et al., 1992). The genetic compo-nent that explains the variance in concentric arm strength could partially contribute to the variability in contractile proteins and the interindividual variation in muscle fibre distribution in the arm muscles. Heritability values for eccentric muscle torques can be explained by genetic variation in the number of con-tractile proteins (actin and myosin) and genetic variation in the number of passive elastic components like titin and nebulin.
The multivariate design permits to decompose the variances in the four phenotypes in general genetic and environmental factors (Ac and Ec), which are common to these phenotypes, and genes and environ-mental factors specific for each of the phenotypes under study (As and Es). Hortobagyi et al. (1989) studied contrasting athlete populations for eccentric and concentric muscle force at three velocities for simple arm flexion and extension. They argued that intercorrelations higher than .71 would indicate a greater proportion of generality than specificity between modes, velocities and types of movement (r2 × 100 = 50% or greater common variance).
Correlations in our study are lower (.43–.67). Thus, according to Hortobagyi’s theory there would be no evidence for a general strength factor. However, in the multivariate analysis a set of additive genes explains to a large extent the covariance between MCSA and the strength phenotypes (Table 3), while the influence of the environment was obviously lower (5%–19%). The presence of a general strength factor was also tested in the same young adults for MCSA and isometric torques in three different angles (Thomis, Van Leemputte, et al., 1997). A general genetic factor explained 41% to 83% of the variance in these different torques and MCSA. The residual variance was mainly explained by unique environmental factors having a specific influence on each variable separately (17%–24%). The covariance between the four variables was mainly caused by genetic factors (86%–97%), while environmental factors explained only 3% to 14% of the covariance. A common genetic component which accounted for 32% of the total variance in leg extension power and 48% in knee isometric strength was shown by Tiainen et al. (2005). Both variables had a nonshared environmental effect in common accounting for 4% of the variance in power and 52% in strength. Remaining variance for leg extensor power was due to trait-specific shared and nonshared environmental effects. In the present study, the relative importance of generality versus specificity for each phenotype was calculated by summing AC+ EC and AS+ ES, respectively. We demonstrate that general latent factors (AC+ EC) play a major role in explaining the variance in Fecc (67%) and Fiso (62%), while 67% of the variance in Fcon was explained by the specificity factors (AS + ES). An equal contribution of generality and specificity factors was demonstrated for MCSA (49% and 51%, respectively).
Knowledge of the underlying pleiotropic action of genes and environmental causes of (co-)variation is useful in the study of determinants for strength-related sports performance and health status of the general public. Baker et al. (2001) found significant differ-ences in upper-body strength and power between professional and college-aged rugby players. They pos-tulated that these differences may be ascribed, at least partially, to the significantly greater training experi-ences (environment) of the professional players. Differences in exercise behavior are often included in the ‘general environment’, although this is also deter-mined by genetic factors that might in part be ‘fitness/ability’-related (Beunen & Thomis, 1999; Stubbe et al., 2005) and therefore in part share the same underlying genetic factors. Additionally, results of our study suggest the presence of a common set of underlying genes explaining the major part of the vari-ance. Some of these genes, however, might therefore not have a direct causal impact on the variance of the different muscle strength phenotypes, but an indirect effect via exercise behavior which in turn predisposes subjects to generate more or less muscle strength (genotype–exercise correlation and genotype–environ-ment interaction effects). Some gene variants causing variance in muscle strength do not necessarily have an impact on biomechanical and physiological structures of the muscle, but might provide subjects with a genetic advantage towards exercise behavior, nutrition and other health benefits which results in stronger muscles. Furthermore, the genetic advantage of some subjects to generate more muscle strength might encourage them to engage in regular sports participa-tion which further amplifies this genetic advantage. Within our study design, twin pairs were included if they had similar within-pair physical activity profiles, and therefore might have induced a higher than expected DZ within-pair similarity compared to the general population, which might introduce some common environmental effects in exercise behavior within this sample.
factor) were sampled to avoid inducement of differ-ences in the environment at the start of the study.
Furthermore, the choice of a fast dynamic contrac-tion type (120° s–1) does not really represent a true explosive contraction and therefore results might not be generalized to all explosive concentric and eccen-tric contractions.
In summary, within the limitations of the sample size, as part of a training protocol, our findings suggest that muscle cross-sectional area, eccentric, iso-metric and to a lesser extent concentric strength are high genetically determined characteristics of the human body and are therefore an important domain of interest to localize the responsible genes. High genetic correlations between the four phenotypes under study suggested shared (pleiotropic) gene action. Further research should be conducted to explore which genes are responsible for the variance in these four phenotypes and which specific polymor-phisms cause strength differences in the population. The search for specific gene variants is currently in progress in a large sib-pair study (Huygens et al., 2005) and in training intervention studies (Roth et al., 2003; Thompson et al., 2004). However, the present results emphasize the possibilities to test for the effects of QTLs and specific polymorphisms in a pleiotropic action by analyzing multivariate models including both MCSA and different contraction type strength measures, which might profit from increased power (Boomsma, 1997).
Acknowledgments
This study was supported by grant OT/92/27 of the Research Fund of the Katholieke Universiteit Leuven. Gunther De Mars is supported by grant G.0496.05 of the Foundation for Scientific Research — Flanders.
References
Akima, H., Kano, Y., Enomoto, Y., Ishizu, M., Okada, M., Oishi, Y., Katsuta, S., & Kuno, S. (2001). Muscle function in 164 men and women aged 20–84 yr.
Medicine and Science in Sports and Exercise, 33,
220–226.
Arden, N. K., & Spector, T. D. (1997). Genetic influences on muscle strength, lean body mass, and bone mineral
density: A twin study. Journal of Bone Mineral
Research, 12,2076–2081.
Baker, D. (2001). Comparison of upper-body strength and power between professional and college-aged rugby
league players. Journal of Strength and Conditioning
Research, 15, 30–35.
Beunen, G., & Thomis, M. (1999). Genetic determinants of sports participation and daily physical activity.
International Journal of Obesity and Related Metabolic Disorders, 23(Suppl. 3),55–63.
Beunen, G., & Thomis, M. A. (2000). Muscular strength
development in children and adolescents. Pediatric
Exercise Science, 12,174–197.
Boomsma, D. I. (1997). Using multivariate modeling to
detect pleiotropic quantitative trait loci. Behavior
Genetics, 26,161–166.
Carmelli, D., & Reed, T. (2000). Stability and change in genetic and environmental influences on hand-grip
strength in older male twins. Journal of Applied
Physiology, 89,1879–1883.
Cress, N. M., Peters, K. S., & Chandler, J. M. (1992). Eccentric and concentric force-velocity relationships of
the quadriceps femoris muscle. Journal of
Orthopaedic and Sports Physical Therapy, 16,82–86. Fisher, A. L. (2004). Of worms and women: Sarcopenia
and its role in disability and mortality. Journal of the
American Geriatrics Society, 52,1185–1190.
Fujita, Y., Nakamura, Y., Hiraoka, J., Kobayashi, K., Sakata, K., Nagai, M., & Yanagawa, H. (1995). Physical-strength tests and mortality among visitors to
health-promotion centers in Japan. Journal of Clinical
Epidemiology, 48,1349–1359.
Hewitt, D. (2005). Sib resemblances in bone, muscle and
fat measurements of the calf.Human Genetics, 22,
213–221.
Hortobagyi, T., & Katch, F. I. (1999). Eccentric and con-centric torque-velocity relationships during arm
flexion and extension. European Journal of Applied
Physiology, 60,395–401.
Hortobagyi, T., Katch, F. I., & LaChance, P. F. (1989). Interrelationships among various measures of upper body strength assessed by different contraction modes.
Evidence for a general strength component. European
Journal of Applied Physiology and Occupational Physiology, 58,749–755.
Hoshi, H., Ashizawa, K., Kouchi, M., & Koyama, C. (1982). On the intra-pair similarity of Japanese monozygotic twins in some somatological traits.
Okajimas Folia Anatomica Japonica, 58,675–686. Hulens, M., Vansant, G., Lysens, R., Claessens, A. L.,
Muls, E., & Brumagne, S. (2001). Study of differences in peripheral muscle strength of lean versus obese
women: An allometric approach. International
Journal of Obesity and Related Metabolic Disorders,
25,676–681.
Huygens, W., Thomis, M. A., Peeters, M. W., Aerssens, J., Vlietinck, R., & Beunen, G. P. (2005). Quantitative trait loci for human muscle strength: Linkage analysis
of myostatin pathway genes. Physiological Genomics,
22, 390–397.
Huygens, W., Thomis, M. A., Peeters, M. W., Vlietinck, R. F., & Beunen, G. P. (2004). Determinants and upper-limit heritabilities of skeletal muscle mass and
strength. Canadian Journal of Appied Physiology, 29,
186–200.
Karlsson, J., Komi, P. V., & Viitasalo, J. H. T. (1979). Muscle strength and muscle characteristics in
monozy-gous and dizymonozy-gous twins. Acta Physiologica
Knapp, T. R. (1992). Technical error of measurement: A
methodological critique. American Journal of Physical
Anthropology, 87,235–236.
Landers, K. A., Hunter, G. R., Wetzstein, C. J., Bamman, M. M., & Weinsier, R. L. (2001). The interrelation-ship among muscle mass, strength, and the ability to perform physical tasks of daily living in younger and
older women. Journals of Gerontology Series A:
Biological Sciences and Medical Sciences, 56,
B443–B448.
Loos, R., Thomis, M., Maes, H. H., Beunen, G., Claessens, A. L., Derom, C., Legius, E., Derom, R., & Vlietinck, R. (1997). Gender-specific regional changes in genetic structure of muscularity in early
adoles-cence. Journal of Applied Physiology, 82,1802–1810.
Maes, H. H. M., Beunen, G. P., Vlietinck, R. F., Neale, M. C., Thomis, M., Vanden Eynde, B., Lysens, R., Simons, J., Derom, C., & Derom, R. (1996). Inheritance of physical fitness in 10-year-old twins and
their parents. Medicine and Science in Sports and
Exercise, 28,1479–1491.
Neale, M. C. (2004). Mx: Statistical modeling(7th ed.).
Richmond, VA: Department of Psychiatry, Medical College of Virginia.
Payne, N., Gledhill, N., Katzmarzyk, P. T., Jamnik, V., & Ferguson, S. (2000). Health implications of
muscu-loskeletal fitness. Canadian Journal of Applied
Physiology, 25,114–126.
Peeters, M. W., Thomis, M. A., Maes, H. H. M., Beunen, G. P., Loos, R. J. F., Claessens, A. L., & Vlietinck, R. (2005). Genetic and environmental determination of
tracking in static strength during adolescence. Journal
of Applied Physiology, 99, 1317–1326.
Peeters, M. W., Thomis, M., Maes, H., Loos, R., Claessens, A. L., Vlietinck, R., & Beunen, G. P. (2005). Genetic and environmental causes of tracking
in explosive strength during adolescence. Behavior
Genetics, 35, 551–563.
Peltonen, J. E., Taimela, S., Erkintalo, M., Salminen, J. J., Oksanen, A., & Kujala, U. M. (1998). Back extensor and psoas muscle cross-sectional area, prior physical training, and trunk muscle strength — A longitudinal
study in adolescent girls. European Journal of Applied
Physiology and Occupational Physiology, 77,66–71. Perusse, L., Luoni, G., Leblanc, C., Tremblay, G.,
Thériault, G., & Bouchard, C. (1987). Genetic and environmental sources of variation in physical fitness.
Annals of Human Biology, 14,425–434.
Rantanen, T., Masaki, K., Foley, D., Izmirlian, G., White, L., & Guralnik, J. M. (1998). Grip strength changes
over 27 yr in Japanese–American men. Journal of
Applied Physiology, 85,2047–2053.
Rhodes, E. C., Martin, A. D., Taunton, J. E., Donnelly, M., Warren, J., & Elliot, J. (2000). Effects of one year of resistance training on the relation between muscu-lar strength and bone density in elderly women.
British Journal of Sports Medicine, 34,18–22.
Ropponen, A., Levalahti, E., Videman, T., Kaprio, J., & Battie, M. C. (2004). The role of genetics and environ-ment in lifting force and isometric trunk extensor
endurance. Physical Therapy, 84,608–621.
Roth, S. M., Martel, G. F., Ferrell, R. E., Metter, E. J., Hurley, B. F., & Rogers, M. A. (2003). Myostatin gene expression is reduced in humans with heavy-resistance strength training: A brief communication.
Experimental Biology and Medicine, 228,706–709. Rutherford, O. M. (1999). Is there a role for exercise in
the prevention of osteoporotic fractures? British
Journal of Sports Medicine, 33,378–386.
Stubbe, J. H., Boomsma, D. I., & De Geus, E. J. (2005). Sports participation during adolescence: A shift from
environmental to genetic factors. Medicine and
Science in Sports and Exercise, 37,563–570.
Thomis, M. A., Beunen, G. P., Maes, H. H., Blimkie, C. J., Van Leemputte, M., Claessens, A. L., Marchal, G., Willems, E., & Vlietinck, R. F. (1998). Strength
train-ing: Importance of genetic factors. Medicine and
Science in Sports and Exercise, 30,724–731.
Thomis, M. A. I., Beunen, G. P., Van Leemputte, M., Maes, H. H., Blimkie, C. J., Claessens, A. L., Marchal, G., Willems, E., & Vlietinck, R. F. (1998). Inheritance of static and dynamic arm strength and some of its
determinants. Acta Physiologica Scandinavica, 163,
59–71.
Thomis, M., Claessens, A. L., Vlietinck, R., Marchal, G., & Beunen, G. (1997). Accuracy of anthropometric estimation of muscle cross-sectional area of the arm in
males. American Journal of Human Biology, 9,73–86.
Thomis, M., Van Leemputte, M., Maes, H., Blimkie, C. J. R., Claessens, A. L., Marchal, G., Willems, E., Vlietinck, R. F., & Beunen, G. P. (1997). Multivariate genetic analysis of maximal isometric muscle force at
different elbow angles. Journal of Applied Physiology,
82,959–967.
Thomis, M. A., Vlietinck, R. F., Maes, H. H., Blimkie, C. J., Van Leemputte, M., Claessens, A. L., Marchal, G., & Beunen, G. P. (2000). Predictive power of
individ-ual genetic and environmental factor scores. Twin
Research, 3,99–108.
Thompson, P. D., Moyna, N., Seip, R., Price, T., Clarkson, P., Angelopoulos, T., Gordon, P., Pescatello, L., Visich, P., Zoeller, R., Devaney, J. M., Gordish, H., Bilbish, S., & Hoffman, E. P. (2004). Functional poly-morphisms associated with human muscle size and
strength. Medicine and Science in Sports and Exercise,
36,1132–1139.
Tiainen, K., Sipila, S., Alen, M., Heikkinen, E., Kaprio, J., Koskenvuo, M., Tolvanen, A., Pajala, S., & Rantanen, T. (2005). Shared genetic and environmental effects on
strength and power in older female twins. Medicine
and Science in Sports and Exercise, 37,72–78. Tiainen, K., Sipila, S., Alen, M., Heikkinen, E., Kaprio, J.,
strength in older female twins. Journal of Applied Physiology, 96,173–180.
Vande Broek, G., Van Leemputte, M., Andries, R., & Willems, E. J. (1995). Mechanical muscle properties after two types of plyometric training. In A. Barabas
& G. Y. Fabian (Eds.), Biomechanics in sports (pp.
98–101). Budapest, Hungary: ITC Plantin.
Vlietinck, R. (1986). Determination of the zygosity of