DOI: 10.12928/TELKOMNIKA.v14i1.2754 622
Object Recognition Based on Maximally Stable
Extremal Region and Scale-Invariant Feature Transform
Hongjun Guo1*, Lili Chen1,2
1Laboratory of Intelligent Information Processing, Suzhou University, Suzhou 234000, China 2
The Key Laboratory of Intelligent Computing & Signal Processing of MOE, Anhui University, Hefei 230039, China
*Corresponding author, e-mail: [email protected]
Abstract
For the defect in describing affine and blur invariable of scale-invariant feature transform (SIFT) at large viewpoint variation, a new object recognition method is proposed in this paper, which used maximally stable extremal region (MSER) detecting MSERs and SIFT describing local feature of these regions. First, a new most stability criterion is adopt to improve the detection effect at irregular shaped regions and under blur conditions; then, the local feature descriptors of MSERs is extracted by the SIFT; and finally, the method proposed is comparing then correct rate of SIFT and the proposed through image recognition with standard test images. Experimental results show that the method proposed can still achieve more than 74% recognition correct rate at different viewpoint, which is better than SIFT.
Keywords: Maximally Stable Extremal Region, SIFT, Object Recognition, Local Feature
Copyright © 2016 Universitas Ahmad Dahlan. All rights reserved.
1. Introduction
In the object recognition with complicated background or occlusion, local feature is better than global feature in stability, repeatability and authenticability and it has been widely applied in image matching, machine vision and other fields in recent years. This paper mainly makes in-depth research to the detection and description of local region feature.
Scale-invariant feature transform (SIFT) [1] algorithm has excellent scale invariance and rotation invariance in feature point extraction in linear scale space and the main direction of local gradient distribution, but it has no affine invariance. Compared with blotch feature, the region detection methods proposed in recent years are applicable to the feature region detection of various shapes and it can preserve excellent invariance even when the view-angle changes greatly. Literature [2] has made comparative analysis in such methods as SIFT, Harris-Affine, Hessian-Affine and maximally stable extremalregion (MSER) [3] region detection which is proposed by Matas and the result shows that MSER has the best detection effects in recognizing gray-level consistency region with strong boundaries to be recognized, view-angle changes and light variation; that when the image scale changes, MSER follows only after Hessian-Affine and that when the image is fuzzy, MSER is the most non-ideal in performance. The research result of Literature [4] shows that SIFT has better description effect in plane objects, but MSER has excellent description effect in most natural scenes.
2. Detection of Maximally Stable Extremal Regions
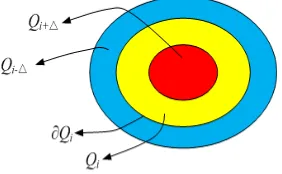
Different from the corner detection in last section, MSERs uses a concept similar to watershed to obtain the locally stable regions. The watershed algorithm in image processing is mainly used in image segmentation and it focus on the “water level”(image gray-level) when the regions merge, but the region areas are not stable while MSERs focus on the “water level” when the regions are stable. When the “water level” changes and the change rate of the area of this region is the minimum, the region formed this time is the maximally stable. This is also the typical region stability recognition method and its procedures are indicated as Figure1.
Figure 1. The relationship between MSERs
Here,Qi , Qiand Qiare a series of inter-embracing extremal regions. Qi is the region obtained in the threshold segmentation with the gray-level to be i; is the tiny gray-level change and Qi is the boundary of the extremal region Qi. Assuming that Points x and y are any pixels in the regions Qi and Qi, when the gray-levels I x( ) and I y( ) of Points x and
y, then Region Qi is the extremal region. When it meets formula (1)(a), it is called the maximally extremal region and when it meets formula (1)(b), it is the minimally extremal region.
( ) ( ) ( )
The determination condition of MSER is defined as the ratio of the area of the extremal region and the area change rate, which is indicated as formula (2). When changes and when the change rate of the extremal region is the minimum, then this region is the stable region. When (Qi) obtains the maximum value at the grey-level of i, then the corresponding region
is the locally maximally stable extremal region.
( )
Because the change rate of the region area is defined as the extremity of the difference of two region areas. For these two inter-bracing regions, the extremity of the difference of these two areas is equal to the integral of the boundary curve, namely that the denominator of formula (2) can also be shown as follows:
Assuming that the grey-level change in the region boundary is constant C and that
region change rate is the function of the boundary perimeter, namely d S Q( i) 1 L Q( i)
di C , the
detection rule formula (2) of MSER is the ratio of the region area and perimeter, namely:
The form of the formula above is similar to the shape factor 4 2S L
with a value range of
(0, 1). When it is 1, it means the form is a regular shape, i.e. circle and rectangle. For two regions which have the same area and the same gray-level change in their region boundaries, the smaller the region boundary perimeter is, the bigger the value of 1 is. Therefore, the traditional MSER detection rule tends to detect the regions with regular shapes; however, in the object matching, the useful feature regions usually have irregular shapes. For example, the camouflage coatings of the military objects and the airline logos in the civil aircrafts are all irregular in shape; however, these regions have high authenticity and they are good for object matching and recognition. On the other hand, when the image is fuzzy, the affine invariance of MSER falls. Therefore, Kimmel and others [8] have brought forth a new MSER detection operator in improving the determination criteria of the stability of extremal regions and it overcomes the defects of the traditional MSER detection algorithm and has excellent transform invariance. This paper uses MSER detection algorithm proposed by Kimmel to detect the local feature regions.
Literature [9] points out that SIFT algorithm is based on the detection feature point of linear scale space, which although has scale invariance, but it is not affine invariant; therefore, the author detects MSERs in the curvature scale space. Since the interesting regions with stronger distinguishing ability usually have irregular shapes and 1 tends to detect the MSER regions with regular shapes, to use the rule of the ratio of the arc length and the area of the region to detect the shape have weaker regular regions, as indicated as formula (5). Here,
( i)
Considering the actual imaging, the point spread function of the camera performs certain smooth blurring on the actual scenes and to use 1 detection rule has blurring invariance. Although to use the rule of 2 can still obtain excellent detection effect when the image is fuzzy, normalized processing is still needed to be performed in the image. To use the determination method indicated as formula (6) to perform the maximally stable determination not only has the advantages of 2 and better detection effects in affine transformation and image blurring, but it also doesn’t need to conduct normalized processing.
3. Scale Invariant Feature Transform (SIFT)
SIFT algorithm is made up of four steps: scale space extremum detection, key points location, gradient principal direction determination and key points description [10]. This paper replaces the scale space extremum detection of SIFT with MSER detection method and obtains the extremal region with better affine invariance and blurring invariance. The image ellipse from the extremal region determined by the second-order moments of the image has the same statistic features as the original extremal region; therefore, the ellipse center is taken as the key point. The image ellipse is defined as follows:
Here, pq is the second-order central moment of the image. I1 and I2 are the primitive inertia moments, which are defined as follows:
1
2 2 2
20 02 20 02 11
1
( ) ( ) 4
2
I (9)
1
2 2 2
20 02 20 02 11
2
( ) ( ) 4
2
I (10)
In the key points, calculate the gradient direction distribution and the statistical gradient histogram. Take the corresponding direction to the peak value of the gradient histogram as the main direction of this extremal region [11]. The gradient magnitude and direction of region
( , )
Q x y are determined by the following formulas:
2
2( , ) ( 1, ) ( 1, ) ( , 1) ( , 1)
M x y Q x y Q x y Q x y Q x y (11)
( , )x y arctan Q x y( , 1) Q x y( , 1) /Q x( 1, )y Q x( 1, )y
(12)
Rotate the extremal region to the principal direction in order to obtain of rotation invariance of the descriptor. With the key point as the center, calculate the gradient direction and magnitude within its 8x8 neighborhood and calculate the gradient histogram in 8 directions in the 4x4 segments by using Gaussian weight. Accumulate the value in every gradient direction and form a seed point. Every seed point includes 8 directions. Obtain 128-dimensional vector and the process can be indicated as follows:
Figure 2. SIFT descriptor
4. Experiment Result and Analysis 4.1. MSER Detection
This paper mainly tests the stability of MSER detection algorithm which uses different stability judgment standard in affine transformation, light change and image blurring and this experiment uses the repeatablity of the feature region as the judgment standard. Assume that Points xa and xb in the feature region of Images a and b meet the condition of xa Hxb. Here, H is the transformation matrix of these two images and it is the unit matrix in the light change and blurring change. The overlapping error of the feature region is defined as follows:
( )
( )
1
T
a b
T
a b
H H
o
H H
R R
R R
(13)
Here, R is the detected ellipse region of feature region fitting; is the covariance matrix to define the ellipse; and are the union set and intersection set of the ellipse region and o is the overlapping error. The ratio of the matching point set S of the two images
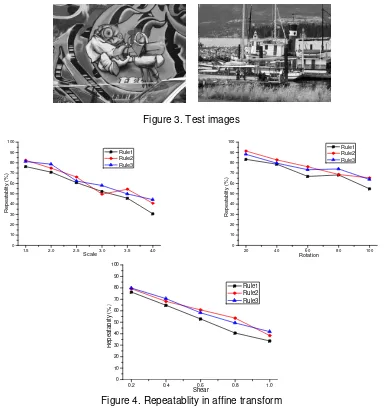
Since the transformation matrix among the images view-angles shot in reality is unknown, there is certain error in the transformation matrix obtained by the image registration methods and it affects the estimation of the overlapping error; therefore, this paper uses the method in Literature [12] which uses the preset transformation matrix to perform affine transform on the image, detects the feature regions on the transformed image, calculates the overlapping error and overcomes the error brought by artificial registration. Affine transform is decomposed into shear transformation, anisotropy scaling transformation and rotation transformation and described by four parameters. In the scaling transformation, this paper assumes that the scale factors of two directions are the same that it simplifies four parameters to three parameters. By fixing the two of the three parameters to change the 3rd parameter, it detects the repeatability in different affine transforms. The test image used in the experiment is shown as Figure 3, when the overlapping error o is smaller than 50%, these two regions are deemed matched and it
only considers the detected regions of these two images. Figure 4 and 5 are the repeatability curves in different affine transform, light transform and blurring. Among these curves, the blurry image is obtained from the convolution of the Gaussian functions with different variances.
Figure 3. Test images
Figure 5. Repeatablity in different light and blurring
Detection result of 1
Detection result of 3
Figure 6. MSER detection result by 1and 3
In Figure 5, Rule1, Rule2 and Rule3 use 1, 2 and 3 as the bases to judge the stability. It can be seen from Figure 4 and 5, these three methods all have good affine
10 20 30 40 50 0
10 20 30 40 50 60 70 80 90
R
epea
ta
blit
y
(%
)
Illumination Rule1 Rule2 Rule3
2 3 4 5 6
0 10 20 30 40 50 60 70 80 90
Re
peata
b
lity
(%)
Blur
invariance and light invariance. The methods by 2 and 3 can still obtain over 40% repeatability after amplifying the images by 4 times; when the image is fuzzy, the repeatablity of the method by 1 falls quickly while the methods by 2 and 3 as the stability judgment standard have higher repeatability than that by 1. Since to use 2 to judge the stability needs to perform normalized processing on the image; therefore, the method by 2 is better than that by 3; however, the detection by 3 doesn’t need normalized processing. Figure 6 compares the MSER detection and ellipse fitting result of 1 and 3 in the affine transform and image blurring.
In Figure 6(a) and (b), the 1st column is the detection result of the original image; the 2nd column is the image under the view-angle changes of the standard test image and the 3rd column is the detection result after Gaussian function with a variance of 10 blurs the original images. It can be seen from the detection result that the method by 3 removes the unstable extremal region in the image, obtains a more stable detection result than that by 1and still gets excellent detection effects in fuzzy transform.
4.2. The Image Recognition Integrating MSER and SIFT
This section uses the method of this paper and the local feature extraction method described by SIFT to match the standard test images, uses Euclidean distance to perform similarity measurement on the feature vector of these two images and in order to eliminate the error matching pair caused by the image occlusion or background information, it uses the method to compare the nearest neighbor distance and the next nearest neighbor distance proposed by Lowe and eliminate the error matching pair. Assuming that the feature to be matched is CA, its nearest feature is CB and the next nearest feature is CD, the condition to judge the feature matching is:
2
2
A B
A D
C C
t
C C
(15)
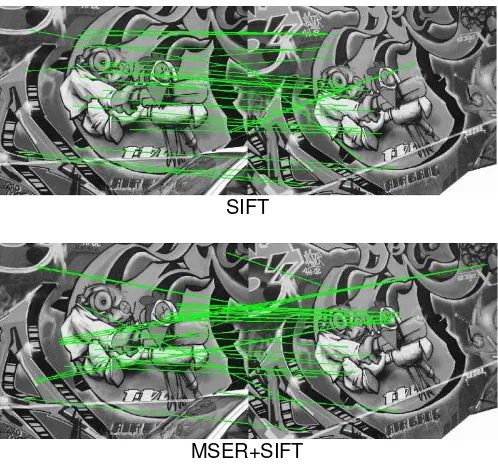
Here, t is the matching threshold and it is 0.6 in this paper. Figure 7 is the matching result, only shows the 30 matching pairs with the highest match scores, and Table 1 is the statistic of the result.
SIFT
MSER+SIFT
Table 1. Statistic of Matching Result
Local Feature Matching/Pair Accurate Matching/Pair Accuracy
(%)
SIFT 901 731 81.13
MSER+SIFT 1144 953 83.30
It can be seen from the statistic of the matching result in Table 1 that the local feature extraction method based on MSER and SIFT this paper proposes for the standard test image in the view-angle changes is better than the method of SIFT in the matching pairs and accurate matching pairs of feature points.
5. Conclusion
This paper uses the improved maximally stable region judgment standard to detest the local MSER regions. Compared with the traditional methods, the method of this paper is more stable in the detection effect and it still has excellent detection effects for the irregular regions. It takes MSER region as the objective local region feature. The method based on SIFT describes the MSER regions which are detected and constructs the local feature descriptor. The method of Gaussian function weight considers the influence of different pixels play on the central pixel and improves the stability and it is applicable for the object matching in the view-angle change.
Acknowledgements
This work was supported by Open Project of Intelligent Information Processing Lab at Suzhou University of China (No.2013YKF17), Horizontal Project at Suzhou University of China (No.2015hx025) and Quality project of Anhui Province: Software engineering teaching team (2015jxtd041).
References
[1] Lowe DG. Distinctive Image Features from Scale-Invariant Keypoints. International Journal of Computer Vision. 2004; 60(2): 91-110.
[2] Mikolajczyk K, Tuytelaars T, Schmid C, et al. A Comparison Of Affine Region Detectors. International Journal of Computer Vision. 2005; 65(1): 43-72.
[3] Matas J, Chum O. Robust Wide-baseline Stereo from Maximally Stable Extremal Regions. British Machine Vision Computing. 2002; 22(10): 761-767.
[4] Per-Erik Forssen, David G Lowe. Shape Descriptors for Maximally Stable Extremal Regions. IEEE International Conference on Computer Vision. 2007: 1-8.
[5] Mikolajczik K, Schmid C. A Performance Evaluation of Local Descriptors. IEEE Transactions on Pattern Analysis & Machine Intelligence. 2005; 27(10): 1615-1630.
[6] Hu J, Peng X, Fu C. A Comparison of Feature Description Algorithms. Optik-International Journal for Light and Electron Optics. 2015; 126: 274-278.
[7] Fan B. Rotationally Invariant Descriptors using Intensity Order Pooling. Pattern Analysis and Machine Intelligence, IEEE Transactions. 2012; 34(10): 2031-2045.
[8] C Zhu, D Huang, CE Bichot, Y Wang, L Chen. HSOG: A Novel Local Descriptor Based on Histograms
of Second Order Gradients for Object Categorization. Proc. of ACM International Conference on
Multimedia Retrieval (ICMR). 2013: 199-206,
[9] Zhang C, Bronstein AM, Kimmel R, et al. Are MSER Features Really Interesting?. IEEE Transactions on Software Engineering. 2011; 33(11): 2316 - 2320.
[10] Yueqiu Jiang, Yiguang Cheng, Hongwei Gao. Improved Characters Feature Extraction and Matching Algorithm Based on SIFT. TELKOMNIKA Indonesian Journal of Electrical Engineering. 2014; 12(1): 334-343.
[11] Quan Sun, Jianxun Zhang. Parallel Research and Implementation of SAR Image Registration Based on Optimized SIFT. TELKOMNIKA Indonesian Journal of Electrical Engineering. 2014; 12(2): 1125-1131.