135
COMPARISON OF FEATURE EXTRACTORS FOR
REAL-TIME OBJECT DETECTION ON ANDROID SMARTPHONE
1KHAIRULMUZZAMMIL SAIPULLAH, 2NURUL ATIQAH ISMAIL, 3AMMAR ANUAR,
4
NURAISHAH SARIMIN
1Lecturer, Faculty of Electronic and Computer Engineering, Universiti Teknikal Malaysia Melaka
2Student, Faculty of Electronic and Computer Engineering, Universiti Teknikal Malaysia Melaka
3Student, Faculty of Electronic and Computer Engineering, Universiti Teknikal Malaysia Melaka
4
Lecturer, Faculty of Electronic and Computer Engineering, Universiti Teknikal Malaysia Melaka
E-mail: [email protected] , [email protected]
, [email protected] , [email protected]
ABSTRACT
This paper presents the analysis of real-time object detection method for embedded system particularly the Android smartphone. As we all know, object detection algorithm is a complicated algorithm that consumes high performance hardware to execute the algorithm in real time. However due to the development of embedded hardware and object detection algorithm, current embedded device may be able to execute the object detection algorithm in real-time. In this study, we analyze the best object detection algorithm with respect to efficiency, quality and robustness of the algorithm. Several object detection algorithms have been compared such as Scale Invariant Feature Transform (SIFT), Speeded-Up Feature Transform (SuRF), Center Surrounded External (CenSurE), Good Features To Track (GFTT), Maximally-Stable External Region Extractor (MSER), Oriented Binary Robust Independent Elementary Features (ORB), and Features from Accelerated Segment Test (FAST) on the GalaxyS Android smartphone. The results show that FAST algorithm has the best combination of speed and object detection performance.
Keywords: Android, Computer Vision, Embedded Hardware, Mobile Application. OpenCV
1. INTRODUCTION
As we all know, an embedded device does not utilize high performance hardware since most of the embedded devices are powered by batteries. So, most of the embedded devices are unable to execute complicated computation such as object detection algorithm that consumes a lot of steps and loops. However, lately, the revolution of smartphone has changed the composition of hardware for embedded device. The processor becomes wider with more cores and faster even with smaller power consumption.
In previous days, only mobile phone company can develop its mobile application. The advent of Smartphone – the combination between the personal digital assistant (PDA) and mobile phone has totally changed this old concept. Since the launch of the Android operating system (OS) [1] in 2007, mobile development has been high in demand
[2]. Android is developed by Google and is based upon the Linux kernel and GNU software.
Since the development of Scale Invariant Feature Transform (SIFT) [3],the world have shift the focus from matching filter based object detection to keypoint matching based object detection method. Due to the robust performance of SIFT, the object detection algorithm is more focusing to invariant keypoint matching based object detection methods. Since then, there are a lot of similar concept object detection algorithms are born such as the Speeded-Up Feature Transform (SuRF), Center Surrounded Extrema (CenSurE), Good Features To Track (GFTT), Maximally-Stable Extremal Region Extractor (MSER), Oriented Binary Robust Independent Elementary Features (ORB), and Features from Accelerated Segment Test (FAST) [4-9].
136 robustness of the object detection algorithm. Some of the tests that are conducted are the speed per frame test, features count test, repeatability test, and error rate test in various illuminations and view angles. All of the experiments are conducted on Samsung’s GalaxyS smartphone that is powered by 1 GHz ARM Cortex-A8 processor running with Android 2.3 Gingerbread OS.
This paper is organized as follows: in section 2, related works of object detection methods are discussed. Section 3 illustrates the methodology implemented and Section 4 shows the results obtained and the analysis performed. Finally, Section 5, the conclusions are presented.
2. RELATED WORKS
Object detection and recognition is becoming one of the major research areas in computer vision. Many applications are widely use especially in human-computer interaction, visual surveillance, robot navigation and many more. Object detection is use to detect the main point of object in an image. Generally, object detection is divided into three stages. In the first stage, representation of feature requiring for object recognition is examined based on local or global image information. Local image is for detecting object in certain part and global image is use to detect object in general image. Second stage is classification of image based on extracted features. The last stage is recognition of the new image based on learning machine which is performed using training images.
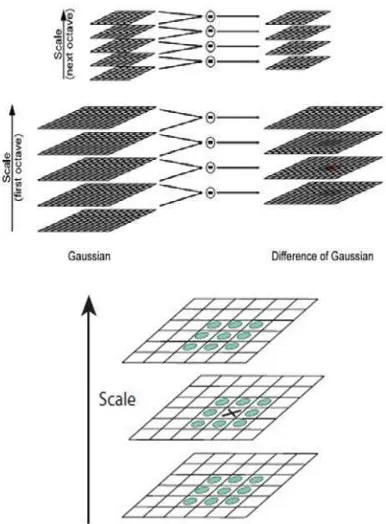
The first step of object recognition is feature extraction that is used to detect the interest point of the image.The Scale-Invariant Feature Transform (SIFT) method is use to detect feature local image. SIFT is invariant to image scale, noise and illumination. SIFT algorithm can be divided into four feature information stage which are scale-space extrema detection, keypoint localization, orientation assignment and keypoint descriptors. The scale-space extrema detection is used to detect the interest point and also known as keypoint. Then the image will convolve with Gaussian filter with different scales of image. Keypoint is taken from the maxima or minima of Difference of Gaussian (DoG) as shown in Fig. 1. The second stage is keypoint localization. Among the keypoint candidates, the selection is made by using the comparison between each pixel. In orientation invariant, each pixel is assign on local image gradient direction. The last stage is keypoint descriptor which is used to find the location of the objects with different orientation and scale. The
keypoint descriptor is invariant to the image location, scale and rotation. The SIFT utilizes Harris corner detector and have a good performance but not effective due to real-time of object recognition because expansion computation of the feature detection and keypoint descriptor [3].
Fig. 1: The Process To Extract DOG Values
For the faster feature matching, Speed up Robust Feature (SURF) algorithm has a similar performance with SIFT but is much faster than SIFT. SURF builds image pyramid and does filtering for each layer with Gaussian of increasing sigma by taking the difference between the layers. Since image pyramid are used in the multi-resolution image, the Gaussian of different scale is made using a constant filter size. SIFT looks for extrema in Difference of Gaussian filtered versions of an image. This computation is done for many image sizes, or octaves, and with a variety of different strength blurs, or scales. Simplified scale-space extreme detection in SURF algorithm speed up feature extraction speed, therefore it is being faster than SIFT. SURF algorithm also has difficulties to produce real-time object recognition [3] in smartphones.
137 utilize the descriptor. Even though the FAST corner is 10 times faster than those of SIFT and SURF, it is able to get accurate interest point information. FAST corner detector is possible to recognize simple markers using template matching because affine transformations (changes in scale, rotation and position) are limited in such a case. FAST detector is less applicable for object detection and recognition because it reduces the time for feature extraction [4].
Good Features to Track (GFTT) is a feature detector that is based on the Harris corner detector. The main improvement is that it finds corners that are good to track under affine image transformations. Maximally Stable Extremal Regions (MSER) is used as a method of blob detection in images. This method is use to find correspondence between two image with different viewpoint. MSER is applied with binary image. All pixels inside MSER have ‘extremal’ where it refers to the higher or lower intensity than all the pixels on its outer boundary. Meanwhile, MSER regions are ‘maximal stable’ in the threshold selection process [5][9].
Oriented FAST and rotated BRIEF (ORB) is very fast binary descriptor based on BRIEF descriptor. ORB is combination of FAST detector and BRIEF descriptor. BRIEF is a feature descriptor that uses simple binary tests in a smoothed image patch. It is similar to SIFT regarding to invariant to lighting, blur and distortion but its weakness is that very it is sensitive to the rotation [6][10].
Fig. 2: Center-Surround Bi-Level Filters Approximating The Laplacian
Center Surrounded Extrema (CenSurE) uses polygon, hexagon and octagon filters as more computable alterative to circle filter. First, CenSurE computes all the location and scales to find the local extrema in a neighborhood by simplify center-surround filter. Then Harris detector is use to
eliminate the entire weak corner. CenSurE applies simple approximations where it uses bi-level center surround filter by multiply the image value to 1 and -2. Fig. 2 shows the bi-level Laplacian of Gaussian and other examples of approximations that are use to conjugate with integral images [7].
3. METHODOLOGY
3.1 The system flow
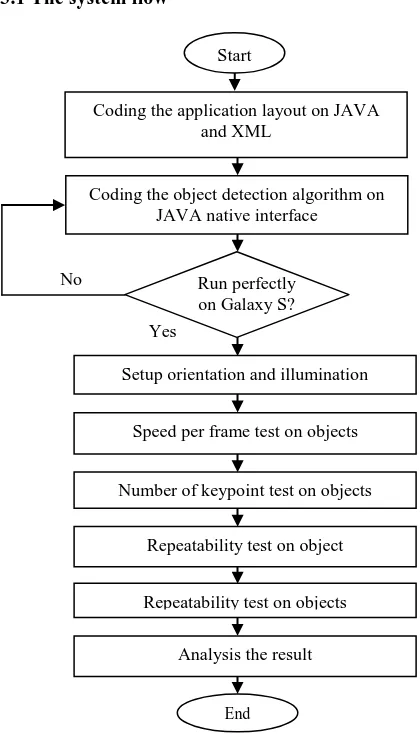
Fig. 3: The Flow Chart Of The Experiment
Fig. 3 shows the flow chart of the experiment that will be conducted to test the performance of the feature extraction methods. The first step of the study is to write the application layout on JAVA and XML layers. Then, the object detection algorithm is written through the JAVA native interface with C++ language. The tools that are used in this experiment are Android Software Development kit (SDK), OpenCV and JAVA SDK. The compiled object is then uploaded to the Samsung GalaxyS. If no errors occurred, then experiment can be proceed. The experiment is
Coding the object detection algorithm on JAVA native interface
Setup orientation and illumination
Speed per frame test on objects
Number of keypoint test on objects
Analysis the result
End
No
Start
Repeatability test on objects Repeatability test on object
Run perfectly on Galaxy S?
Coding the application layout on JAVA and XML
138 conducted by setting the orientation of the Galaxy S and illumination of experiment area. Then we start to measure and collect the result regarding of speed, number of feature, repeatability and robustness. After all the data have been collected, then the result is analyzed and compared with the theory.
(a)
(b)
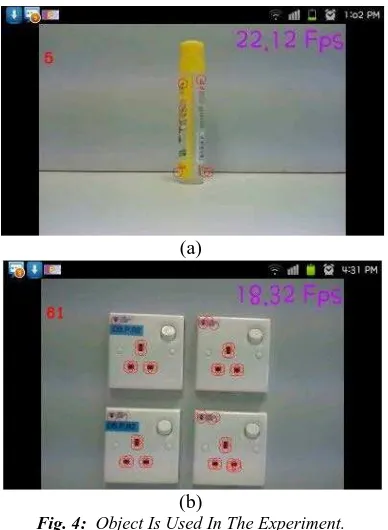
Fig. 4: Object Is Used In The Experiment.
(A) Glue Image, (B) Power Socket
In this experiment there are two objects used namely power socket and glue image as shown in Fig. 4. All the experiments are executed on a computer with an Intel Core 2 Duo 2.66GHz and 4GB main memory and object detection system was built Samsung’s GalaxyS Smartphone that is powered by 1 GHz ARM Cortex-A8 processor running with Android 2.3 Gingerbread OS. There are seven methods compared namely SIFT, SURF, MSER, FAST, CenSurE, ORB and GFTT.
3.2 The measurements
There are a lot of experiments conducted in order to evaluate the performances of each object detection methods. The details of those experiment measures are as follows:
3.2.1 Speed
To measure the speed per frame (fps) test, the processing time of each object detection method for one frame is recorded. From this information, the number of frame that can be processed in one second can be calculated. Each object detection method is executed on the video captured by the
camera. 10 continuous frames are selected and the average processing speed for one frame is used to measure the fps on the two different objects. The higher value of the fps is the higher speed of the method to process the frame.
3.2.2 Number of keypoints
In this experiment, the number of keypoint for each object detection methods is recorded. The motive of this experiment is to measure the number of maximum keypoint that is extracted from each object detection method. The average keypoint count per frame of 10 continuous frames is recorded. Note that the large number of keypoint is a drawback in object detection where more points need to be matched compared to smaller number of keypoint.
3.2.3 Repeatability
The criterion of repeatability is first introduced to measure the consistency of keypoint location [12]. It is based on the number of points that appear repeatedly between two images by using the concept of homography. However the execution is too complex to be measured using the smartphone. After all, we need to know the exact view change to estimate the location of the keypoints.
In this paper, a new procedure to measure the repeatability is proposed. Instead of counting the number of repeated keypoints based on homography, the repeatability performance is measured by observing the consistency of the repeatability error rate (RER). The locations of keypoints for 20 continuous frames are recorded. From the 20 frames, we locate the keypoints that always appear in each frame. Those keypoints are labeled as the reference keypoints (RK).
For each testing frame, we calculate the gravity of central mass point. The central mass point is calculated using the following formula:
1
N is the number of keypoints in that particular
frame and
k
xiis the location at x-axis of keypointi
139 (1) on the y-axis and
C C
x,
y
will be thecoordinate of the central mass point.
Then for each keypoint the gradient of the keypoint is calculated by considering the central mass point as the origin of the plane. The gradient for each keypoint can be calculated as follows:
i
y y
i i
x x
k
C
G
k
C
−
=
−
(3)The gradient of each of the RK is also calculated. The difference between the gradient of test frame keypoints and the RK are calculated. A keypoint considered is non-overlapping keypoint (NOK) if the absolute difference of gradient between the keypoint and the RK is larger than 10 pixels that can be defined by
NOK
=
G
i−
G
R>
D
(4)where
G
Ris the gradient of the RK and D is equal to 10 for the experiment. For each test frame, we calculate the gradient of all of the keypoints detected in that frame then filter out the keypoints that are not fulfilling the condition in formula (4). RER is finally calculated by dividing the total NOK with the total RK. The formula to calculate RER is as follows:Total NOK
RER= 100
max(Total RK,Total NOK)× (5)
In the case of total NOK is larger than total of RK, the RER=100%.
To measure the consistency of the RER, the standard deviation is calculated. A high RER standard deviation means that the object detection keypoint is inconsistent.
3.2.4 Robustness
In order to measure the robustness of each algorithm, we evaluate the performance in two different cases. The first case is regarding the orientation of the smartphone and the second is the illumination. For the orientation, the smartphone is moved 10cm forward (+10cm) and backward 10cm) and 30 º angles to left (+30°) and right (-30°). For the illumination four types of lighting are used which are the fluorescent light (normal), sunlight, dim light (without the room light) and focused incandescent light. The samples of the object in various orientation and illumination are shown in Fig. 5.
Fig. 5: From The Top Left To Top Right Are The
Image With Angle Orientation For -30° And +30°, Middle Are The Images With+10 Cm And -10 Cm Distance, And Bottom, The Images With Fluorescent And
Focused Incandescent Illuminations
The robustness performance can be measured by observing the RER from the equation (1). However instead of using the keypoint that appear on each frame as the reference point, we use the keypoint in the normal location and illumination as the reference point so that we can observe repeatability difference between the keypoint in normal illumination, and orientation and the keypoints in different illuminations, and orientations.
4. EXPERIMENTAL RESULTS
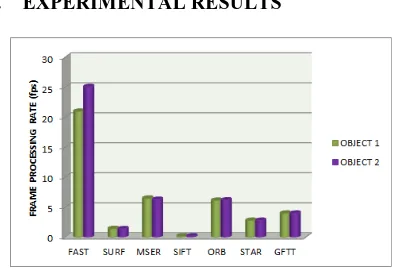
Fig. 6: Frame Processing Rate For The Seven Object
Detection Methods
140 15 fps. This shows that FAST achieves the optimum real-time video performance while executing the object detection algorithm.
Fig. 7: Future Count For The Seven Objet Detection
Methods
Fig. 7 shows the performance of seven object detection methods regarding the average number of future per frame in ten seconds. GFTT and ORB extracted extremely high numbers of keypoint compared to other methods. This shows that GFTT and ORB is very sensitive to noise and corners in image. This high numbers of keypoint will also increase the matching process time since more keypoint need to be matched.
(a)
(b)
(c)
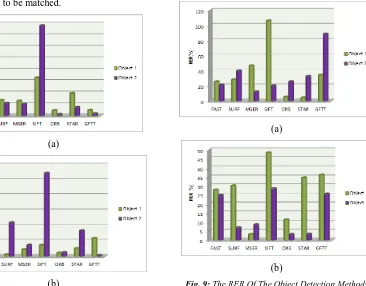
Fig. 8: The RER Compared To The Normal Light Of
Each Object Detection Method In Three Different Illuminations: (A) Sunlight, (B) Incandescent Light And
(C) Dim Light
Fig. 8 shows the performance of each algorithm in different type of illuminations. The RER is calculated by dividing the repeatability error in difference illuminations with the repeatability error in normal condition which is the fluorescence light. We can see that the SIFT method achieves high RER compared to other method in each different illuminations.
(a)
(b)
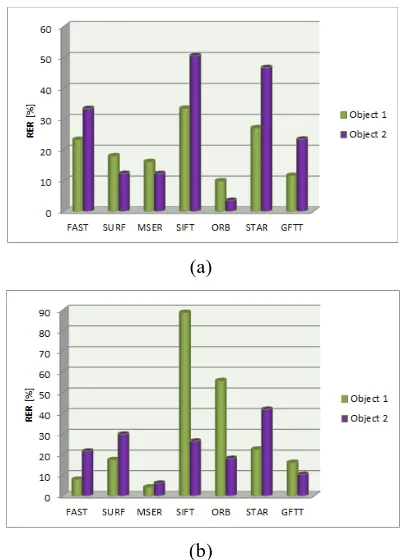
Fig. 9: The RER Of The Object Detection Methods
141 This shows that SIFT is sensitive to illumination change. In the incandescent and dim light, the light source is minimal and this will cause new object to appear on the image such as the shadow. This situation will also produce a lot of noise in the image. Out of all, the ORB achieves the lowest RER. This shows that ORB is really insensitive to shadow and noise. FAST and GFTT also show a good performance in different illumination with low RER.
Fig. 9 shows the RER performance for seven methods by comparing different distances. Once again, ORB shows a very good performance with low RER. This also shows that ORB is insensitive to real world scale change as the size of object is also changed with respect to various distance. The worst method in keypoint extraction with various distances is the GFTT which achieves the highest RER.
(a)
(b)
Fig. 10: The RER Of The Object Detection Methods With Respect To Different Viewpoint From The
Object;(A) +30º And (B) -30º
Fig. 10 shows the RER performance for each method with respect to different angle viewpoint. This test also measures the affine invariant characteristic of the object detection method. The methods that are robust to this affine change are the MSER and ORB since they all achieves low RER compared to other methods.
Fig. 11: The standard deviation of RER for
seven object detection methods
Fig. 11 shows the standard deviation of RER for each method. The lowest RER standard deviation is achieves by ORB followed by GFTT and FAST. This shows that these three methods perform feature extraction consistently compared to other methods. The worst and inconsistent method is the SIFT.
5. CONCLUSIONS AND FUTURE WORKS
In this paper, we analyzed the object detection methods with respect to efficiency, quality and robustness of the object detection. The overall performances show that the FAST algorithm has the best average performance with respect to speed, number of keypoint and repeatability error. The most robust object detection method is the ORB that achieves the lowest RER even in different illumination and orientation. However ORB method consumes too much time in computing its algorithm and does not archives real-time video performance.
142
ACKNOWLEDGEMENT
This paper is supported by Universiti Teknikal Malaysia Melaka under PJP/2011/FKEKK(44B)/ S00979.
REFRENCES:
[1] Industry leaders announce open platform for mobile devices, November 2007
[2] K. Owen, An Executive Summary of Research in Android & Integrated Development Environments, April 2011
[3] Paul Viola, Michael Jones, “Robust Real-time Object Detection”. Second International
Workshop on Statistical and Computational Theories of Vision, July 2001
[4] KanghunJeong, Hyeonjoon Moon, “Object Detection using FAST Corner Detector based on Smartphone Platforms”. Computers, Networks, Systems and Industrial Engineering (CNSI), May 2011
[5] Donoser, M.; Bischof, H. “Efficient Maximally Stable Extremal Region (MSER) Tracking”. IEEE Computer Society Conference
on Computer Vision and Pattern Recognition,
June 2006, pp.553-560
[6] Ethan Rublee, Vincent Rabaud, Kurt Konolige, Gary Bradski, “ORB: an efficient alternative to SIFT or SURF”. IEEE International Conference
on Computer Vision (ICCV), 2011, 2567-2571
[7] Agrawal, M., K. Konolige, et al.“CenSurE: Center Surround Extremas for Realtime Feature Detection and Matching”. Computer Vision –
ECCV Springer Berlin / Heidelberg. Vol.5305,
2008, pp.102-115
[8] David G. Lowe, “Object Recognition from Local Scale-Invariant Features”. The
Proceedings of the Seventh IEEE International Conference on Computer Vision, 1999, pp.
1150-1157
[9] Clemens Arth, Christian Leistner, Horst Bischof, “Robust Local Features and their Application in Self-Calibration and Object Recognition on Embedded Systems”. Computer
Vision and Pattern Recognition, June 2007
[10] Calonder, M., V. Lepetit, et al. “BRIEF: Binary Robust Independent Elementary Features”.
Computer Vision – ECCV 2010, Springer Berlin / Heidelberg. Vol. 6314, 20120, pp.778-792
[11] AmmarAnuar, KhairulMuzzammilSaipullah, NurulAtiqah Ismail, Soo Yew Guan. “OpenCV Based Real-Time Video Processing Using Android Smartphone”. International Journal of
Computer Technology and Electronics Engineering (IJCTEE), Vol. 1(3), 2011, pp.
58-63