CHAPTER 1 INTRODUCTION
Chapter 1 presents introduction of research intended to make the reader understand about the background, problem formulation, research objectives and also scope and limitation of the research.
1.1. Research Background
Recently, in the middle of intense business competition,industri grafika(including industrial production printing and reproduction of recorded media) experiences positive growth in Indonesia. According toBadan Pusat Statistik(BPS) Indonesia, the growth in industrial production and manufacturing of the second quarter of 2013 goes up by 6.57 percent (y-on-y) from the second quarter of 2012, where this development is mainly supported by the growth in industri grafika (19.60 percent). In addition, Persatuan Perusahaan Industri Grafika Indonesia (PPIGI) also estimates that the industri grafika will experience significant growth, about 15% started from 2010.
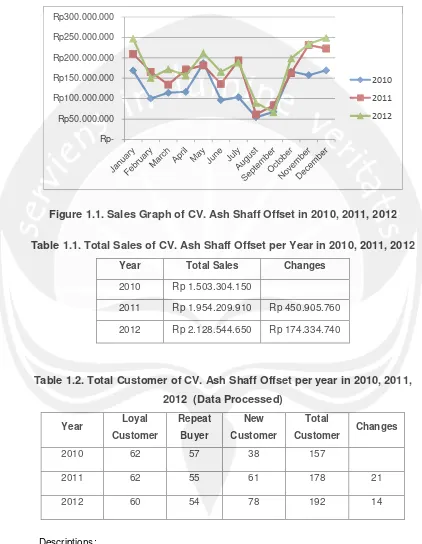
Positive growth ofindustri grafikais followed by increasing number of competitor. It can be seen by the increasing number of industri grafika companies. The competitions in this industry then become more intense. CV. Ash Shaff Offset is one of industri grafika that is facing intense competition. According to Badan Pusat Statistik(BPS) Yogyakarta, there are 28 companies which are grouped into publishing, printing and reproduction of recorded media in Yogyakarta 2008. Even though this industry is facing intense competition, CV. Ash Shaff Offset fairly reach positive growth (See Figure 1.1.) each years. However, according to available sales data provided in Table 1.1. that was obtained from accounting department of CV. Ash Shaff Offset, it shows that number of sales between 2011 and 2012 was not significantly increased when it is compared with the previous year. The increasing in sales from 2010 to 2011 was Rp450.905.760, while from 2011 to 2012 was only Rp174.334.740.
obtained from the sum of repeat buyer and new customer in the previous period. According to Table 1.2., repeat buyer of CV. Ash Shaff Offset between period of 2010 and 2012 is gradually decreases.
Figure 1.1. Sales Graph of CV. Ash Shaff Offset in 2010, 2011, 2012
Table 1.1. Total Sales of CV. Ash Shaff Offset per Year in 2010, 2011, 2012
Year Total Sales Changes
2010 Rp 1.503.304.150
2011 Rp 1.954.209.910 Rp 450.905.760
2012 Rp 2.128.544.650 Rp 174.334.740
Table 1.2. Total Customer of CV. Ash Shaff Offset per year in 2010, 2011, 2012 (Data Processed)
Year Loyal
Customer
Repeat Buyer
New Customer
Total
Customer Changes
2010 62 57 38 157
2011 62 55 61 178 21
2012 60 54 78 192 14
Descriptions: Rp-Rp50.000.000 Rp100.000.000 Rp150.000.000 Rp200.000.000 Rp250.000.000 Rp300.000.000
2010
2011
b. Repeat Buyer : Buyers last year who return to make a purchase in the
present year.
c. New Customer : Buyers who make a purchase once in the present year.
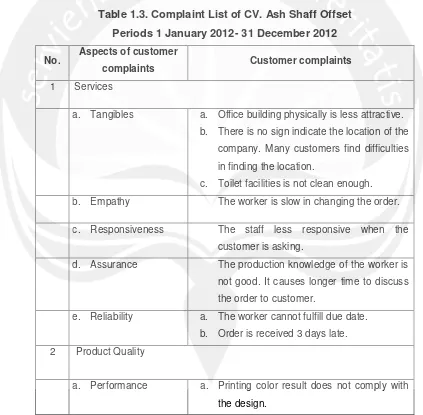
[image:3.595.87.510.286.701.2]Based on preliminary research that was conducted by the author, the unwillingness of new customer become a repeat buyer is affected by intense competition inindustri grafika and customer dissatisfaction. In terms of customer dissatisfaction, it can be proved from Table 1.3. that was obtained from marketing staff which shows dissatissfaction in several aspects such services and product quality aspect. However, until now the company has not evaluated customer dissatisfaction and also developing strategy optimally to solve the problem yet.
Table 1.3. Complaint List of CV. Ash Shaff Offset Periods 1 January 2012- 31 December 2012
No. Aspects of customer
complaints Customer complaints
1 Services
a. Tangibles a. Office building physically is less attractive.
b. There is no sign indicate the location of the
company. Many customers find difficulties
in finding the location.
c. Toilet facilities is not clean enough.
b. Empathy The worker is slow in changing the order.
c. Responsiveness The staff less responsive when the
customer is asking.
d. Assurance The production knowledge of the worker is
not good. It causes longer time to discuss
the order to customer.
e. Reliability a. The worker cannot fulfill due date.
b. Order is received 3 days late.
2 Product Quality
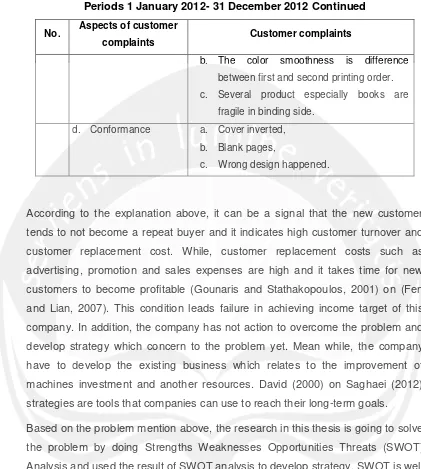
a. Performance a. Printing color result does not comply with
Table 1.3. Complaint List of CV. Ash Shaff Offset Periods 1 January 2012- 31 December 2012 Continued
No. Aspects of customer
complaints Customer complaints
b. The color smoothness is difference
between first and second printing order.
c. Several product especially books are
fragile in binding side.
d. Conformance a. Cover inverted,
b. Blank pages,
c. Wrong design happened.
According to the explanation above, it can be a signal that the new customer tends to not become a repeat buyer and it indicates high customer turnover and customer replacement cost. While, customer replacement costs such as advertising, promotion and sales expenses are high and it takes time for new customers to become profitable (Gounaris and Stathakopoulos, 2001) on (Fen and Lian, 2007). This condition leads failure in achieving income target of this company. In addition, the company has not action to overcome the problem and develop strategy which concern to the problem yet. Mean while, the company have to develop the existing business which relates to the improvement of machines investment and another resources. David (2000) on Saghaei (2012) strategies are tools that companies can use to reach their long-term goals.
1.2. Problem Formulation
From the research background above, the problem in this research can be stated as, “How to develop alternative business strategy for CV. Ash Shaff Offset in order to overcome the high customer turnover and customer replacement cost?”
1.3. Research Objectives
The specific objective in this research is to determine alternative business development strategy for CV. Ash Shaff Offset in order to overcome the high customer turnover and customer replacement cost.
1.4. Scope and Assumption of Research The scopes and assumption of this research are:
1. The SWOT analysis does not consider about financial aspects.
2. The IPA discussion limited to the matter relates to internal analysis on SWOT analysis.
3. The input stages of strategic formulation limited to Internal Factor Evaluation (IFE) and External Factor Evaluation (EFE) Matrix tools.