CHAPTER 2
LITERATURE REVIEW AND THEORETICAL BACKGROUND
Chapter 2 reviews the literature review and theoretical background.
2.1. Literature Review
In this section, previous research of SWOT Analysis on manufacturing Sector is provided.
2.1.1. Previous Research of SWOT Analysis on Manufacturing Sector
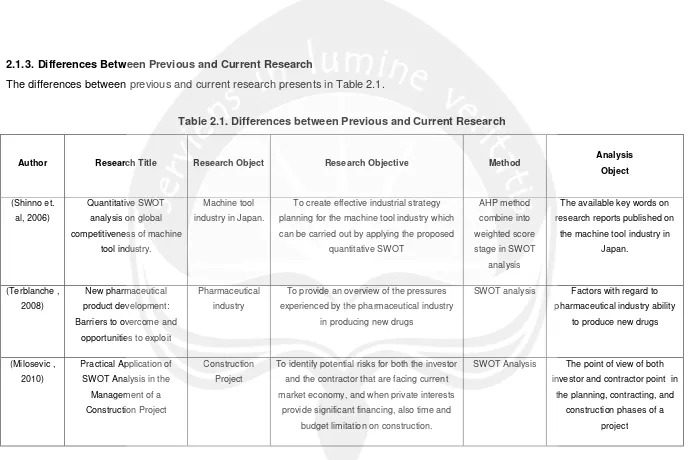
Shinno et.al (2006) has conducted SWOT analysis to create effective industrial strategy planning for the machine tool industry which can be carried out by applying the proposed method. The SWOT key words were collected from the related research reports published on the machine tool industry in Japan. In order to proposed quantitative SWOT analysis, the AHP method is combined into weighted score stage in SWOT analysis.
Terblanche (2008) used SWOT analysis to provide an overview of the pressures experienced by the pharmaceutical industry in producing new drugs. SWOT analysis was used to analyze factors with regard to the ability of pharmaceutical industry to produce new drugs.
Milosevic (2010) has conducted SWOT analysis to identify potential risks for both the investor and the contractor that are facing current market economy, and when private interests provide significant financing, also time and budget limitation on construction. This research showed each SWOT Analysis components from the point of view of both investor and the contractor in the planning, contracting, and construction phases of a project.
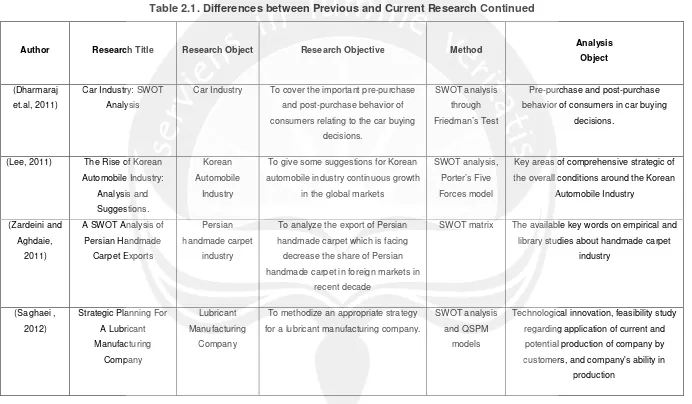
Lee (2011) has used SWOT analysis to assess the comprehensive strategic of the overall conditions around the Korean Automobile Industry by analyzing its key areas. While, the Porter’s Five Forces model has used to competitive analysis of the Korean Auto Parts Industry. This research aims to give some suggestions for Korean automobile industry continuous growth in the global markets.
Another research with SWOT topic was also conducted by Zardeini and Aghdaie (2011). The aim of this research is to analyze the export of Persian handmade carpet which is facing decrease the share of Persian handmade carpet in foreign markets in recent decade by using the SWOT matrix. The Opportunities, Threats, Strengths and Weaknesses analysis was limited to the available empirical and library studies about handmade carpet industry.
Saghaei (2012) has been used SWOT analysis and QSPM models. This research aims to methodize an appropriate strategy for a lubricant manufacturing company. The SWOT identification process was regarding technological innovation, feasibility study regarding application of current and potential production of company by customers, and the ability of company in production. Based on the acquired data, EFE and IFE matrixes were calculated and the results were analyzed on diagrams. These results were also confirmed by QSPM matrix.
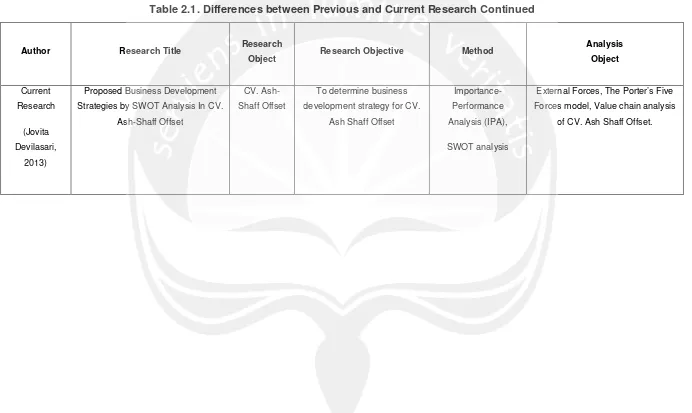
2.1.2. Current Research
2.1.3. Differences Between Previous and Current Research
The differences between previous and current research presents in Table 2.1.
Table 2.1. Differences between Previous and Current Research
Author Research Title Research Object Research Objective Method Analysis
Object
(Shinno et.
al, 2006)
Quantitative SWOT
analysis on global competitiveness of machine
tool industry.
Machine tool
industry in Japan.
To create effective industrial strategy
planning for the machine tool industry which can be carried out by applying the proposed
quantitative SWOT
AHP method
combine into weighted score stage in SWOT
analysis
The available key words on
research reports published on the machine tool industry in
Japan.
(Terblanche ,
2008)
New pharmaceutical
product development: Barriers to overcome and
opportunities to exploit
Pharmaceutical
industry
To provide an overview of the pressures
experienced by the pharmaceutical industry in producing new drugs
SWOT analysis Factors with regard to
pharmaceutical industry ability to produce new drugs
(Milosevic ,
2010)
Practical Application of
SWOT Analysis in the Management of a Construction Project
Construction
Project
To identify potential risks for both the investor
and the contractor that are facing current market economy, and when private interests
provide significant financing, also time and budget limitation on construction.
SWOT Analysis The point of view of both
investor and contractor point in the planning, contracting, and
Table 2.1. Differences between Previous and Current Research Continued
Author Research Title Research Object Research Objective Method Analysis
Object
(Dharmaraj et.al, 2011)
Car Industry: SWOT Analysis
Car Industry To cover the important pre-purchase and post-purchase behavior of consumers relating to the car buying
decisions.
SWOT analysis through Friedman’s Test
Pre-purchase and post-purchase behavior of consumers in car buying
decisions.
(Lee, 2011) The Rise of Korean Automobile Industry: Analysis and Suggestions. Korean Automobile Industry
To give some suggestions for Korean automobile industry continuous growth
in the global markets
SWOT analysis, Porter’s Five Forces model
Key areas of comprehensive strategic of the overall conditions around the Korean
Automobile Industry
(Zardeini and
Aghdaie, 2011)
A SWOT Analysis of
Persian Handmade Carpet Exports
Persian
handmade carpet industry
To analyze the export of Persian
handmade carpet which is facing decrease the share of Persian
handmade carpet in foreign markets in recent decade
SWOT matrix The available key words on empirical and
library studies about handmade carpet industry
(Saghaei , 2012)
Strategic Planning For A Lubricant Manufacturing Company Lubricant Manufacturing Company
To methodize an appropriate strategy for a lubricant manufacturing company.
SWOT analysis and QSPM
models
Technological innovation, feasibility study regarding application of current and potential production of company by
Table 2.1. Differences between Previous and Current Research Continued
Author Research Title Research
Object Research Objective Method
Analysis Object
Current Research
(Jovita
Devilasari, 2013)
Proposed Business Development Strategies by SWOT Analysis In CV.
Ash-Shaff Offset
CV. Ash-Shaff Offset
To determine business development strategy for CV.
Ash Shaff Offset
Importance-Performance Analysis (IPA),
SWOT analysis
External Forces, The Porter’s Five Forces model, Value chain analysis
2.2. Theoretical Background
In this section reviews the theoretical background related to the research.
2.2.1.Industri GrafikaDefinition
According to Kamus Besar Bahasa Indonesia (KBBI), industri defined as kegiatan memproses atau mengolah barang dengan menggunakan sarana dan peralatan. While, Oxford dictionary defines industry as economic activity concerned with the processing of raw materials and manufacture of goods in factories. Later on, the word of Grafika (KBBI) defined as ilmu tentang cetak-mencetak (pada kertas atau logam); segala cara pengungkapan dan perwujudan dalam bentuk huruf, tanda, dan gambar yg diperbanyak melalui proses percetakan guna disampaikan kepada khalayak. Through those definitions, can be concluded that industri grafikadefined as economic activity concerned with embodiment in the form of letters, signs, and images that propagated through the printing process in order to be delivered to the audience. BPS Yogyakarta itself is categorizing industri grafika in industrial major group as Paper and Paper Product/Publishing, Printing & Reproduction of Recorded Media.
2.2.2. Customer Satisfaction
Customer satisfaction is defined as the extent to which a perceived performance of a product matches the expectations of buyer Kotler (2001). Customer satisfaction is affected from several factors and it also has an influence towards business development.
A. Customer Defined Value and Customer Satisfaction
According to Kotler and Amstrong (2001) in deciding which products and services to buy, consumers rely on their perception of relative value. Customer value is the difference between the values the customer gains from owning and using a product and the costs of obtaining and using the product. Customer satisfaction depends on perceived performance of a product in delivering value relative to the expectations of buyer. If the performance of product falls short of expectations, the buyer is dissatisatisfied. If performance matches or exceeds expectations, the buyer is satisfied or delighted.
(TQM) programs, designed to constantly improve the quality of their products, services, and marketing processes. Quality has a direct impact on product performance and hence on customer satisfaction.
(Goetsch and Davis, 1997) As total quality setting, quality is defined by the customer. It is important for organizations to understand how customers define value. The value of a product or service is the sum of the perceptions of the customer following factors :
1. Product/service quality
2. Service provided by the organizations 3. The personnel of organization
4. The image of organization
5. Selling price of the product/service 6. Overall cost of the product/service
Giorgio Merli on Goetsch and Davis (1997) also stated, some points about customer-defined quality:
1. The customer must be the top priority of organization. The survival of organization depends on the customer.
2. Reliable customers are the most important customers. A reliable customer is one who buys repeatedly from the same organization. Customers who are satisfied with the quality of their purchases from an organization become reliable customers. Therefore, customer satisfaction is essential. 3. Customer satisfaction is ensured by producing high-quality products. It
must be renewed with every purchase. This cannot be accomplished if quality, even though it is high, is static. Satisfaction implies continual improvement. Continual improvement is the only way to keep customers satisfied and loyal.
B. Customer Satisfaction, Customer loyalty and Profitability
new customers unless the organization is to shrink in size. Conversely, if customer decay is reduced but the rate of customer acquisition is maintained, the company will grow. The key to increase customer retention and reduce customer decay is by increasing customer satisfaction Hill, et. al (1999). In addition, (Fen and Lian, 2007) the importance of maintaining the customer loyalty through customer satisfaction can be seen as follows:
1. It is more expensive to win new customers than to keep existing ones (Ennew and Binks, 1996; Hormozi and Giles, 2004).
2. Customer replacement costs, like advertising, promotion and sales expenses, are high and it takes time for new customers to become profitable (Athanassopoulos et. al, 2001).
3. Increase of retention rate implied greater positive word of mouth, decrease price sensitivity and future transaction costs, and leading to better business performance (Appiah-Adu, 1999; Reichheld and Sasser, 1990; Fornell, 1992; Ennew and Binks, 1996; Bolton, 1998 ; Ryals, 2003).
C. Product Quality
Product quality is the main factor in affecting customer satisfaction. According to Kotler and Armstrong (2001) defined product as anything that can be offered to a market for attention, acquisition, use or consumption and that might satisfy a want or need. While, according to Stanton (1996) on Wiliam ()a product is a set of tangible and intangible attributes, including packaging, color, price quality and brand plus the services and reputation of the seller. Products fall into two broad classess based on the types of consumers that use them (Kotler and Armstrong, 2001) :
1. Consumer product : product bought be final consumer for personal consumption.
2. Industrial product : product bought be individuals and organizations for further processing or for use in conducting a business.
2. Features: the secondary characteristics that supplement the basic functioning of product.
3. Reliability: the probability of a product failing within a specified period of time.
4. Conformance: the degree to which design and operating characteristics of a product match with pre-established standards.
5. Durability: it is a measure of product life, having both economic and technical dimensions.
6. Serviceability: it refers to speed, courtesy and competence of repair. 7. Aesthetics: it refers to as to how a product looks, feels, sounds etc.
8. Perceived quality: it refers to assessment of standards relying on indirect measures when comparing product brands.
D. Service Quality
The other main factor which affects customer satisfaction is service quality. Service quality is a measure of how well the service level delivered matches customer expectations. Delivering quality service means conforming to customer expectations on a consistent basis (Parasuraman et al.,1985) on (Aydin and Yildirim, 2012). SERVQUAL (Service Quality Model) as a generic instrument to measure service quality has been developed by Parasuraman et al. In 1985. (Aydin and Yildirim, 2012) SERVQUAL defined as 22-item instrument for assessing customer perceptions of service quality in service and retailing organizations. It consists of five factors of functional quality dimension and contains a two-part 22 scale items, there are:
1. Tangible: physical facilities, equipment, appearance of personnel, communication material.
2. Reliability: ability to perform the promised service dependably and accurately.
3. Responsiveness: the willingness to help customers and provide prompt service.
4. Assurance: the knowledge and courtesy of employees and their ability to inspire trust and confidence.
1. Tangibles
Q1: Modern looking equipment Q2: Physical facilities
Q3: Employees good-looking Q4: Materials
2. Reliability
Q5: Promise to do something by a certain time Q6: A sincere interest in solving customer’s problem Q7: Perform the service right the first time
Q8: Provide the service at the time of promise Q9: Insist on error free records
3. Responsiveness
Q10: Employees tells customers exactly when services will be performed. Q11: Employees will give prompt service to customer.
Q12: Employees will always be willing to help customers.
Q13: Employees will never be too busy to respond to customers’ requests. 4. Assurance
Q14: The behavior of employees will instill confidence in customers Q15: Customers will feel safe in transactions
Q16: Employees will consistently courteous with customers
Q17: Employees will have the knowledge to answer customers’ questions 5. Empathy
Q18: Give customers individual attention
Q19: Operating hours convenient to all their customers Q20: Employees give customers personal attention Q21: Have customer’s best interests at heart Q22: Understand the specific needs of customers
E. Price
(Kotler and Armstrong, 2001) argues that there are two factors to consider when setting prices, there are:
1. Internal factors affecting pricing decision
Internal factors affecting pricing include the company’s marketing objectives, marketing mix strategies, costs, and organizational considerations.
2. External factors affecting pricing decision
External factors that affect pricing decision include the nature of the market and demand, competition, and other environmental elements. According to (Kotler and Armstrong, 2001), there are four types of objectives in determining prices, there are:
1. Survival objectives
Companies set survival as their major objectives if they are troubled be too much capacity, heavy competition, or changing consumer wants. 2. Current profit maximization objectives
Current profitmaximization as their pricing goal. The company estimate what demand and costs will be at different prices and choose the price that a will produce the maximum current profit, cash flow, or return on investment.
3. Market share leadership objectives
The company believe that the company with the largest market share will enjoy the lowest costs and highest long-run profit.
4. Product quality leadership objectives
This normally calls for charging a high price to cover higher performance quality and the high cost of R&D.
While, according to Stanton (1998), empirical indicators characterize the price is as follows:
1. The price offered afforded by the customer.
2. The price offered is lower than prices of competitor.
3. The price offered in accordance with the quality of the product.
2.2.3. Questionnaires design
A. Types of Question
(Hill, 1996) The main distinction between types of question is between closed and the open question. In order to produce quantitative answers for statistical analysis, use mainly closed questions. Closed questions give respondents a fixed selection of answers to choose. Closed questions could be dichotomous (with only two alternative answers possible), multiple choice (enabling respondents to choose from any number of possible answers).
B. Rating Scales
(Hill, 1996) There are several types of rating scales, there are :
a. Likert scales : designed to measure degrees of agreement with a statement (agree strongly : 5, agree slightly : 4, neither agree or disagree : 3 , disagree slightly : 2 disagree strongly : 1 ).
b. Semantic differential scales : display an attitude battery between two opposing words.
c. Numerical rating scales : requires respondents to ascribe a mark, out of 10. d. Ordinal scales : requires respondents to indicate the relative strength of his
or her attitude to the different criteria by ranking the criteria.
e. SIMALTO scales : used to collect data on customer priorities and on their range of expectations, from ideal to unacceptable levels.
C. Validity Test
(Sekaran et. Al, 2010) The use of better instruments will ensure more accuracy in results, which in turn will enhance the scientific quality of research. Hence, we need to asses the goodness of the measures developed through reliability and validity. Validity is a test of how well an instrument that is developed measures the particular concept it is intended to measure. (Sekaran et. Al, 2010) There are several types of validity, they are :
1. Content validity : ensures that the measure includes an adequate and representative set of items that tap the concept.
2. Face validity : indicates that the items that are intended to measure a concept, do, on the face of it, look like they measure the concept.
4. Concurrent validity : is established when the scale discriminates individuals who are known to be different; that is, they should score differently.
5. Predictive validity : indicates the ability of the measuring instrument to differentiate among individuals with reference to a future criterion.
6. Construct validity : testifies to how well the results obtained from the use of the measure fit the theories around which the test is designed.
7. Convergent validity : is established when the scores obtained with two different instruments measuring the same concept are highly correlated, 8. Discriminant validity : is established when, based on theory, two variables
are predicted to be uncorrelated, and the scores obtained by measuring them are indeed empirically found to be so.
(Sekaran et. Al, 2010) The validity can be established through :
1. Correlational analysis (concurrent, predictive, convergent, discriminant, validity)
2. Factor analysis (construct validity) 3. The multitrait
(Ghozali, 2006) Tingkat validitas dapat diukur dengan cara membandingkan nilai r hitung (korelasi setiap item dan total item) dengan nilai r tabel dengan ketentuan untuk defree of freedom (df) = n-k, dimana n adalah jumlah sampel yang digunakan dan k adalah jumlah variabel independennya. (Sugiyanto, 2007) Kriteria dalam membandingkan nilai koefisien validitas hasil dengan nilai koefisien korelasi Pearson / tabel Pearson (r tabel) adalah:
a. Instrumen valid, jika r hitung≥r tabel b. Instrumen tidak valid, jika r hitung < r tabel
D. Reliability Test
Reliability is a test of how consistently a measuring instrument measures whatever concept it is measuring (Sekaran et. Al, 2010). It indicates the extent to which it is without bias (error free) and hence ensures consistent measurement across time and across the various items in the instrument. The reliability of a measure is an indication of the stability and consistency with which the instrument measures the concept and helps to assess the “goodness” of a measure (Sekaran et. Al, 2010).
1. Stability of measures : the ability of a measure to remain the same over time - despite uncontrollable testing conditions or the state of the respondents themselves - is indicate of its stability and low vulnerability to changes in the situation.
2. Internal consistency of measures : indicative of the homogeneity of the items in the measure that tap the construct.
(Jogiyanto, 2008) Dalam menghitung reliabilitas konsistensi internal (Internal consistency of measures) dapat dilakukan dengan teknik separuh dipecah/ Split half. Teknik ini dapat dilakukan dengan membagi item-item yang akan di tes menjadi dua separuhan dan dapat dilakukan secara acak atau secara atas bawah atau secara ganjil-genap. Instrument tersebut reliable jika nilai koefisiensi konsistensi internal > 0,60. Kemudian, koefisiensi konsistensi internal dapat diperoleh dari Cronbach’s coefficient alpha. Rumus Cronbach’s coefficient alpha yaitu :
ߙ=
ିଵ (1− ஊఙೣమ
ఙೣమ )
Keterangan :
ߙ = Cronbach’s coefficient alpha k = jumlah pecahan
ߑߪ௫ଶ = total dari varian masing-masing pecahan ߪ௫ଶ = varian dari total skor
2.2.4. Importance Performance Analysis (IPA)
According to Levenburg and Magal (2005), Importance-performance analysis was introduced by Martilla and James (1977) as a framework for understanding customer satisfaction as a function of both expectations related to salient attributes (“importance”) and judgments about their performance (“performance”). By identifying attributes that should be emphasized or de-emphasized, IPA guides the prioritization and development of action plans to minimize mismatches between importance and performance, resulting in improved operational efficiencies through resource redeployment recommendations (Graf et al., 1992; Slack, 1994) on (Levenburg and Magal, 2005).
Importance-performance analysis begins with identifying the critical elements to be evaluated and this list is based on a thorough literature review or
qualitative research (Martilla and James, 1977; Graf et al., 1992; Duke and Mount, 1996; Skok et al., 2001) on (Levenburg and Maghal, 2005). Further, a survey instrument is developed to collect importance and performance ratings on each element from the sample, it is often using Likert or numerical scales (Skok et al., 2001) on (Levenburg and Maghal, 2005).
The IPA is followed two methodological streams (Levenburg and Maghal, 2005), they are:
1. Gap analysis (IPA Gap) : gap analysis focuses on identifying performance Gaps, which are typically measured as performance minus importance (O’Neill et al., 2001; Skok et al., 2001; Shaw et al., 2002).
2. IP mapping : it involves plotting the mean ratings for importance and performance on a two-dimensional grid to produce a four-quadrant matrix that identifies areas needing improvement as well as areas of effective performance (Graf et al., 1992, Skok et al., 2001).
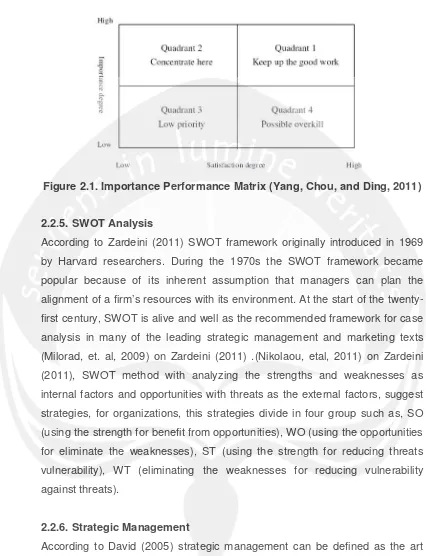
According to (Levenburg and Maghal, 2005) the IP map (See Figure 3.1.) consist of 4 quadrants:
1. Quadrant I
(High Importance/Low Performance) is labeled “Concentrate here.” Elements located in this quadrant represent key challenges that require immediate corrective action and should be given top priority (Graf et al., 1992).
2. Quadrant II
(High Importance/High Performance) is labeled “Keep up the good work,” contains elements that are strengths to the organization, and calls for a maintenance posture (Graf et al., 1992).
3. Quadrant III
(Low Importance/Low Performance) do not represent a threat to the organization (Barsky and Labagh, 1992), it may be candidates for discontinuation of resources/effort (Crompton and Duray, 1985). This quadrant is labeled “Low priority”.
4. Quadrant IV
Figure 2.1. Importance Performance Matrix (Yang, Chou, and Ding, 2011)
2.2.5. SWOT Analysis
According to Zardeini (2011) SWOT framework originally introduced in 1969 by Harvard researchers. During the 1970s the SWOT framework became popular because of its inherent assumption that managers can plan the alignment of a firm’s resources with its environment. At the start of the twenty-first century, SWOT is alive and well as the recommended framework for case analysis in many of the leading strategic management and marketing texts (Milorad, et. al, 2009) on Zardeini (2011) .(Nikolaou, etal, 2011) on Zardeini (2011), SWOT method with analyzing the strengths and weaknesses as internal factors and opportunities with threats as the external factors, suggest strategies, for organizations, this strategies divide in four group such as, SO (using the strength for benefit from opportunities), WO (using the opportunities for eliminate the weaknesses), ST (using the strength for reducing threats vulnerability), WT (eliminating the weaknesses for reducing vulnerability against threats).
2.2.6. Strategic Management
opportunities for tomorrow; long-range planning, in contrast, tries to optimize for tomorrow the trends of today.
A. Strategic-management process
(David, 2005) The strategic-management process consists of :
1. Strategy formulation: includes developing a vision and mission, identifying an organization’s external opportunities and threats, determining internal strengths and weaknesses, establishing long-term objectives, generating alternative strategies, and choosing particular strategies to pursue.
2. Strategy implementation: often is called the action stage of strategic management. Implementing strategy means mobilizing employees and managers to put formulated strategies into action.
3. Strategy evaluation: the final stage in the strategic management. Three fundamental strategy-evaluation activities are: reviewing external and internal factors that are the bases for current strategies, measuring performance, taking corrective actions.
B. Level of Strategies
David (2005) divides two level of strategies based on large and small firms. Level of strategies in small firms :
1. Company level : owner or president
2. Functional level : finance, marketing, R&D, manufacturing, information systems, and human resource managers
3. Operational level : plant managers, sales managers, production and department managers
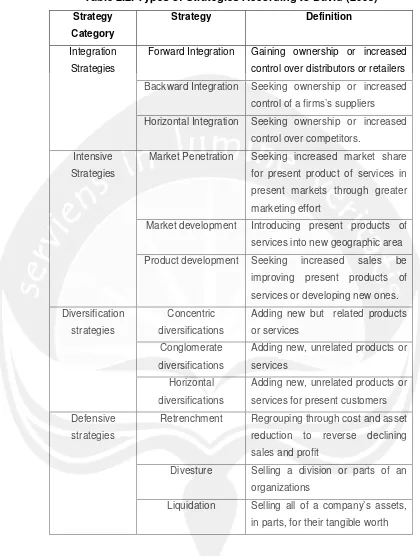
C. Types of Strategies
Table 2.2. Types of Strategies According to David (2005) Strategy Category Strategy Definition Integration Strategies
Forward Integration Gaining ownership or increased
control over distributors or retailers
Backward Integration Seeking ownership or increased
control of a firms’s suppliers
Horizontal Integration Seeking ownership or increased
control over competitors.
Intensive
Strategies
Market Penetration Seeking increased market share
for present product of services in
present markets through greater
marketing effort
Market development Introducing present products of
services into new geographic area
Product development Seeking increased sales be
improving present products of
services or developing new ones.
Diversification
strategies
Concentric
diversifications
Adding new but related products
or services
Conglomerate
diversifications
Adding new, unrelated products or
services
Horizontal
diversifications
Adding new, unrelated products or
services for present customers
Defensive
strategies
Retrenchment Regrouping through cost and asset
reduction to reverse declining
sales and profit
Divesture Selling a division or parts of an
organizations
Liquidation Selling all of a company’s assets,
in parts, for their tangible worth
Table 2.3. Types of Strategies According to Generic Strategies of Michael Porter (David, 2005)
Strategy Definition
Table 2.3. Types of Strategies According to Generic Strategies of Michael Porter (David, 2005) Continued
Strategy Definition
Differentiation strategies A strategy that offer different degrees of differentiation
Focus strategies A strategy that focused on certain industry segment
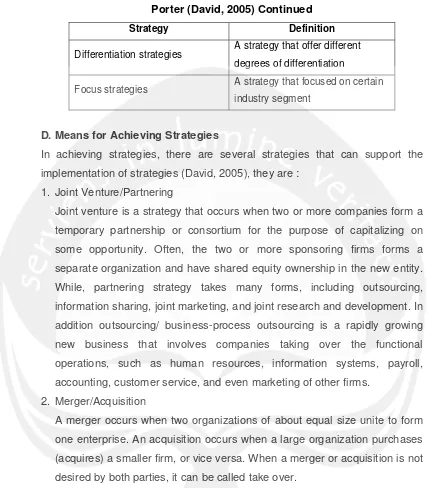
D. Means for Achieving Strategies
In achieving strategies, there are several strategies that can support the implementation of strategies (David, 2005), they are :
1. Joint Venture/Partnering
Joint venture is a strategy that occurs when two or more companies form a temporary partnership or consortium for the purpose of capitalizing on some opportunity. Often, the two or more sponsoring firms forms a separate organization and have shared equity ownership in the new entity. While, partnering strategy takes many forms, including outsourcing, information sharing, joint marketing, and joint research and development. In addition outsourcing/ business-process outsourcing is a rapidly growing new business that involves companies taking over the functional operations, such as human resources, information systems, payroll, accounting, customer service, and even marketing of other firms.
2. Merger/Acquisition
A merger occurs when two organizations of about equal size unite to form one enterprise. An acquisition occurs when a large organization purchases (acquires) a smaller firm, or vice versa. When a merger or acquisition is not desired by both parties, it can be called take over.
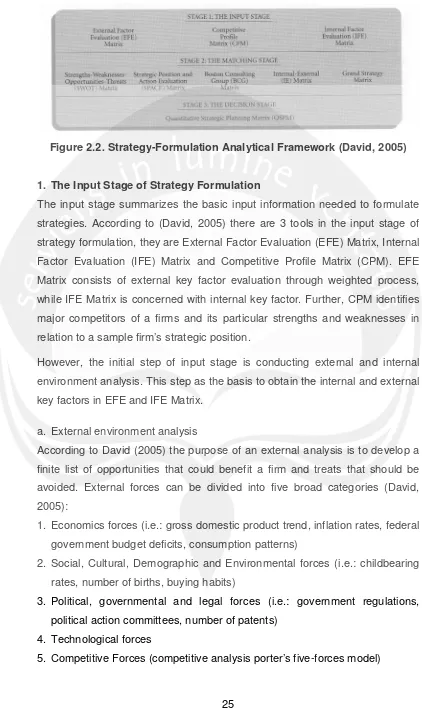
E. Strategy Formulation
Figure 2.2. Strategy-Formulation Analytical Framework (David, 2005)
1. The Input Stage of Strategy Formulation
The input stage summarizes the basic input information needed to formulate strategies. According to (David, 2005) there are 3 tools in the input stage of strategy formulation, they are External Factor Evaluation (EFE) Matrix, Internal Factor Evaluation (IFE) Matrix and Competitive Profile Matrix (CPM). EFE Matrix consists of external key factor evaluation through weighted process, while IFE Matrix is concerned with internal key factor. Further, CPM identifies major competitors of a firms and its particular strengths and weaknesses in relation to a sample firm’s strategic position.
However, the initial step of input stage is conducting external and internal environment analysis. This step as the basis to obtain the internal and external key factors in EFE and IFE Matrix.
a. External environment analysis
According to David (2005) the purpose of an external analysis is to develop a finite list of opportunities that could benefit a firm and treats that should be avoided. External forces can be divided into five broad categories (David, 2005):
1. Economics forces (i.e.: gross domestic product trend, inflation rates, federal government budget deficits, consumption patterns)
2. Social, Cultural, Demographic and Environmental forces (i.e.: childbearing rates, number of births, buying habits)
3. Political, governmental and legal forces (i.e.: government regulations, political action committees, number of patents)
4. Technological forces
According to Porter’s five forces model of competitive analysis on David (2005), the composite of five forces are:
a. Rivalry among competing firms
Rivalry among competing firms is usually the most powerful of the five competitive forces. The strategies pursued by one firm can be successful only to the extent that they provide competitive advantage over the strategies pursued by rival firms.
b. Potential entry of new competitors
Whenever new firms can easily enter a particular industry, the intensity of competitiveness among firms increases.
c. Potential development of substitute products In many industries, firms are in close competition with producers of substitute products in other industries.
d. Bargaining power of suppliers
The Bargaining power of suppliers affects the intensity of competition in an industry, especially when there is a large number of suppliers, when there are only a few good substitute raw materials, or when the cost of switching raw materials is especially costly.
e. Bargaining power of consumers
When customers are concentrated or large, or buy in volume, their bargaining power represents a major force affecting the intensity of competition in an industry.
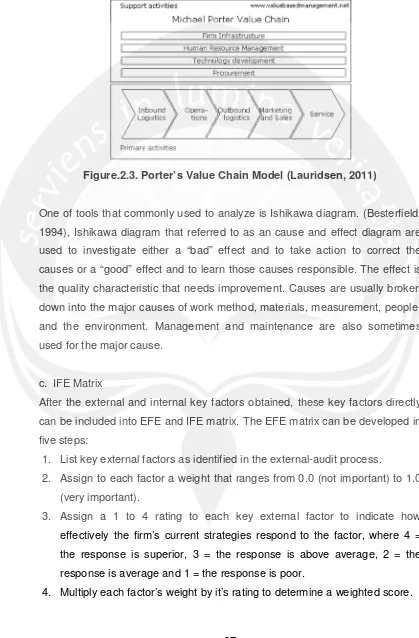
b. Internal environment analysis
activities in one category impact the cost of other activities” (Santos et al., 2009) on (Lauridsen, 2011).
Figure.2.3. Porter’s Value Chain Model (Lauridsen, 2011)
One of tools that commonly used to analyze is Ishikawa diagram. (Besterfield, 1994), Ishikawa diagram that referred to as an cause and effect diagram are used to investigate either a “bad” effect and to take action to correct the causes or a “good” effect and to learn those causes responsible. The effect is the quality characteristic that needs improvement. Causes are usually broken down into the major causes of work method, materials, measurement, people, and the environment. Management and maintenance are also sometimes used for the major cause.
c. IFE Matrix
After the external and internal key factors obtained, these key factors directly can be included into EFE and IFE matrix. The EFE matrix can be developed in five steps:
1. List key external factors as identified in the external-audit process.
2. Assign to each factor a weight that ranges from 0.0 (not important) to 1.0 (very important).
3. Assign a 1 to 4 rating to each key external factor to indicate how effectively the firm’s current strategies respond to the factor, where 4 = the response is superior, 3 = the response is above average, 2 = the response is average and 1 = the response is poor.
5. Sum the weighted scores for each variable to determine the total weighted score for the organization.
d. EFE Matrix
The IFE matrix can be developed in five steps :
1. List key internal factors as identified in the internal-audit process.
2. Assign to each factor a weight that ranges from 0.0 (not important) to 1.0 (very important).
3. Assign a 1-to-4 rating to each factor to indicate whether that factor represents a major weaknesses (rating = 1), a minor weaknesses (rating = 2), a minor strength (rating = 3), or a major strength (rating = 4).
4. Multiply each the weight of factor by the rating to determine a weighted score.
5. Sum the weighted scores for each variable to determine the total weighted score for the organization.
2. The Matching Stage of Strategy Formulation
The matching stage is matching process of a organization between its internal resources and skills and the opportunities and risks created by its external factor. According to (David, 2005) there are 5 tools in the matching stage of strategy formulation, they are :
a. SWOT Matrix
The SWOT Matrix is a matching tool that helps to develop four types of strategies : SO (Strengths-Opportunities) strategies, WO (Weaknesses-Opportunities) strategies, ST (Strengths-Threats) strategies, and WT (Weaknesses-Threats).
b. SPACE Matrix is a matching tool that develop strategies based its axes on internal dimensions (financial strength and competitive advantage), and external dimensions (environmental stability and industry strength).
c. BCG Matrix : graphically portrays differences among divisions in terms of relative market share position and industry growth rate.
e. Grand Strategy Matrix : is a matching tools which based on two competitive position and market growth.
a. SWOT Matrix
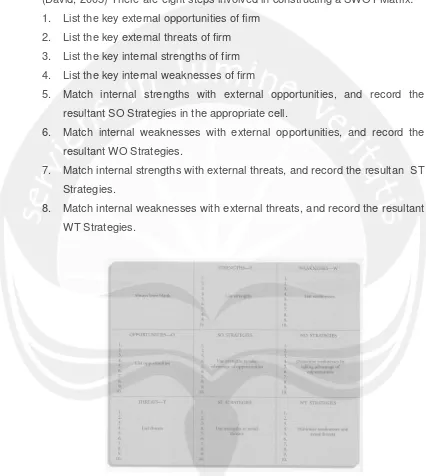
(David, 2005) There are eight steps involved in constructing a SWOT Matrix: 1. List the key external opportunities of firm
2. List the key external threats of firm 3. List the key internal strengths of firm 4. List the key internal weaknesses of firm
5. Match internal strengths with external opportunities, and record the resultant SO Strategies in the appropriate cell.
6. Match internal weaknesses with external opportunities, and record the resultant WO Strategies.
7. Match internal strengths with external threats, and record the resultan ST Strategies.
8. Match internal weaknesses with external threats, and record the resultant WT Strategies.
Figure 2.4. SWOT Matrix (David, 2005)
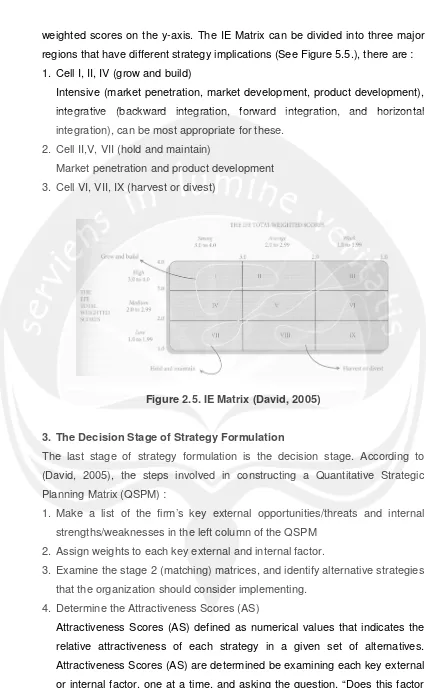
b. Internal-External Matrix
weighted scores on the y-axis. The IE Matrix can be divided into three major regions that have different strategy implications (See Figure 5.5.), there are : 1. Cell I, II, IV (grow and build)
Intensive (market penetration, market development, product development), integrative (backward integration, forward integration, and horizontal integration), can be most appropriate for these.
2. Cell II,V, VII (hold and maintain)
Market penetration and product development 3. Cell VI, VII, IX (harvest or divest)
Figure 2.5. IE Matrix (David, 2005)
3. The Decision Stage of Strategy Formulation
The last stage of strategy formulation is the decision stage. According to (David, 2005), the steps involved in constructing a Quantitative Strategic Planning Matrix (QSPM) :
1. Make a list of the firm’s key external opportunities/threats and internal strengths/weaknesses in the left column of the QSPM
2. Assign weights to each key external and internal factor.
3. Examine the stage 2 (matching) matrices, and identify alternative strategies that the organization should consider implementing.
4. Determine the Attractiveness Scores (AS)
affect the choice of strategies being made?” if the answer to this question is yes, then the strategies should be compared relative to that key factor. The range of AS is 1 = not attractive, 2 = somewhat attractive, 3 = reasonable attractive, and 4 = highly attractive. If the answer of to the above question is no, indicating that the respective key factor has not effect upon the specific choice being made, then do not assign at attractiveness scores to the strategies in that set.
5. Compute the Total Attractiveness Scores (TAT)
Total Attractiveness Scores are defined as the product of multiplying the weight (step 2) by the attractiveness scores (step 4) in each row.
6. Compute the Sum Total Attractiveness Score (STAS).
Add total attractiveness scores in each strategy coloumn of the QSPM. The Sum Total Attractiveness Score (STAS) reveal which strategy is most attractive in each set of alternatives. Higher scores indicates more attractive strategies, considering all the relevan external and internal factor that could affect the strategic decisions.