A STUDY ON NUTRITIONAL STATUS, HEALTH
CHARACTERISTICS, AND PSYCHOSOCIAL ASPECTS
OF THE ELDERLY LIVING WITH THEIR FAMILY AND
OF THOSE LIVING IN NURSING HOME
A Study on Nutritional Status, Health Characteristics, and Psychosocial Aspects of the Elderly Living with heir Family and of hose Living in Nursing Home
Rita Patriasih SPd, MSi Dr. Isma Widiaty SPd, MPd Mira Dewi, MD, MSi Prof. Ali Khomsan, PhD Prof. Dadang Sukandar, PhD
Copyright © 2013
Editor : Nia Januarini
Layout and Cover design : Noval Tensai
Photographer : Sani Etyarsah
Published by PT Penerbit IPB Press Kampus IPB Taman Kencana Bogor
First edition : August 2013
SUMMARY
One of the indicators of development success in a country is increased life expectancy of the citizens. he increased life expectancy of the citizens causes number of elderly increase from year to year. Up to now, Indonesia is ranked as the fourth country with the largest number of elderly after China, India, and United States. BPS estimated that this will continue to raise, shown by percentage of elderly in year 2010 reached 9.58% and will reach 11.20% in 2020 (Mariana & Kadir 2007). Furthermore, the number of senior citizens in Bandung City reached 360,000 people or 15% of the total population in Bandung which was 2.4 million people (Berita Indonesia 2009:1).
he objectives of the study were: (1) to analyze socioeconomic characteristics of the elderly, (2) to analyze food consumption and nutrient intake of the elderly, (3) to analyze nutritional status (anthropometry, Hb level and nutritional risk assessment) of the elderly, (4) to analyze health characteristics (health status, health care, living environment) of the elderly, (5) to analyze psychosocial aspects (perceived happiness, stress, family strength) of the elderly, (6) to describe government and non-government programs for the elderly, (7) to analyze factors afecting nutritional and health status of the elderly, and (8) to analyze the diferences among factors afecting nutritional and health status and psychosocial aspect of the elderly living in nursing home and those living with their family.
vi SUMMARY
he primary data included data on socioeconomic characteristics, nutritional status, health status and psychological aspects of the elderly. he secondary data included programs of local government and NGO for the elderly (type of programs, duration, source of fund, implementation, etc). he methods used to collect data consisted of interview, physical assessment, and Hb analysis depending on the variable measured. Prior to data collection, a set of questionnaires was formulated and tried out.
Data analysis included descriptive statistics, t-test analysis, and regression to analyze factors afecting nutritional and health status and psychosocial condition of the elderly. he data analysis was done by using the Statistical Analysis System (SAS).
he present study shows that sex proportion of elderly was dominated by female (80.9% female vs 19.1% male). Most of the elderly in nursing home were widowers (78.0%). he average of length of education among elderly in non nursing home, which was 7.7 ± 4.6 years, was higher than that among elderly in nursing home (6.8 ± 4.8 years). However, no statistical diference was found in length of education between elderly in nursing home and in non nursing home. he average income of the elderly in nursing home was IDR 408 111. On the other hand, the elderly in non nursing home had higher income with monthly average of IDR 1 298 003.
As side dish, the elderly usually consumed tempeh and tofu with relatively high frequency. For elderly, tempeh/tofu is relatively easy to consume due to their soft texture.
vii SUMMARY
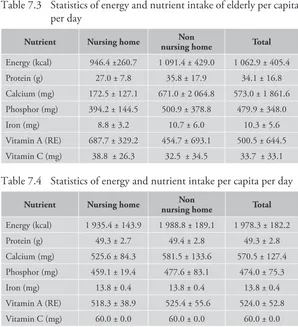
elderly was milk with quantity of 522.0 ml/week for elderly in nursing home and 271.6 ml/week for elderly in non nursing home. his number was relatively small compared to milk consumption of people in developed countries. he calculation of daily water consumption showed that elderly in nursing home consumed water as much as 1,441.6 ml/day and elderly in non nursing home consumed 659.0 ml/ day. Besides, consumption of water for healthy person is 2000 ml/ day so that it can be said that generally elderly consumed less than the adequacy.
Energy adequacy level among elderly was generally low, which was 49.0% for elderly in nursing home and 54.9% for elderly in non nursing home. his low energy adequacy level might relate to the declining appetite among elderly.
he impact of lack of appetite among elderly was low nutrient adequacy level, including protein, mineral, and vitamin. he energy, mineral, and vitamin adequacy level among elderly in nursing home were lower than those in non nursing home (p<0.05), except for vitamin C. he phenomenon of low energy, protein, mineral, and vitamin intake level among elderly in nursing home as well as in non nursing home indicated that group of elderly was susceptible to nutrition problem, which further reduced capacity of the body to prevent various diseases.
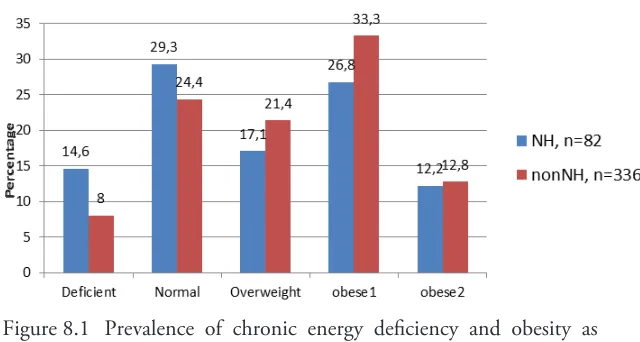
In this study, overnutrition was more prevalent than undernutrition in elderly in both groups, and the prevalence was higher in elderly living in family. he prevalence of central obesity in both groups were higher than the normal (59.8% and 75% in elderly in nursing home and in non nursing home, respectively), and the waist circumference was signiicantly higher in those in non nursing home.
viii SUMMARY
he prevalence of diseases in elderly showed that hypertension and arthritis were the most common diseases found in both groups, followed by dyspepsia syndrome, dyslipidemia and heart disease. he trend of the diseases was similar in both groups, except that the prevalence of cataract was much higher in elderly in nursing home. he cause of this higher prevalence of cataract might have correlation with age, which the age of elderly in nursing home was older than it of other group.
he eforts done by elderly to keep healthy were vary. Most elderly performed worship as their way to keep healthy. Maintaining healthy diet, exercise and avoiding stress were also common in both groups. In general, the awareness of elderly to keep their physical healthy was good, but still needed to be improved.
Sanitation condition among elderly in non nursing home was categorized as good. Almost all elderly had bathroom, family latrine, and garbage disposal facilities in their houses. Generally, place to defecate among elderly was family latrine and only few who defecated in public latrine, river or ditch. In nursing home, the sanitation facilities were considered as good.
he general result on perceived happiness among elderly showed that the highest factor which made elderly feel happy was always grateful with their lives (96.9%). Physical indicator of stress among elderly in the past six months which the most “often” was frequent urination, while the most “rarely” was coughing and the most “never” was excessive sweating. Psychological indicator of stress among elderly in the past six months which the most “often” sufered by elderly was sleepless (insomnia), while the most “rarely” was feeling weak and sluggish and the most “never” was not conident.
ix SUMMARY
he elderly in nursing home was better in aspect of psychological strength, while elderly in non nursing home was better in aspect of physical and social strength. he study result showed that the most potential factor causing low psychological welfare of elderly was feeling worry about the future. When compared, this was sufered more by elderly in non nursing home.
Government programs related to welfare of the elderly was under Ministry of Social Afairs of Republic of Indonesia. During period of 2009-2014, services which were given to the elderly in nursing home included: regular service, daily service, day care service, and cross-subsidy service which all was conducted in 237 nursing homes (2 nursing homes own by Ministry of Social Afairs, 70 nursing homes own by local government, and 165 nursing homes own by private/ community). Beside Ministry of Social Afairs, Ministry of Health also had service for elderly program, which was Integrated Development Post (Posbindu). Type of services which are given in Posbindu include: nutritional status examination through measuring body weight and height, blood pressure measurement, hemoglobin examination using, examination on glucose in urine as early detection of diabetes etc.
Regression analysis result showed that factors signiicantly inluenced nutritional status assessed with MNA score were age of elderly (β=-0.104; p=0.030), protein adequacy level (β=0.147; p=0.041) and education level (β=4.316; p=0.000), with adjusted R square 0.128. As elderly age increased, MNA score decreased. Protein adequacy level had signiicant positive efect on MNA score, as protein adequacy was fulilled, malnutrition risk in elderly would decrease. Among inluencing variables, education had the strongest inluence. As education level became higher, risk of elderly becoming malnourished would be lower.
x SUMMARY
signiicance, it was in accordance with physiologic fact and conirmed many previous researches.
For elderly who lived in nursing home, there was no factor that signiicantly inluence nutritional status assessed with MNA score. Diferent result was obtained in elderly who lived in non-nursing home, in which age and length of education had signiicant efect to MNA score.
ACKNOWLEDGMENT
LIST OF CONTENT
Page SUMMARY ... ACKNOWLEDGMENTS ... LIST OF CONTENT ... LIST OF TABLES ... LIST OF FIGURES ... LIST OF APPENDIX ...
I
INTRODUCTION ...
1.1 Background ... 1.2 Goals and Objectives ...
2 REVIEW OF LITERATURES ...
2.1 Elderly ... 2.2 Nutritional Status of Elderly ... 2.3 Health Status of Elderly ... 2.4 Psychosocial Aspect of Elderly ... 2.5 Mini Nutritional Assessment (MNA) ...
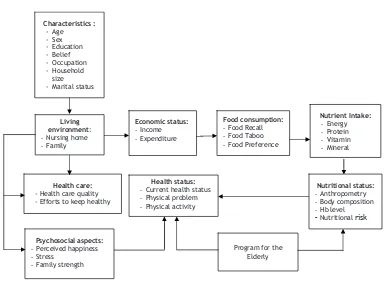
3 CONCEPTUAL FRAMEWORK ...
4 METHOD ...
xiv LIST OF CONTENT
4.5 Data Processing ... 4.6 Data Analysis ... 4.7 Relevance of Research ...
5 GENERAL DESCRIPTION OF NURSING HOME
IN BANDUNG ...
6 SOCIO ECONOMIC CHARACTERISTICS ...
6.1 Characteristic of Elderly ... 6.2 Income and Expenditure ...
7 FOOD CONSUMPTION
AND NUTRIENT INTAKE ...
7.1 Food Consumption ... 7.2 Nutrient Intake ...
8 NUTRITIONAL STATUS ...
8.1 Nutritional Status by BMI... 8.2 Nutritional Status by Waist Circumference ... 8.3 Anaemic Status ... 8.4 Nutritional Risk Assessment ...
9 HEALTH STATUS ...
9.1 Health Status ... 9.2 Health Care ... 9.3 Living Environment ... 9.4 Personal Hygiene ...
10 PSYCHOSOCIAL ASPECTS ...
xv LIST OF CONTENT
11 PROGRAMS FOR ELDERLY ...
12 FACTORS INFLUENCING NUTRITIONAL
STATUS OF ELDERLY ...
13 DIFFERENCES OF FACTORS INFLUENCINGNUTRITIONAL STATUS
OF ELDERLY
IN NURSING HOME
ANDNON NURSING HOME ...
14 CONCLUSIONS AND RECOMMENDATIONS ...
14.1 Conclusions ... 14.2 Recommendations ...
15 BIBLIOGRAPHY ...
LIST OF TABLES
Page Table 4.1 Data collected and the methods ... Table 4.2 Elements of Mini Nutritional Assessment (MNA) ... Table 4.3 Six variables of perceived happiness ... Table 4.4 hree aspects of family strength ... Table 4.5 he scale of depression assessment ... Table 5.1 Characteristics of the nursing home (PSTW)... Table 5.2 Characteristics of nursing home building ... Table 5.3 Availability of bathroom, latrine and garbage disposal ... Table 5.4 Water source of nursing home ... Table 6.1 Distribution of sociodemographic characteristics
of the elderly ... Table 6.2 Distribution of education level of the elderly ... Table 6.3 Distribution of type of work among elderly ... Table 6.4 Economic status of elderly (IDR/cap/month) ... Table 6.5 Statictics of non food expenditure among elderly
(IDR/cap/month) ... Table 7.1 Statictics of food consumption frequency
of calcium food source (times/month) ... Table 7.2 Statistics of beverage consumption among elderly
(ml/week) ... Table 7.3 Statictics of energy and nutrient intake
of elderly per capita per day ... Table 7.4 Statictics of energy and nutrient adequacy
xviii LIST OF TABLES
Table 7.5 Statistics of energy and nutrient adequacy level
per capita per day ... Table 7.6 Distribution of elderly based on energy and
protein adequacy level ... Table 8.1 Nutritional status by screening MNA score of the elderly ... Table 8.2 Variables of the screening Mini Nutritional Assessment (MNA)
in elderly in nursing home and non nursing home ... Table 8.3 Distribution of MNA score by sex in elderly
in nursing home and non nursing home ... Table 9.1 Distribution of health indicators of elderly
in nursing home and non nursing home ... Table 9.2 Distribution of diseases in elderly ... Table 9.3 Physical activity problem among elderly ... Table 9.4 Type of health examination among elderly ... Table 9.5 Distribution of elderly by access to health care ... Table 9.6 Distribution of elderly by source of inancial support
for medication ... Table 9.7 Eforts to keep healthy ... Table 9.8 Distribution of elderly in non nursing home
by criteria of housing ... Table 9.9 Distribution of source of lighting and fuel among elderly
in non nursing home ... Table 9.10 Distribution of elderly in non nursing home by criteria
of environmental sanitation ... Table 9.11 Distribution of elderly in non nursing home by source
of drinking water ... Table 9.12 Distribution of elderly by source of water for cooking ... Table 9.13 Distribution of elderly based on source of water
xix LIST OF TABLES
Table 10.1 Perceived happiness ... Table 10.2 Physical indicator of stress of elderly
in the past 6 months ... Table 10.3 Psychological indicator of stress of elderly
in the past 6 months ... Table 10.4 Score of depression among elderly ... Table 10.5 Distribution of elderly by family physical strength ... Table 10.6 Distribution of elderly by aspect
of family psychological strength ... Table 10.7 Distribution of elderly by family social strength ... Table 10.8 Scores of aspect of strength of elderly ... Table 12.1 Analysis results of factors inluencing MNA score
in elderly ... Table 12.2 Analysis results of factors inluencing waist circumference
in elderly ... Table 12.3 Analysis results of factors inluencing Hb in elderly ... Table 13.1 Factors inluencing MNA score in elderly
(nursing home) ... Table 13.2 Factors inluencing MNA score in elderly
(non-nursing home) ... Table 13.3 Analysis results of factors inluencing waist circumference
in elderly (nursing home) ... Table 13.4 Factors inluencing waist circumference
LIST OF FIGURES
Page Figure 3.1 Conceptual framework ... Figure 8.1 Prevalence of chronic energy deiciency and obesity
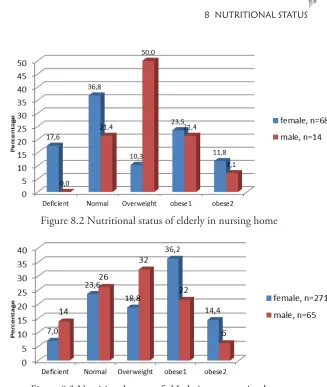
as assessed using BMI ... Figure 8.2 Nutritional status of elderly in nursing home ... Figure 8.3 Nutritional status of elderly in non nursing home ... Figure 8.4 Prevalence of normal waist circumference
and central obesity in elderly ... Figure 8.5 Nutritional status by waist circumference of elderly
in non nursing homes ... Figure 8.6 Nutritional status by waist circumference of elderly
LIST OF APPENDIX
Page Picture 1 Weight and height measurement ... Picture 2 Blood pressure measurement ...
1 INTRODUCTION
1.1
Background
One of the indicators of development success in a country is increased life expectancy of the citizens. he increased life expectancy of the citizens causes number of elderly increase from year to year. Up to now, Indonesia is ranked as the fourth country with the largest number of elderly after China, India, and United States. BPS estimated that this will continue to raise, shown by percentage of elderly in year 2010 reached 9.58% and will reach 11.20% in 2020 (Mariana & Kadir 2007). Furthermore, the number of senior citizens in Bandung City reached 360,000 people or 15% of the total population in Bandung which was 2.4 million people (Berita Indonesia 2009:1).
he elderly are a group of people who are experiencing a changing process gradually in a certain period. Old age or usually called as late-adult is a living period which is marked by change or decrease in body function, which is usually started in diferent ages for diferent individuals (Papalia & Old 2001). Ministry of Health (Depkes RI 2006) deined the elderly as follow:
1) People who enter a preparation period of the old age which show mental maturity (55-59 years of age).
2) he early of being old age, which is a group of people who have just entered the old age (60-64 years of age).
3) A group of elderly who have high risk to experience some degenerative diseases (more than 65 years of age).
elderly are the citizens that experience the continuous aging process, which is marked by decrease in body resistance and susceptibility to diseases that can cause death. his is due to change in the structure and function of cell, tissue and organ system; 2) Economic Aspects. Economically, old aged citizens are seen as burden, instead of human resource. Many people think that old age life does not give any advantage, even they consider that old age life is often perceived negatively as burden for the family and other citizens; 3) Social Aspects. Socially, the elderly are a social group. In the western country, the elderly belong to a social stratum below young generation. his is seen from their involvement in economic source, inluence in decision making and wide social relationship that is getting decreased. On the contrary, in Indonesia, the elderly belong to a high social class that should be respected by young generation (Wijayanti 2008).
3 I INTRODUCTION
he appearance of diseases in the elderly is often diferent from that in young adults because disease in the elderly is the combination of disabilities which appear due to the diseases and the aging process, that is the process of gradual losing of cell ability to regenerate and to keep the normal structure and function so that it cannot bear injury as well as infection nor repair the damage (Siburian 2011). he elderly often sufer from immobility (cannot move), instability (not stable in standing up and walking or easy to fall down), incontinence (often poop or urinate), intellectual impairment (intellectual damage/ dementia), infection, vision impairment in vision, hearing, taste, smell, communication, convalescence, skin integrity, impaction, isolation (depression), malnutrition, impecuniousness (do not have any money), iatrogenesis (sufering a disease due to drugs), insomnia (sleeplessness), immune deiciency (easy to sufer from disease) and impotence (inefectiveness).
Since the beginning of their life until being elderly, every person has the basic psychological needs. Some of the needs of the elderly are usually need for feeling comfortable and require comfortable environment. he fulillment level of the need depends on the elderly themselves, family and their environment. If those needs are not fulilled, some problems will emerge in the life of the elderly and decrease their independence (Setiati 2000).
Nowadays, there is a tendency in the community to separate the elderly by “entrusting” them into a house for the elderly that is owned by government or private institution. As stated in Mujiyati’s research, there were some elderly who love to live in nursing home rather than to live in their own family house. hey thought that living in nursing home is more fun than live in their own house because in nursing home they can get a lot of friend. And based on research by Bessi (2007), the reason why the elderly become the residents of nursing home was because of poverty, being neglected by their family or having no family member. Entrusting the elderly people in nursing home is not a mistake since there is positive side of it. Nevertheless, the love from the family is the most important thing so that it is advised that family should take care of the elderly in their own house by paying attention to their psychological condition (Mujiyati 2009).
5 I INTRODUCTION
1.2 Goals and Objectives
1. To analyze socioeconomic characteristics of the elderly.
2. To analyze nutritional status (anthropometry, Hb level and nutritional risk assessment) of the elderly.
3. To analyze food consumption and nutrient intake of the elderly. 4. To analyze health characteristics (health status, health care, living
environment) of the elderly.
5. To analyze psychosocial aspects (perceived happiness, stress, family strength) of the elderly.
6. To describe government and non-government programs for the elderly.
7. To analyze factors afecting nutritional and health status of the elderly.
2 REVIEW OF LITERATURE
2.1 Elderly
Old age group (elderly) is community group aged more than 60 years. his deinition is common and used by several institutions, such as Ministry of Health of Indonesia and WHO. In more speciic, Law Number 4 Year 1965 deined elderly as an individual which related to the old age, whose no capability to earn money for his/her daily basic needs.
Elderly is often being related to aging. During aging, body system overcome decline in body function and capability to repair tissue damage. Body fat mass and visceral fat increase, while lean body mass decrease. he decline in mass, muscle strength and function caused by aging, which called as sarcopenia, reduce mobility of elderly, increase risk of falling, and alter metabolism rate of the body (Wellman & Kamp 2008).
Wellman and Kamp (2008) categorized aging theory in two general categories which are predetermined and accumulated damage theories. he categorization of the two categories above is presented as follow:
1 Predetermined heory
that living time period is determined by genetic factor. Rate of living theory stated that every living creature has vital substance in limited number and when it reach exhausting border, aging and death occur. Oxygen metabolism theory stated that living creature, especially animal, with the highest metabolism is likely to have shortest living period. Immune system theory stated that cells overcome limited ission which rapidly reduces immune system function, excessive inlammation, aging, and death.
2 Accumulated Damage heory
Accumulated damage theory is theory stating that there is systemic reduction in body function overtime. he theory consists of cross-link theory, wear and tear theory, free radical theory, and somatic mutation theory. Cross-link theory stated that overtime, there is abnormal attachment among DNA protein and other structural models or cross-link which leads to reduction in mobility, elasticity, and cell permeability. Wear and tear theory stated that years of damage in cell, tissue, and organ will rapidly come and cause death. Free radical theory stated that accumulated and random damage due to radical oxygen will slowly cause cell, tissue, and organ function stop. Somatic mutation theory stated that genetic mutation due to oxidative radiation and other factors accumulated will cause cell worsen and lose its function.
2.2 Nutritional Status of Elderly
9 2 REVIEW OF LITERATURES
Assessment of nutritional status using anthropometric method is conducted by directly measuring dimension and composition of the body from various ages and nutrition level (Jellife 1996). Anthropometric method is commonly used to assess nutritional status from imbalance in energy and protein intake and expenditure. Nutritional status of elderly can be measured by body mass index (BMI). BMI is calculated by comparing the body weight in kilogram with square of body height in meter.
Based on equation above, to measure BMI, two data are needed, which are body weight and height. Hunckback which often happen to elderly causes height measurement of elderly not accurate. Fatmah (2008) stated that body height of elderly can be predicted by using arm span, knee height, and sitting height. Determination of measurement type to predict body height is adapted to capability of the elderly. Arm span is recommended as the best predictor. However, if the elderly is not able to expand the arm, knee height is suggested to be measured. If the elderly also ind diiculty during knee height measurement, the last predictor recommended is sitting height. he equation models of body height prediction (in cm) based on the three parameters are presented as follow:
a. Male
Body height = 23.247 + 0.826 arm span Body height = 56.343 + 2.102 knee height
Body height = 58.047 + 1.210 sitting height b. Female
Other anthropometric measurement is abdominal circumference. Abdominal circumference measurement is used to determine central obesity status related to metabolic syndrome. Abdominal circumference shows fat accumulation in stomach or abdomen. WHO (2011) stated that abdominal circumference has relationship with risk of cardiovascular disease, type 2 diabetes mellitus, hypertension, death, colorectal cancer and breast cancer. Size of abdominal circumference which is still in low risk is less than 102 cm for male and less than 88 cm for female.
Other measurement of nutritional status which also commonly used is hemoglobin concentration examination. Hemoglobin concentration examination is used to determine anemia status. Landi
et al. (2007) stated that higher hemoglobin concentration is related to better stamina among elderly.
2.3 Health Status of Elderly
Aging is also related to decline in health status due to decline in body organ function. During aging, there is disturbance in body function and decline in body capability to manage living process, such as presented as follow:
1. Bone and Muscle
11 2 REVIEW OF LITERATURES
Overweight will afect health, which is giving additional burden to the bone causing arthritis or joint inlammation. Overweight also increase risk of degenerative disease, such as diabetes, hypertension, heart disease, cancer, and stroke (Soekirman 2006).
Health problem which is also often sufered by elderly is arthritis or inlammation in the joints. NIA (2012) classiied arthritis as osteoarthritis, rheumathoid arthritis, and gout. Osteoarthritis is arthritis which caused by depletion of cartilage tissue as bearing joints so that bone friction happens. Rheumatoid arthritis is autoimmune disease which causes pain, inlammation, and stifness in the joints. On the other hand, gout is accumulation of crystal as residue in purine metabolism in the joints which causes joint inlammation.
2. Heart and Blood Vessel
Aging causes change in heart and blood vessel, including reduction in arterial wall illing, reduction in maximum heart rate, reduction in responsivity on β-andrenergic stimuli, increase in ventrical muscle mass, and slowdown in ventrical relaxation (Wellman & Kamp 2008). Moreover, Soekirman (2006) emphasized that by entering old age, heart valve become stif and thickened, pericardium will be coated by fat, and blood vessel reduce its elasticity and overcome calciication. his causes reduced capacity to pump blood and deliver oxygen. Heart in old age does not endure physical stress, such as increase in blood pressure, over exercise, and fever. Systolic blood pressure usually increases during aging, while diastolic blood pressure does not change much.
3. Tooth Loss
4. Gastrointestinal System
Production of water and enzyme in gastrointestinal tract is reduced during aging so that appetite and capability to absorb nutrients decrease. Reduced saliva secretion cause reduction in capability to chew and swallow food. Weakened tongue and cheek muscle also make chewing and swallowing process diicult. Reduction in mucosa and gastric acid production cause digestion and absorption of nutrient decrease. Reduction in nutrient absorption increase risk of chronic malnutrition, such as osteoporosis and anemia (Wellman & Kamp 2008). Elderly also ind diiculty in defecation due to slower bowel movement, low iber consumption, medicine and gastrointestinal infection.
5. Renal System
Renal overcome cell loss whose function to produce urine so that it cannot function optimally and bloodstream reduce. As the efect, salt and sugar are accumulated in the blood, and secretion of residue from protein utilization reduces (Soekirman 2006).
6. Endocrine System
here is disturbance in endocrine function so that cell metabolism and capability to cope with stress reduce, while insulin and reproduction hormone production reduce (Soekirman 2006).
7. Immune System
13 2 REVIEW OF LITERATURES
bone marrow, and lymphatic system. Both immune system decrease overtime. his body immune reduction in elderly causes susceptibility to infectious disease (NIA 2011).
8. Nervous System
here is reduction in capability to deliver nerve impulse which may due to age. he decline in cognitive function, strength, reaction, coordination, sensation, and routine works can reach 10-90% (Wellman & Kamp 2008). Brain cell tend to break down and memory reduces so that senility happens. here is also disturbance in sleeping pattern, making elderly sleeps more at daytime than at night (Soekirman 2006).
9. Respiratory System
Elasticity of lungs decreases by aging so that capability of body to do physical activity is also decreases. here is also reduction in capability of lungs to inhale O2 and exhale CO2 (Soekirman 2006).
10. Sense
11. Skin
he skins become dry, wrinkled, forming pigmentation, and capillary under the skin is easily broken (bruised). Hair is graying and easily fall (Soekirman 2006).
2.4 Psychosocial Aspect of Elderly
Psychosocial aspect is one of the parts of mental health. According to Law Number 23 Year 1992 regarding Health, mental health is one of the points to maintain in order to create optimal health status in community. Psychosocial aspect assessed in this study includes three indicators, which are perceived happiness, stress level, and family strength of elderly.
Happiness and life satisfaction according to Ryf (1989) is one of the indicators of well-being. Moreover, Ryf explained that positive perceived happiness contain aspect on self-acceptance, positive relations with others, autonomy, environmental mastery, purpose in life, and personal growth.
15 2 REVIEW OF LITERATURES
2.5 Mini Nutritional Assessment (MNA)
Mini Nutritional Assessment (MNA) is an easy and inexpensive screening to detect tendency of complication development due to malnutrition (Gazzotti 2000). Based on Miller (2004), MNA is the most suitable screening tool for elderly because it is fast, easy to use, and efectively relects nutritional status of elderly. MNA is widely used in various managements as trusted and valid assessment tool to identify malnutrition or risk of severe malnutrition among elderly. MNA is aimed to identify whether someone is at risk of malnutrition or not so that nutrition intervention can be determined early without assessment by special nutrition team (Vellas 1999).
MNA is screening tool validated specially for elderly, has high sensitivity, speciic, eligible, widely used as screening method and recommended by national and international scientiic and clinical organization. MNA is fast, easy to use and does not need much time to answer the questions, does not need speciic training, and does not need laboratory examination (MNA 2011 cited in Oktariyani 2012).
MNA has two types, which are full MNA and short form MNA. Full MNA includes 18 items grouped into 4 parts, which are anthropometric assessment (BMI which calculated from body weight and height, body weight loss, mid-upper arm circumference and calf circumference), general assessment (life style, medicine, mobility and marker of depression or dementia), dietary assessment (number of food, food and water intake and independency in eating) and subjective assessment (individual perceived health and nutritional status). Full MNA can be completed in less than 15 minutes and every answer has score which will inluence inal score with maximum score of 30. Based on cut-of of full MNA, score of ≥24 indicates good nutrition, 17-23.5 risk of malnutrition and <17 malnutrition (Guigoz et al. 1996; Guigoz
he second type of MNA is short form MNA. Short form MNA is developed and validated to make possible 2 screening processes among low risk population to maintain validity and accuracy of full MNA (Guigoz 2006). Short form MNA is developed in 2001 by Rubenstein to reduce time for screening. Short form MNA can identify someone with malnutrition in two stages of process, when someone is identiied as at risk using short form MNA, further assessment is given to conirm the diagnosis and determine next intervention plan (Rubenstein 2001).
Short form MNA consists of 6 questions for screening which each question has diferent score for each answer. hen, every score is summed as total score. Maximum score of short form MNA is 14. Total score of ≥12 shows normal nutritional status or not at risk and therefore does not need further assessment. However, score of ≤11 shows risk of malnutrition so that further assessment is necessary by illing out full form MNA (Guigoz et al. 2006).
17 2 REVIEW OF LITERATURES
he next questions are: did the elderly sufer from psychological stress or acute disease in the past 3 months, if yes, the score is 0, if no, the score is 2; do the elderly sufer from neuropsychological problem, if sufer from dementia or severe depression, the score is 0, if mild dementia, the score is 1 and if do not sufer from neuropsychological problem, the score is 2. After all questions are answered, the next stage is calculating BMI. If BMI less than 19, the score is 0; if 19-21, the score is 1; if 21-23, the score is 2; if 23 or more, the score is 3. If BMI is not able to be calculated, it can be determined by measuring calf circumference, if the measurement is less than 31, the score is 0; if 31 or more, the score is 3 (MNA 2011).
After the result of screening is obtained and total score is summed, if the elderly is identiied possible to sufer from malnutrition, the assessment to the elderly is continued by asking 12 questions. he questions are: is the elderly live independently (not in home care, nursing home or hospital), if no, the score is 0 and if yes, the score is 1; is the elderly take more than 3 type of drugs per day, if yes, the score is 0, and if no, the score is 1; is the elderly has pressure sores/skin ulcers, if yes, the score is 0, and if no, the score is 1.
Water which commonly consumed by elderly every day is pure water, juice, cofee, tea, milk, etc. his is asked to the elderly. If the elderly drink less than 3 glasses, the score is 0; if 3-5 glasses, the score is 1; and if more than 5 glasses, the score is 2. hen, the question is how the elderly eat, if cannot eat without help, the score is 0; if can eat by themselves but ind diiculty, the score is 1; and if can eat by themselves without problem, the score is 2.
he elderly is also asked about perceived nutritional status, if the elderly perceive them with nutritional problem, the score is 0; if the elderly doubt/do not know their nutritional problem, the score is 1; and if the elderly perceive them without nutritional problem, the score is 2. Beside perceived nutritional status, the elderly is also asked to compare their health status with other people of the same age, if the elderly feel not better than others, the score is 0; if the elderly do not know, the score is 1; and if the elderly feel better than others, the score is 3.
3 CONCEPTUAL
FRAMEWORK
he life expectancy of Indonesian people is increasing in line with the increase of their living and health service standards. he condition brings efects to the increase of the number of the elderly people in Indonesia. According to the report of World Health Organization (WHO) in year 1998 (Life in the 21st Century, A Vision for All), the life
expectancy of Indonesian people in year 2025 is 73 years. And now, the life expectancy of Indonesian people reaches 70 years.
In the next twenty years, it is estimated that the number of the elderly people will reach 1.2 billions in the world, and 70% of them comes from the developing countries. he number of the elderly people in Indonesia in year 2000 is 14 millions, and in year 2020 will increase to be more than 28 millions.
he increasing number of elderly people will bring some efects to the social economic in the family as well as community and government. he economic implication that is important from the increasing number of elderly people is the increase the old age dependency ratio. Every citizen in the productive age will support more elderly (Rahayu 2009). Kusuma and Anwar (1994) predicted that the number of elderly people in 1995 is 6.93% and 2015 becomes 8.74%, which means that in 1995 at least 100 productive citizens must support 7 elderly of upper 65 years old and in 2015 at least 100 citizens must support 9 elderly of upper 65 years old. he dependency of elderly people is caused by the decrease of their physical and psychological condition; in other words they experienced the negative development.
psychologically or socioeconomically. Older the people, more the deterioration they will experience, especially in their physical ability which may lead to the decrease of their social roles. his will also cause the disorder in fulilling their living need so that they depend on someone’s help. Old age is not only marked by physical decrease, but also inluenced by psychological condition (Rahayu 2009).
he aging process which causes the decrease in physical condition of elderly can be equalized to low physical itness. Physical itness is someone’s ability to do daily activity without causing fatigue. Physical itness is inluenced by many factors, such as age, sex, BMI, blood pressure, hemoglobin level, and physical activity. As a whole, the advantages of physical itness for the elderly are to reduce expenditure for health care, increase productivity, and raise status and dignity of the elderly. Based on the survey of Physical Fitness Norm Makingfor the elderly by Ministry of Health in 2002, around 85% of the elderly had low physical itness.
he problems of physical deterioration among elderly people will inluence their psychological condition. Akhmadi (2009) stated that psychological itness problems of the elderly come from four aspects, namely, physical, psychological, social, and economic. hose problems are marked by unstable emotion, easy to be ofended, easy to feel disregarded, disappointed, unhappy, feel loneliness, and feel useless. he elderly with those problems are sensitive to get psychological disorder, such as depression, anxiety, and psychosis. Generally, the mental health problem of the elderly is a matter of adaptation. he adaptation is due to change from the previous condition (being strong, working, and having income) to a decline.
21 3 CONCEPTUAL FRAMEWORK
lacking social relation) gives the elderly certain burden and makes them tend to be less happy. Ryf (1989) as cited by Latifah (1999) believed that one of the ways that can be done by the elderly to deal with the problem is trying to achieve psychological well-being. Further, Bradburn deined psychological well-being (PWB) as happiness and can be seen through several dimensions. hose dimensions are autonomy, environmental mastery, personal growth, positive relations with others, purpose in life, and self acceptance. PWB describes the extent to which individuals feel comfortable, peaceful, and happy based on subjective assessments and how they view the achievement of their own potentials. Hurlock (1991) mentioned that the PWB or happiness in the elderly depends on the fulillment of the three aspects of happiness, namely acceptance, afection, and achievement. When an elderly cannot fulill all the three aspects, it will be diicult for them to be able to achieve happiness.
he period of aging is the last period in human development. his is where a person experiences natural decrease of physical and social function. Internal and external problems which faced by the elderly can be stressful. Stress in the elderly is the pressure experienced by the elderly as result of source of stress with assumption of aging process and problems/limitations along the aging process. Stress level can be grouped into three parts, namely low, medium and high level. A person’s stress level can be determined by observing the symptoms of stress which both physical and emotional symptoms (Wilkinson 1989 cited by Furi 2006).
need adequate nutrition to support and maintain their health. Some factors that inluence nutrition need, among others are: decrease in food digestion process, decrease in appetite, nutrient absorption. he elderly habit in consuming food is related with decrease in physiologic body function, especially in digestion system which the elderly have tendency to choose and consume more food that is easy to digest (Whitney 1998).
here is a norm which considers that the old people are an inseparable part of the family, old people should be respected by young people. Because of that, children have responsibility to take care of their old family members. In some communities, the elderly live with their children’ family, get food and also care from the family members who live with them. On the other hand, in some other communities, family members entrust their elderly to live in nursing home together with other elderly. he diferences in living environment will give diferent impact on their quality of life.
Psychologically, elderly often feel like to live in alienation and this may cause depression and decrease in body resistance that leads to the emergence of various kinds of diseases (Anonim 2011). Growing old is also associated with the deterioration of the functions of body organs so that many diseases, especially degenerative disease, can easily attack their body.
23 3 CONCEPTUAL FRAMEWORK
24 Characteristics : - Age - Sex - Education - Belief - Occupation - Household size - Marital status
Economic status:
-Income -Expenditure
Living environment: -Nursing home -Family
Health care:
- Health care quality - Efforts to keep healthy
Program for the Elderly
Food consumption:
-Food Recall -Food Taboo -Food Preference
Nutritional status:
-Anthropometry -Body composition -Hb level
-Nutritional risk
Health status:
-Current health status -Physical problem -Physical activity
Psychosocial aspects:
-Perceived happiness -Stress
-Family strength
Nutrient Intake:
[image:48.439.112.496.52.334.2]4 METHOD
4.1 Research Design and Time
he design of the research was cross sectional study. he research was taken place in all nursing homes in Bandung and nearby. he whole research activity was conducted in 12 months.
4.2 Sampling
his study was carried out to the elderly (aged > 55 years old) as sampling unit consisting of 4 categories i.e: living in nursing home, living with family, living alone but with close family within one sub village or 10-15 minutes by foot, and living alone without close family nearby.
Eighty two elderly living in nursing home were selected as samples. Another 336 elderly living outside nursing home were chosen purposively. he elderly who were selected were totally fed by mouth with typical eating utensils and were not having parenteral feeding. hey had no amputation so that body weight did not require approximate correction for missing limb. hey lived in nursing home for at least 6 months without any hospitalization more than one week. his assured that nutritional status most relects it in the nursing home, and not in other place. hey were able to communicate and agreed to participate in this study.
4.3 Data Collection
used to collect data consisted of interview, physical assessment, and Hb analysis depending on the variable measured. he type of data, variables, and method of collection are listed below.
Table 4.1 Data collected and the methods
Data Variables Indicators Methods
Socioeconomic characteristics
Individual characteristics
- age - sex
Interview using questionnaire
Social - education
- occupation - family member - marital status
Interview using questionnaire
Economic - personal income - family income - expenditure
Interview using questionnaire
Nutritional status Anthropometric - weight - knee height
Physical assessment
Hematology - blood hemoglobin level
Finger prick HemoCue Nutritional intake - food consumption
- food preference - food taboo
Interview using questionnaire
Nutritional risk - Mini Nutritional Assessment
Interview using questionnaire Psychosocial
aspects
Perceived happiness Psychological Well-Being (PWB):
- Self-Acceptance - Positive relations with
others - Autonomy - Environmental
mastery - Purpose in life - Personal growth
Interview using questionnaire
Stress - level of stress - symptoms of stress
Interview using questionnaire Family strength - physical
- social
27 4 METHOD
he data on socioeconomic characteristics contains individual characteristics (ages, sex), social characteristics (job, education, family members, marital status), and economic status (personal income, family income).
Data regarding nutritional status contained anthropometric data, hemoglobin (Hb) level, nutrient intake, nutritional risk (measured by mini nutritional assessment/MNA®). he details of data regarding nutritional status were presented as follow:
Anthropometric measurements
Body weight was measured by bathroom scale with precision of the nearest 0.1 kg. For elderly whose height was not easily measured in standing position, their height was estimated from knee height as recommended for the old people who often have diiculty to stand straight. he procedure of knee height measurement was lying supine, both knee and ankle of the subject was measured at 90-degree angles. One blade of sliding Medford caliper was placed under the heel of the foot, and the other blade was placed on the anterior surface of the thigh over the femur. he shaft of the caliper was held parallel to the long axis of the lower leg, and pressure is applied to compress the tissue. he measurement was recorded to the nearest 0.1 cm, and converted to height using the following formula:
Men = 69.38 + (1.924 X knee height in cm) Women = 50.25 + (2.225 X knee height in cm)
Hb analysis
Blood was taken by inger prick method and analyzed by portable Hb analyzer (Hemo-Cue@). Paramedic was responsible for this task.
Nutrient intake
Nutritional risk
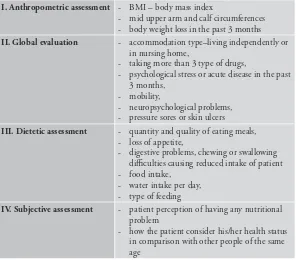
Nutritional risk was assessed using a Mini Nutritional Assessment (MNA) questionnaire containing diet and personal history and anthropometric measurements (Guigoz 1997). he element of MNA was described in the following table.
[image:52.439.66.362.287.547.2]he data on health status was obtained from interview about health status (current health condition, physical disorder, physical activity), health service (the quality of the health service that was received by the subjects, eforts to keep them healthy), and the condition of their housing (sanitation, source of drinking water, personal hygiene), and also from observation of the subjects’ environment.
Table 4.2 Elements of Mini Nutritional Assessment (MNA)
I. Anthropometric assessment - BMI – body mass index
- mid upper arm and calf circumferences - body weight loss in the past 3 months
II. Global evaluation - accommodation type–living independently or in nursing home,
- taking more than 3 type of drugs,
- psychological stress or acute disease in the past 3 months,
- mobility,
- neuropsychological problems, - pressure sores or skin ulcers
III. Dietetic assessment - quantity and quality of eating meals, - loss of appetite,
- digestive problems, chewing or swallowing diiculties causing reduced intake of patient - food intake,
- water intake per day, - type of feeding
IV. Subjective assessment - patient perception of having any nutritional problem
29 4 METHOD
Data regarding psychological aspects of the elderly people were also obtained from interview, such as perceived happiness (self-acceptance, positive relations with other, autonomy, environmental mastery, purpose in life, personal growth), stress (level and symptom of stress), and family strength (physical, social and psychological strength).
4.4 he Control of Data Quality
Prior to data collection, a set of questionnaires was formulated and tried out. he revision was done to the questionnaire according to the result of the tryout. Supervision had been done by the researchers while the data collection was carried out by the enumerators. he questionnaire that has been completed was checked by the researchers.
4.5 Data Processing
Data processing was begun by preparing the ile structure in MS Excel that contained sheets completed with variables for entering the data. he data from the questionnaire were entered to the sheets. Editing and cleaning was applied for the data which were already entered. Editing was applied to data which were not suitable with the data in the questionnaire. Cleaning was applied by excluding the extreme data. he next step was elicitating variables on income, expenditure, nutrient intake, nutritional risk, etc.
Nutrient intake. Data on food consumption obtained using recall method were transformed into nutrients, namely, energy, protein, fat, calcium, phosphor, zinc, and vitamin A in Excel 2000. hese data were used to calculate nutrient adequacy which were consumed based on RDA (Recommended Dietary Allowance).
Data processing of psychosocial aspects were: as explained above, there are three main indicators to measure the psychosocial aspects of the elderly people, which were perceived happiness (self-acceptance, positive relations with other, autonomy, environmental mastery, purpose in life, personal growth), stress (level and symptom of stress), and family strength (physical, social and psychological strength).
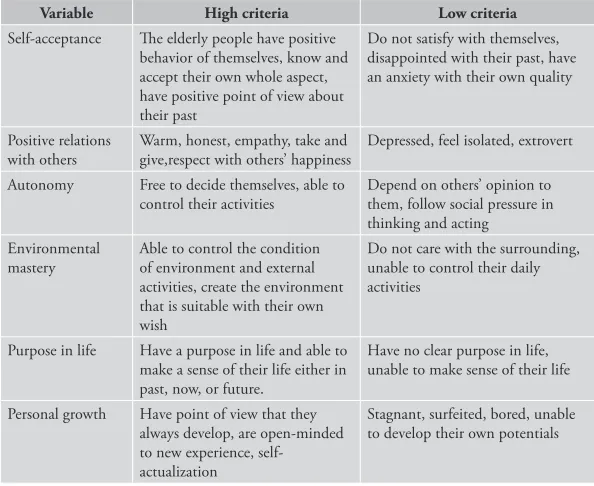
[image:54.439.64.361.309.552.2]a. Perceived happiness. Perceived happiness was measured by 6 variables, namely, self-acceptance, positive relations with others, autonomy, environmental mastery, purpose in life, personal growth. he way to answer the questionnaire was by stating yes or no to each of the statement/question in the questionnaire. If the answer is “yes”, the score is 1, and score 0 for the ”no” (Ryf in Yustina 2004).
Table 4.3 Six variables of perceived happiness
Variable High criteria Low criteria
Self-acceptance he elderly people have positive behavior of themselves, know and accept their own whole aspect, have positive point of view about their past
Do not satisfy with themselves, disappointed with their past, have an anxiety with their own quality
Positive relations with others
Warm, honest, empathy, take and give,respect with others’ happiness
Depressed, feel isolated, extrovert
Autonomy Free to decide themselves, able to control their activities
Depend on others’ opinion to them, follow social pressure in thinking and acting
Environmental mastery
Able to control the condition of environment and external activities, create the environment that is suitable with their own wish
Do not care with the surrounding, unable to control their daily activities
Purpose in life Have a purpose in life and able to make a sense of their life either in past, now, or future.
Have no clear purpose in life, unable to make sense of their life
31 4 METHOD
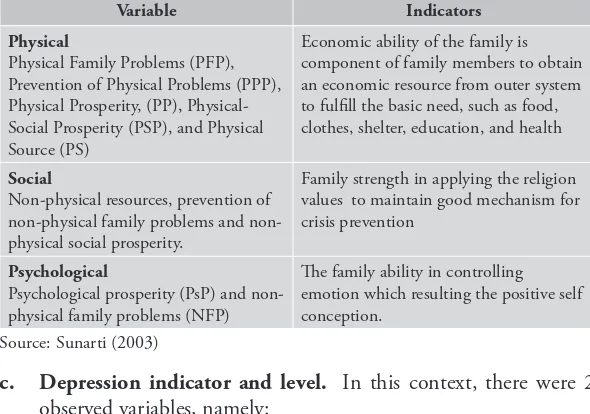
[image:55.439.78.373.266.473.2]b. Family strength. Family strength was measured by three aspects, which were physical, social, and psychological strength (Sunarti 2001). In this study, the criteria that are used were based on the criteria of “strong” family and “weak” family. Strong family was family which in various dimensions had been able to develop their family physical, social or psychological resources. Whereas, weak family was family in various dimensions was unable or did not have any chance to develop themselves as result of their physical and non-physical family in various dimensions (Law Number 52 Year 2009 regarding Population Growth and Family Development).
Table 4.4 hree aspects of family strength
Variable Indicators
Physical
Physical Family Problems (PFP), Prevention of Physical Problems (PPP), Physical Prosperity, (PP), Physical-Social Prosperity (PSP), and Physical Source (PS)
Economic ability of the family is component of family members to obtain an economic resource from outer system to fulill the basic need, such as food, clothes, shelter, education, and health
Social
Non-physical resources, prevention of physical family problems and non-physical social prosperity.
Family strength in applying the religion values to maintain good mechanism for crisis prevention
Psychological
Psychological prosperity (PsP) and non-physical family problems (NFP)
he family ability in controlling emotion which resulting the positive self conception.
Source: Sunarti (2003)
c. Depression indicator and level. In this context, there were 2 observed variables, namely:
indicators were excessive sweating, headache, stomachache, coughing, frequent urination, etc. Whereas, the psychological indicators were sensitive, hesitate to make decision, sleepless (insomnia), not conident, irritability, feeling weak and sluggish;
(b) Depression level was the severity of the stress that was experienced by elderly seen from depression indicators. he assessment of the depression level was categorized into four categories: no depression, light depression, medium depression, and severe depression (Aprilianti 2007). Each question was scored from 1 to 4. he result of the assessment was converted into scale as presented in Table 4.6 below:
Table 4.5 he scale of depression assessment
Depression level Scale
No depression Light depression Medium depression Severe depression
11 - 19 20 – 27
28– 35 35 – 44
4.6 Data Analysis
33 4 METHOD
4.7 Relevance of Research
he aging process is an unavoidable process, happening gradually and going on since the conception in the womb until the individual dies. he aging process for most people is considered as an unpleasant thing, even it is often considered as a stressing experience that needs adaptation. he physical, social, or psychological changes that are experienced during the aging process needs the readiness of individuals to face it. he changes that occur in the elderly period are physiologic, motoric ability, and socio-psychological ones. he efects from the changes determine whether the elderly males or females will adapt themselves to the changes well or not (Hurlock 1991).
When individuals enter the old age phase, the general indications which are observable are “afraid of being old”. he fear originates in the decrease of their ability. A mental decrease is related with the physical decrease so this inluences the ability of memory, intelligence, and disliking themselves.
Physical changes in elderly cause them feel unable to do many activities done when they were young. his will then cause the elderly become demotivated and pull themselves out from the social environment. he other problems that are related with this old age are loneliness, and feeling of being useless. hese problems can make the life expectancy of the elderly people reduced. he depression is experienced by approximately 12-14% of the elderly population. he changes of social environment, being isolated, loneliness, and lack of activity make the elderly feel frustrated and apathetic. Consequently, their appetite is disturbed so that this may indirectly trigger the emergence of bad nutritional status.
also the inluence of the drugs that should be taken by the elderly. hese health factors have signiicant inluence to the change in nutritional status of the elderly and this will be more observable in the age of 70s.
To face those problems above, in general, the elderly who still have family are very lucky because the family members also take care of them patiently and dedicatedly. Nevertheless, those who do not have any family member because they are unmarried, their spouse passed away, or they do not have any children, are often neglected. herefore, organizing nursing home for the elderly or Panti Werdha is very important as the place for keeping and looking after the elderly people as well as long stay rehabilitation to keep their social lives. What should be underlined is that for elderly, reaching long life is not only a matter of maintaining physical health but the more important thing is how they manage their life span.
5 GENERAL DESCRIPTION
OF NURSING HOME IN
BANDUNG
he development in science and technology and also improvement in socio-economic have impact on improved health status and life expectancy of community so that population of elderly increases. Program to improve life quality of elderly is done through, for example, community service and nursing home management. Nursing home is community social organization or institution which support government in accommodating and treat the elderly. Based on government regulation, especially Ministry of Social Afairs, a member or patient in nursing home is only weak elderly who can not manage him/her, has dependency and can be accepted or cared (Hardywinoto & Setiabudhi 1999). Elderly in nursing home has suicient physical need (food, clothes and shelter). Besides, other positive side for elderly in nursing home is that they can gather with their fellow, exchange experience and share happiness and sadness.
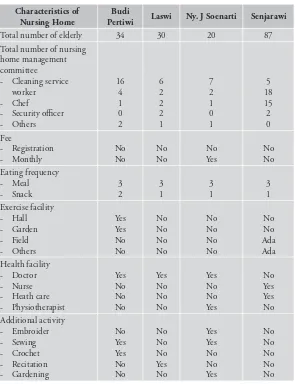
Table 5.1 showed that number of elderly who live in nursing home was 171 people. Actually, this number was considered as very small compared to total number of elderly in Bandung City. However, this showed caring for the elderly who was neglected by their family or who was permitted by their family to live in nursing home. his small number of elderly who live in nursing home was due to the capacity, seen from available room and budget.
he success in holding all activity in nursing home was supported by role of nursing home management committee. he activity in nursing home was social work so that the understanding of being social worker was necessary, especially in nursing home where the elderly live with many problems, such as loneliness, impairment in hearing and sight, physical weakness, which was natural process faced by all person if he/she do not die young. Based on the research, number of person involved as management committee was 87 people, including manager and staf. he smoothness in organizing nursing home was supported by role of the staf, which was administration staf, nurse, cleaning service worker, chef and food distributor, security oicer and others. he complete data was presented in Table 5.1.
here was no registration fee to be patient in nursing home, and also 3 of 4 nursing homes did not ask monthly operational fee from the patient, except in PSTW Ny. J Soenarti. his nursing home applied monthly fee only for patients who have good economical background. his was done with aim to be cross subsidy for other patients who was free from any fee. herefore, operational of nursing home was optimally conducted.
37 5 GENERAL DESCRIPTION OF NURSING HOME IN BANDUNG
Individually, entering old age means natural aging process which can cause physical problem (Nugroho 2008:11). Physical problem in the elderly will afect physical health so that efort is necessary to maintain health of the elderly. One of the eforts is by preventive efort, such as routine health examination and proper exercise activity for the elderly. Regarding health examination, only 3 out of 4 nursing homes provided special doctor who routinely examine health of nursing home patient and usually did not have nurse, physiotherapist and health care. Generally, training for health personnel was still lack, especially for special care of the elderly in nursing home. Nevertheless, efective basic health care for elderly is very important as the efort to improve health by preventing and managing chronic disease. Moreover, WHO stated that all health personnel, regardless the profession, have to get training on aging issues (Kemenkes RI 2012).
Table 5.1 Characteristics of the nursing home (PSTW)
Characteristics of Nursing Home
Budi
Pertiwi Laswi Ny. J Soenarti Senjarawi
Total number of elderly 34 30 20 87
Total number of nursing home management committee - Cleaning service
worker - Chef
- Security oicer - Others
16 4 1 0 2 6 2 2 2 1 7 2 1 0 1 5 18 15 2 0 Fee
- Registration - Monthly
No No No No No Yes No No Eating frequency
- Meal - Snack
3 2 3 1 3 1 3 1 Exercise facility
- Hall - Garden - Field - Others
Yes Yes No No No No No No No No No No No No Ada Ada Health facility
- Doctor - Nurse - Heath care - Physiotherapist
Yes No No No Yes No No No Yes No No Yes No Yes Yes No Additional activity
- Embroider - Sewing - Crochet - Recitation - Gardening
No Yes Yes No No No No No Yes No Yes Yes No No Yes No No No No No
39 5 GENERAL DESCRIPTION OF NURSING HOME IN BANDUNG
he size of the nursing home varied based on the capacity started from the biggest nursing home which was PSTW Senjarawi (7600 m2), PSTW Budi Pertiwi (2000 m2), PSTW Ny.J Soenarti (600 m2)
[image:63.439.83.375.217.517.2]and PSTW Laswi (400m2). he size of the nursing home gave direct impact on number of bedroom available for the elderly. he bedroom had diferent sizes and capacity started from bedroom for 1 person to bedroom for 5-8 elderly. he details were presented in Table 5.2.
Table 5.2 Characteristics of nursing home building
Characteristics of nursing home building
Budi
Pertiwi Laswi
Ny. J
Soenarti Senjarawi
Size (m2) 2000 400 600 7600
Wall Permanent Permanent Permanent Permanent
Floor Ceramics Ceramics Ceramics Ceramics
Lighting Electricity Electricity Electricity Electricity
Fuel Gas Gas Gas Gas
Number of bedroom - Single
- Double
- Multiple (>2 persons)
12 4 1 7 12 -7 5 12 6 -6 26 10 -16
Size of various rooms - Oice
- Hall - Mosque - Clinic - Isolation room - Storeroom - Library - Lobby - Kitchen - Laundry
120 381.4 20 6 24 -24 6 9 36 -8 12 -100 25 12 -4 4 60 8 6 15 600 -6 -60 32
Ventilation meet health requirement
Bathroom, latrine, and garbage disposal are obligatory requirement for every building which functioned both as place to do various activities and resident. his requirement is the same with nursing room. Based on Table 5.3, all nursing home had adequate number of bathroom and latrine. Trash can was also available in every bedroom including garbage disposal in each nursing home.
Table 5.3 Availability of bathroom, latrine, and garbage disposal
Variable Budi
Pertiwi Laswi Ny. J Soenarti Senjarawi
Number of bathroom 13 4 9 37
Number of latrine 12 4 9 37
Availability of trash can in every bedroom
Yes Yes Yes Yes
Garbage disposal Landills Landills Landills Landills
Fulillment of clean water source for daily need is the basic thing which needs to be prioritized. Assuring eligibility of water which used as primary need for consumption as well as for washing is important. As presented in Table 5.4, water source which usually used to cook, drink and bath in the nursing home was tap water, except in PSTW Laswi which use pumped ground water but fulilled the requirement for being suitable for consumption and washing.
Table 5.4 Water source of nursing home
Variable Budi
Pertiwi Laswi Ny. J Soenarti Senjarawi
Water source for drinking
Tap water Well Tap water Tap water
Water source for cooking
Tap water Well Tap water Tap water
6 SOCIO ECONOMIC
CHARACTERISTICS
Nowadays, structure of world population including Indonesia is moving towards aging which is marked by increasing number and proportion of the elderly population. National Commission for Older Persons predicted that in 2015, Indonesian population is projected to reach 248 million people. he increasing population of elderly is caused by increasing life expectancy as the impact of increased health quality. Between year 2000 and 2050, world population aged more than 60 years (elderly) will be three-fold from 600 million to 2 billion. Most of the increase happens in developing countries –which number of old people will rise from 400 million in 2000 to 1.7 billion in 2050 (Kemenkes RI 2012).
6.1 Characteristics of Elderly
In general, proportion of sex of elderly was dominated by female. Female elderly (80.9%) was far more than male elderly (19.1%) as seen in Table 6.1. his big number of female composition was conirmed by Soewono (2004), women life expectancy is higher (68 years) than men (65 years). Similar thing was also found based on data from BPS (2010), proportion of women that was 8.96% (10.4 million people) was higher than men that was 7.76% (8.8 million people).
Table 6.1 showed percentage of population according to marital status. Most (78.0%) of the elderly in nursing home was widower. More than half (55.5%) of the elderly was widower, while not married elderly was 4.1%. On the other hand, the married elderly in community was 50% or 40.4% of all respondents.
Table 6.1 Distribution of sociodemographic characteristics of the elderly
Sociodemographic characteristics
Nursing home Non
nursing home Total
n % n % n %
Sex - Male - Female
15 67 18.3 81.7 65 271 19.3 80.7 80 338 19.1 80.9 Religion
- Islam
- Christian/Catolic
43 39 52.4 47.6 329 6 97.9 1.8 372 45 89.0 10.8 Marital status
- Married - Widower - Not married
1 64 17 1.2 78.0 20.7 168 168 0 50.0 50.0 0.0 169 232 17 40.4 55.5 4.1 Age category (years)
- 55-59 - 60-64 - >65
7 9 66 8.5 11.0 80.5 91 87 158 27.1 25.9 47.0 98 96 224 23.4 23.0 53.6
43 6 SOCIO ECONOMIC CHARACTERISTICS
he age biologically points out period of life from birth. Elderly is a natural process which cannot be avoided similar with human age that is limited by nature regulation (Nugroho 2008). Based on the result on age distribution of sample, more than half (53.6%) aged >65 years with mean age of 67.0 years. here were 23.0% of them aged 60-64 years and 23.4% aged 55-59 years (Table 6.1). his condition showed that global health improvement will also create special challenge in 21st millennium in both developed and developing countries. Based
on