VOICE ACTIVATED SWITCH
NAZARUDDIN BIN MD SHAH
This Report Is Submitted In Partial Fulfillment of Requirements for the Bachelor Degree of Electronic Engineering (Industrial Electronic) with honours.
Fakulti Kejuruteraan Elektronik dan Kejuruteraan Komputer Universiti Teknikal Malaysia Melaka
UNIVERSTI TEKNIKAL MALAYSIA MELAKA
FAKULTI KEJURUTERAAN ELEKTRONIK DAN KEJURUTERAAN KOMPUTER BORANG PENGESAHAN STATUS LAPORAN
PROJEK SARJANA MUDA II
Tajuk Projek Sesi
Pengajian
Voice Activated Switch 2003-2007
Saya NAZARUDDIN BIN MD SHAH
mengaku membenarkan Laporan Projek Sarjana Muda ini disimpan di Perpustakaan dengan syarat-syarat kegunaan seperti berikut:
l . Laporan adalah hakmilik Universiti Teknikal Malaysia Melaka.
2. Perpustakaan dibenarkan membuat salinan untuk tujuan pengajian sahaja.
3. Perpustakaan dibenarkan membuat salinan laporan ini sebagai bahan pertukaran antara institusi pengajian tinggi.
4. Sila tandakan (
v ) :
D
SULIT*D
TERHAD*El
TIDAK TERHAD(Mengandungi maklumat yang berdarjah keselamatan atau kepentingan Malaysia seperti yang termaktub di dalam AKT A RAHSIA RASMI 1972)
(Mengandungi maklumat terhad yang telah ditentukan oleh organisasilbadan di mana penyelidikan dijalankan)
Disahkan oleh: / ' "
HtセenulisI@
(COP DAN TAN T ANGAN PENYELIA)Alamat Tetap: 24-F,T AMAN PERKOT A, 75350 BATU HAMP AR, MELAKA.
Tarikh: ..
M5./0.1 ... .
FAUZIYAH liT SALEHUJOIN
f'ensyarilh
F•kulti Kej Elekt,.nik ian kセ [@Kom,uter (FKEKK). Universiti Teknika: m。 ャ 。ケウセ@ Melaka (UTeM),
Kanmt セAxオョ」 ゥ@ 1 セ@
Ayer Kereh, 75450 m・ャセ。@
iii
"Saya akui laporan ini adalah basil kerja saya sendiri kecuali ringkasan dan petikan yang tiap-tiap satunya telah sayajelaskan sumbemya."
Tandatangan
Z セ@
.. ... ... . . .... .. .... ... . NamaPenulis:Nセヲセャ_NpNヲNセ@
..
セ_@
...
セセᄋᄋᄋᄋᄋᄋᄋ
ᄋ@
iv
"Saya/kami akui bahawa saya telah membaca karya ini pada pandangan saya/kami karya ini adalah memadai dari skop dan kualiti untuk tujuan penganugerahan ljazah Sarjana
Muda Kejuruteraan Elektronik (Elektronik lndustri) dengan kepujian."
Tandatangan. : · · ·
j
aャゥセ@
ii
iii··
-;;.·;_-.:r-;.;;;;N
Nama Penyeha : ... .. ... . ...
1. ... .
_,
セセセ@.._,
Bセy@I dedicated this to both of my parents, my family,
friends and electronic engineering education. Thanks for everything. Your deed
will
be remembered till my last breath.
Vl
PENGHARGAAN
vii
ABSTRACT
Vlll
ABSTRAK
TABLE OF CONTENTS
CHAPTER SUBJECT
TITLE APPROVAL PENGHARGAAN ABSTRACT ABSTRAK
TABLE OF CONTENTS TABLE LIST
FIGURE LIST APPENDICES LIST
I INTRODUCTION
1.1 PROJECT SYNOPSIS
1.2 PROBLEM STATEMENTS
1.3 OBJECTIVES
1.4 SCOPES OF PROJECT
1.5 CHAPTER SUMMARY
II
LITERA TURF; REVIEW2.1 INTRODUCTION
X
2.2 FUNDAMENTAL OF THE MEL FREQUENCY
CEPSTRAL COEFFICIENTS ANALYSIS 5 2.2.1 COMPARISON BETWEEN CEPTRAL 9
ANALYSIS AND LINEAR PREDICTION ANALYSIS
2.2.1.1 CEPSTRAL ANALYSIS 9 2.2.1 .2 LINEAR PREDICTION ANALYSIS 11
(LPA)
2.2.2 RESULTS 12
2.3 MATLAB'S DATA ACQUISITION 13
2.4 PARALLEL PORT 14
2.5 SOUND CARD 16
2.6 MICROPHONE 17
2 .7 RADIO FREQUENCY 17
2.7.1 RADIO FREQUENCY TRANSMITTER 17 MODULE
2.7.2 RADIO FREQUENCY RECEIVER MODULE 18
2.8 TRANSISTOR 19
2.9 RELAY 20
III
PROJECT METHODOLOGY
223.1 INTRODUCTION 22
3.2 PART I 23
3.3 PART II 25
3.3.1 FUNCTION OF 'melcepst' 27
3.4 PART III 33
IV
v
VI
RESULT AND DISCUSSION
37
4.1
INTRODUCTION
37
4.2
RESULTS
38
4.3
DISCUSSION OF THE SOFTWARE
42
4.4
DISCUSSION 0 THE WIRELESS TECHNOLOGY
43
CONCLUSION AND SUGGESTIONS
5.1
CONCLUSION
5.2
SUGGESTIONS
REFERENCE
44
44
44
46
Xll
TABLE LIST
NO SUBJECT PAGE
1 PARALLEL PORT CHARACTERISTIC 14
2 COLOUR AND FUNCTION ON SOUND CARD 16
3 THE DESCRIPTION OF THE FUNCTION 27
4 PIN DIRECTIONS AND ASSOCIATED VALUE 34
FOR 5 OUTPUTS
Xlll
FIGURE LIST
NO SUBJECT PAGE
2.1 LARYNGOSCOPIC 5
2.2 GRAPH OF MAGNITUDE VS NUMBER OF
CEPSTRAL COEFFICIENTS 7
2.3 TIME WAVEFORM AND SPECTROGRAMS.
9
2.4 TIME WAVEFORM AND SPECTROGRAMS. 10
2.5 LPA
11
2.6 PICTURE OF FEMALE PARALLEL PORT
LOCATED ON THE PC. 15
2.7 25 PIN FEMALE PORT CONNECTOR
WITH PIN ASSIGNMENTS 15
2.8 TYPICAL SOUND CARD 16
3.1 BASIC FUNDAMENTAL FIGURE
OF THE SYSTEM 22
3.21 FLOWCHART OF CEPSTRAL ANALYSIS OF PART II 25
3.22 FLOWCHART OF PART II 26
3.3 THE RF TRANSMITTER MODULE CIRCUIT 34
3.4 THE TRANSMITTER MODULE 35
3.5 THE RECEIVER OF THE VOICE ACTIVATED
4.1 THE 22 X 12 COEFFICIENT FINGERPRINT OF WORD 'LAMP'
4.2 THE 22 X 12 COEFFICIENTS OF THE
DIFFERENT WORD 'OFF'
39
39 4.3 THE 22 X 12 COEFFICIENTS OF THE TEST SUBJECT 40
4.4 THE SUM OF 12 COEFFICIENTS THAT HAS THE
SAME WORD 'LAMP'
4.5 THE 12 COEFFICIENT OF THE DIFFERENT
WORD 'OFF' .
40
41
NO
A
B
APPENDICES LIST
SUBJECT
The Successful Trial Of The Recognition The aid from HELP MATLAB
PAGE
48 50
CHAPTER I
INTRODUCTION
1.1 PROJECT SYNOPSIS
The fmal year students of KUTKM need to produce a project as one of their goal before graduating. This project will show the talent and skills of the student which can be made as a serious strength during their future as an engineer.
The Voice Activated Switch System runs on MA TLAB platform which uses voice to activate switch. By other mean, this system allows user to turn ' on' or ' off switch by using their voice. Voice will be the input into the system and system will do the recognition and create an output based on the data stored. Generally the system will analyze the cepstral analysis of the voice and compare it to the data stored in the MA TLAB folder.
1.2 PROBLEM STATEMENTS
2
Second statement goes to the student themselves regarding the lack of knowledge on one of the most fines software that indicates the solving of engineering problems. System will act as human ears which can recognize each command given by the user and act as to be less susceptible to mention variation of the voice commands. Not all students who learn MA TLAB knew about this. The developing of this system can solve and overcome those problems.
1.3 OBJECTIVES
The primary purpose of this project is to create a voice recognition controls system that reliably and consistently recognizes several different commands and executes a multitude of different functions based on varied command sequences. The original concept intends for a person to use this product at a home computer.
The objectives ofthis project are:
i. To develop software for voice activated switch system by using MATLAB.
ii. To gain knowledge of the student about MA TLAB software and its abilities.
iii. To perform standard speech signal analysis by using the signal processing toolbox in MA TLAB.
1.4 SCOPES OF PROJECT
3
1.5 CHAPTER SUMMARY
CHAPTER I will describe the definition of this project will be explained in this chapter. Also in this chapter there will be summary the project progress.
CHAPTER II will discuss about research and information which are related to this project. Every fact and information are gained from different references will be discussed so that the best technique and method can be implemented on this project.
CHAPTER III will be describing how this project is separated to small partition. The elements which are used to build each circuit are described by concept and theory. Plus, figures are provided to ensure the understanding.
CHAPTER IV is describing about the project result and outcome discovery. The project outcome discovery will be presented from the many data analysis results.
CHAPTER II
LITERATURE REVIEW
2.1 INTRODUCTION
2.2 FUNDAMENTAL OF THE MEL FREQUENCY CEPSTRAL COEFFICIENTS ANALYSIS
5
Before going any further on MATLAB's cepstral analysis, the Mel Frequency Cepstral Coefficients (MFCCs) concept is studied. The independent variable of a cepstral graph is called the quefrency. The quefrency is a measure of time, though not in the sense of a signal in the time domain. For Command , if the sampling rate of an audio signal is 441 00 Hz and there is a large peak in the cepstrum whose quefrency is I 00 samples, the peak indicates the presence of a pitch that is 441001100
[image:20.598.61.472.96.613.2]=
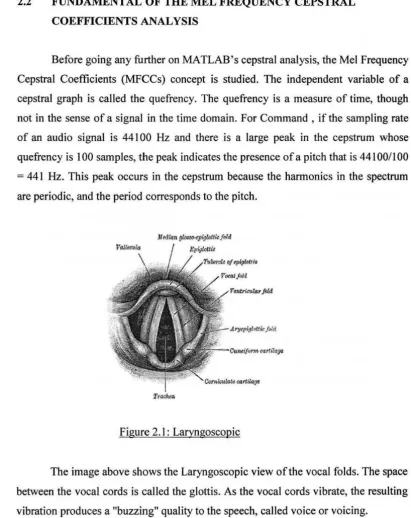
441 Hz. This peak occurs in the cepstrum because the harmonics in the spectrum are periodic, and the period corresponds to the pitch.Figure 2.1 : Laryngoscopic
The image above shows the Laryngoscopic view of the vocal folds. The space between the vocal cords is called the glottis. As the vocal cords vibrate, the resulting vibration produces a "buzzing" quality to the speech, called voice or voicing.
Sounds production il}volving glottis is called glottal. English has a voiceless
glottal fricative spelled "h". In many accents of English the glottal stop (made by pressing the folds together) is used as a variant allophone of the phoneme It/ (and in
6
some dialects, occasionally of /k/ and /pi); in some languages, this sound is a phoneme of its own.
Human speech is created through two main components. Air is built up below the vocal bands, causing the vocal bands to be pushed apart. The glottis, the opening where the vocal bands meet, is then forced closed due to the changing of pressure, which results in the building up of air pressure again, and subsequently another pulse of air is released across the vocal bands. This cycle creates voicing. This acoustic signal is then shaped by the different parts of the mouth to create the vocal sound known as speech. These oral components act as a filter to vary the emitted signal. Cepstral analysis is able to pick up vowel sounds because the glottis has only minimal constriction for these sounds, unlike consonant sounds that generally are produced with a highly constricted glottis and cannot sustain voicing as well. A speech signal can be represented by functions of these two signal components, where S ( m) represents the overall speech signal, H ( w) represents the filtering vocal component, and E(w) represents the glottal excitation.
IS(m)I=JH(w)IIE(w)l (1.1)
The vocal shaping impressed upon the glottal signal varies much less rapidly than the excitation signal being pushed through the glottis. By taking the log of the signal, it is possible to separate it into the vocal shaping component and the glottal component.
log(l S(m)
I)=
log(l H(m)D
+
log(l E(m)D
(1.2)7
Jr
c(n) = (1 12n) Jlog(S(w) l)le'wndw (1.3)
-;r
The cepstrum of the voice signal consists of the slower varying vocal signal at the beginning followed by glottal pulses at higher frequencies. The cepstral coefficients defining the vocal shaping can be extracted by taking the beginning discrete values of the cepstrum.
The coefficients taken from the cepstrum are the foundation of detecting desired words. By comparing the cepstral coefficients of a test sample to the cepstral coefficients of a template of the characteristic coefficients of the desired word, it is possible to determine how closely the vocal shaping of the sample is to that of the test. By taking the sum of the differences between the template coefficient and the corresponding sample coefficient, it can be determine quantitatively how closely the words resemble each other. The Euclidean Distance (ED) is the formula used to calculate this value for n different coefficient values, where c, is the i-th sample
cepstral coefficient and t, is the i-th template coefficient.
n
ED = セI」L@
-tY
(1.4)i=l
8
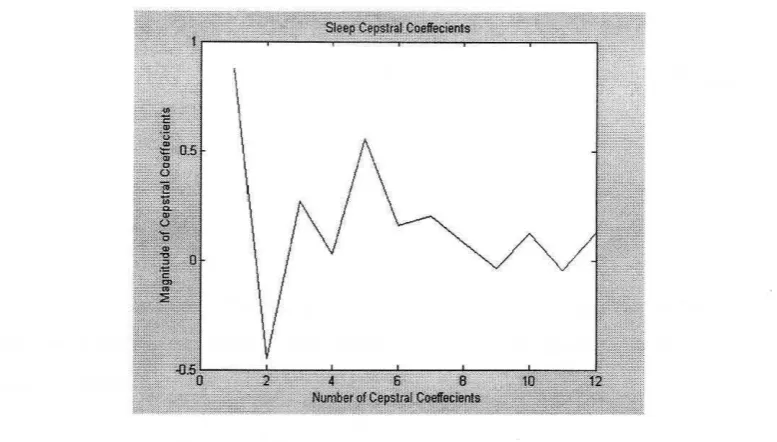
Figure 2.2: Graph of Magnitude vs Number ofCepstral Coefficients.
During the analysis, the routine melcepst.m implements a mel-cepstrum front end for a recognizer. Mel Frequency Cepstral Coefficients (MFCCs) are coefficients that represent audio which derived from a type of cepstral representation of the audio clip which can be simplified as spectrum-of-a-spectrum. The difference between the cepstrum and the Mel-frequency cepstrum is that in the MFC, the frequency bands are positioned logarithmically as in mel scale which approximates the human auditory system's response more closely than the linearly-spaced frequency bands obtained directly from the Discrete Fourier transform (FFT). This can allow for better processing of data,. for example, in audio compression such as speech recognition. Although the MFCCs lack an outer ear model and, hence, cannot represent perceived loudness accurately, it still suit perfectly to the voice activated switch system regarding the normal usage of speech recognition .
MFCCs are commonly derived as follows: Take the Fourier transform of a signal
Map the log amplitudes of the spectrum obtained above onto the Mel scale, using hamming window in time domain
Take the Discrete Transform of the list of Mel log-amplitudes, as if it were a signal
2.2.1 COMPARISON BETWEEN CEPTRAL ANALYSIS AND LINEAR PREDICTION ANALYSIS.
9
Athough that there are ranging kinds of analysis for speech recognition system, any analysis consist of cepstral analysis such MFCCs is the best method for the recognition system. A demonstration that cepstral analysis overrules another method which is Linear Prediction analysis (LPA) is done, reveals that in the voiced section of the spoken word, a more periodic waveform is produced with the use of cepstral analysis.
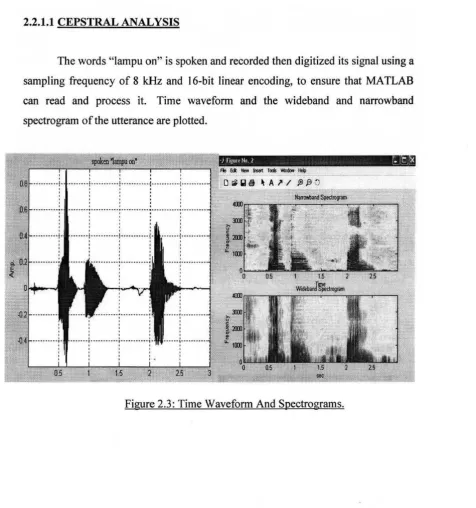
2.2.1.1 CEPSTRAL ANALYSIS
The words "lampu on" is spoken and recorded then digitized its signal using a sampling frequency of 8 kHz and 16-bit linear encoding, to ensure that MA TLAB can read and process it. Time waveform and the wideband and narrowband spectrogram of the utterance are plotted .
...•...•...
I I I I
' ' '
' ' '
' ' '
' ' '
' '
···!···i···
' '
[image:24.598.55.532.290.798.2]'