I O P C – J o g y a k a r t a , 1 – 3 J u n i 2 0 1 0 | 1
Allelic Diversity of 22 Sampoerna Agro’s Oil Palm Pisifera Based
on Microsatellite Markers
1)Lollie Agustina P. Putri 2), Ronan Rivallan 3),Zulhermana 4), Yulia Puspitaningrum 4), Sudarsono 5), Xavier Perrier 2), Dwi Asmono 4), and
Norbert Billotte 3)
ABSTRACT
Knowledge on genetic distances and relationships among breeding materials are important in plant breeding and have significant impact on crop improvement. Sampoerna Agro (SA) has established oil palm germplasm collections consisted of 22 pisifera populations originated from various regions. Microsatellites markers are highly reliable; inherited in co-dominant fashion; therefore, they are able to distinguish heterozygous to homozygous individual; easy to score and rapidly produced using PCR. In this experiment, allelic diversity among SA’s pisifera collection (85 palms from the total populations) were investigated using SSR marker (20 SSR loci). Results of the investigations indicated the presence of at least 163 alleles in the SA’s pisifera collection evaluated. Mean number of alleles per locus was 8.2 while mean of polymorphic
information content (PIC) of the SSR marker analyzed was 67 %. Observed mean
of heterozygosity was 0.4 while expected mean of heterozygosity was 0,7. Results of genetic dissimilarity coefficient calculation and dendogram construction using DARwin 5.05 indicated that the SA’s pisifera populations were clustered into four groups. Some accessions of Yangambi origin formed group I; some other Yangambi and Ekona origin clustered into group II; Ghana, LaMé, Dami, and the rest of Nigeria origin clustered into group III, and a number of Avros origin were in Group IV, respectively. Implication of the observed allelic diversity to the SA’s oil palm breeding program will be discussed in detail.
1)
Paper Presented at International Oil Palm Conference (IOPC) 2010, Jogyakarta, 1-3 Juni 2010
2)
North Sumatera University (USU), Department of Agroecotechnology, Jl. Prof. A. Sofyan no.3, Campus USU Padang Bulan, Medan, Indonesia (email: [email protected])
3)
Cirad, UMR DAP 1098, TA 96/A-03 Avenue Agropolis, 34398 Montpellier, Cedex 5, France
4)
PT Sampoerna Agro Tbk, Jl.Basuki Rahmat 788 Palembang, Indonesia
5)
I O P C – J o g y a k a r t a , 1 – 3 J u n i 2 0 1 0 | 2 INTRODUCTION
Oil palm (Elaeis guineensis Jacq.) is currently one of the strategic plantation commodities in Indonesia. Therefore, activities to improve oil palm characters are needed to develop better planting materials. Such objectives may be achieved through oil palm breeding program. Effective oil palm breeding activities depend on the availability of oil palm germplasm collections and their genetic variability.
A number of microsatellite markers evaluations have been done for oil palm germplasm collections of Sampoerna Agro. The objectives of those studies were genetic diversity analysis and genetic uniformity evaluation for oil palm clonal materials (ramets). The main objectives of this study were to utilize microsatellite markers for analyzing Sampoerna Agro’s (Sumatra, Indonesia) 22 pisifera populations originated from various regions and to characterize their genetic diversity. The generated data will be used to draw preliminary conclusion on this germplasm for breeding purposes.
MATERIALS AND METHODS
Plant material and DNA extraction.
The evaluated oil palm populations consisted of 22 combinations of tenera by pisifera crosses (TxP families) of PT Sampoerna Agro Tbk (SA) in Indonesia. Each TxP family was represented by 3-4 pisifera descents. Total genomic DNA was extracted from fresh leaf samples of each individual palm using a conventional CTAB method. The genomic DNA concentration was estimated with a fluorimeter (Fluoroskan Ascent®, Thermo Fisher Scientific®, USA) and the DNA quality was checked using agarose minigel electrophoresis.
E. guineensis microsatellite primers pairs and genotyping.
Twenty independent microsatellite loci (Table 1) were chosen from the oil palm reference map published by Billotte et al. (2005), based on the following: (i) high polymorphism within the E. guineensis species and (ii) good pan-genomic coverage (generally one locus per homologous chromosomes pair). SSRs were genotyped as described by Roy et al. (1996) using an automated infrared fluorescence technology of a Li-Cor IR2 sequencer (Lincoln, Neb.). PCR amplification of genomic DNAs using the SSR primers and separation of the amplification products by electrophoresis were carried out as described by Billotte
et al. (2005). The amplified SSR allelic patterns were analysed with the SAGAGT®
I O P C – J o g y a k a r t a , 1 – 3 J u n i 2 0 1 0 | 3 Data analysis.
The genetic diversity was estimated under PowerMarker v3.0 (Liu and Muse, 2005) by determining allelic diversity (total number of alleles, allele frequency per group), observed and expected heterozygosities (Ho and He) (Nei, 1987), and
polymorphism information content (PIC) according to Botstein et al. (1980). Two types of descriptive analysis on genetic diversity were performed under DARwin5 (Perrier and Jacquemoud-Collet, 2009), such as: (i) a Principal Coordinates Analysis (PCoA), the factor analysis type to investigate the main origin groups and (ii) a Neighbour-Joining tree according to Saitou and Nei (1987) to gain a clearer picture of relations among individuals. The Neighbour-Joining analysis was un-weighted and un-rooted. These descriptive analyses were carried out based on a pair-wise dissimilarity matrix calculated by Simple Matching in accordance with the formula:
by which dij is the dissimilarity between i and j, L the number of loci, πthe ploidy
and ml the number of common alleles between i and j for locus l.
RESULTS AND DISCUSSIONS
Allelic variability
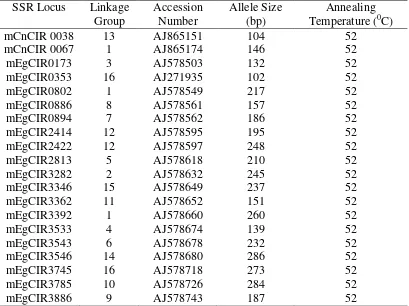
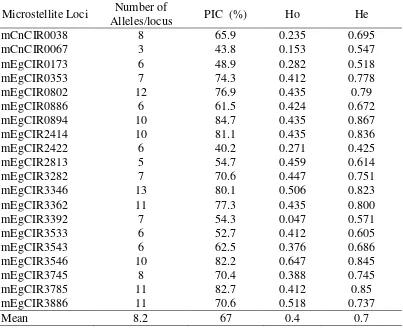
Results of the analysis revealed the presence of a total of 163 SSR alleles among the 85 pisifera accessions tested (Table 1). The number of alleles per locus varied widely from 3 in mCnCIR 0067 locus to 13 in mEgCIR 3346 locus. The mean of alleles per locus was 8.2. Eight loci (mEgCIR0802, mEgCIR0894, mEgCIR2414, mEgCIR3346, mEgCIR3362, mEgCIR3546, mEgCIR3785, and mEgCIR3886) gave very good results, with number of polymorphic alleles ranged from 10-13.
I O P C – J o g y a k a r t a , 1 – 3 J u n i 2 0 1 0 | 4 This slightly lower numbers of alleles, with a higher major allele frequency and a lower Ho mean value (0.4) of the SA pisifera accessions, were in
accordance to the effects of past hybridization and selections previously conducted. The past hybridization and selections tended to decrease the average number of alleles per locus and the proportion of heterozygous loci. Expected heterozygosities (He) in the SA’s pisifera samples indicated a high average
polymorphism rate (0.7) for the loci. The polymorphism information content (PIC) values of the loci were generally high with average of 67 % for SA pisifera populations evaluated, indicating that SA pisifera germplasm is still characterised by a high degree of genetic diversity.
Genetic relationship among pisifera accessions
Analysis using factorial methods was conducted since the purpose of analysis was mainly to give an overall representation of diversity and not the individual effects. The Principal Coordinates Analysis (PCoA) identified several independent axes or eigenvectors that are linear combinations of the characters studied (SSRs in this case), which account for the largest part of the variation (SSR length polymorphism). The PCoA was performed on the 163 alleles, revealed by the 20 SSR loci over the 85 SA pisifera accessions. Distinct groups were discriminated, with axes 1 and 2 explaining 37.9% of the total molecular variation (Figure 1). One group was formed by Yangambi accessions. A second group was made of Avros along with one Nigeria accession (PN-17_3). A third group on the axes 1 and 3 was formed by Ekona along with Nigeria accession (PN-12_1) and Yangambi accession (PY-24_2). A fourth group was formed by Dami, La Mé, Ghana and Nigeria accessions. The two axes of our PCoA identified a genetic structure of distinct groups of accessions, consistent with the four main origins. Three individuals (PN-17_3, PN-12_1, and PY-24_2) were separated from their main group. These materials may have been mislabelled materials. Such materials should be discarded and should not be used as pollen sources and in breeding program.
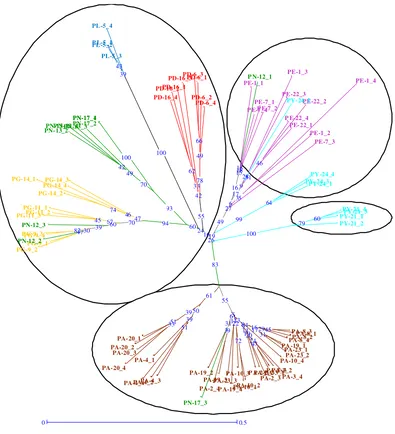
As described by Perrier and Jacquemoud-Collet (2006), tree method was another approach for presenting diversity structure. This method indicated individual relationship that might be less accurate than factorial analyses on the overall structure. Our results of unrooted Neighbour-Joining tree gave a quite nice picture about the relations among SA pisifera accessions (Figure 2). Four major clusters were formed: Yangambi, Avros, Ekona and a fourth broader cluster made of Dami, La Mé, Ghana and Nigeria accessions. A selection of African breeding materials formed broader grouping. These results also indicated that Avros material had the least intra-population variability.
I O P C – J o g y a k a r t a , 1 – 3 J u n i 2 0 1 0 | 5 CONCLUSIONS
We have demonstrated that SSR polymorphism provides a valuable tool for the analysis of pisifera oil palms germplasm. The patterns of variation detected confirm previously reported theories on the genetic diversity of oil palm. In addition, these results have significant implications for pisifera conservation purposes, since they could be used to identify a core genepool for ex situ pisifera conservation and for future SA’s oil palm breeding programs.
Based on generated SSR markers, mean number of allele per locus, expected heterozygosities and PIC value, the selected pisifera originated from Nigeria, Ekona and Yangambi had high level of allelic diversity. The geographic and genetic structures of the pisifera oil palm diversity suggested the possibility of new breeding approaches. Within the frame of an inter-population hybridization program using Nigeria, Ekona and Yangambi origins of pisifera, more favorable heterosis effects on the palm oil production might be obtained.
ACKNOWLEGDEMENTS
We gratefully acknowledge PT Sampoerna Agro Tbk estate (Palembang, Sumatra, Indonesia) and the Plant Molecular Biology Lab of Bogor Agricultural University (Bogor, Indonesia) for their full support on this study. We would like to give special thanks to the Centre de Coopération Internationale en Recherche Agronomique pour le Développement (CIRAD), France. We also would like to thank the Directorate of Higher Education, Ministry of National Education, Republic of Indonesia for their financial support on this study through Sandwich Program.
REFERENCES
BILLOTTE N, RISTERUCCI AM, BARCELOS E, NOYER JL, AMBLARD P and BAURENS FC (2001). Development, characterisation, and across-taxa utility of oil palm (Elaeis guineensis Jacq.) microsatellite markers. Genome 44 : 413-425.
BILLOTTE N, MARSEILLAC N, RISTERUCCI AM, ADON B, BROTTIER P, BAURENS FC, SINGH R, HERRAN A, ASMADI H, BILLOTT C, AMBLARD P, DURAND-GASSELIN T, COURTOIS B, ASMONO D, CHEAH SC, ROHDE W, RITTER E and CHARRIER A (2005). Microsatellite-based high density linkage map in oil palm (Elaeis guineensis Jacq.). Theor. Appl. Genet. 110: 754-765.
BOTSTEIN O, WHITE RL, SKOLNICK M, DAVIS RV (1980). Construction of a genetic linkage map in man using restriction fragment length polymorphism.
I O P C – J o g y a k a r t a , 1 – 3 J u n i 2 0 1 0 | 6 LIU K and MUSE SV (2005). PowerMaker: An integrated analysis environment for genetic maker analysis. Bioinformatics. 21: 2128–2129.
NEI M (1973). Analysis of gene diversity in subdivided populations. Proc. Natl.
Acad. Sci. U.S.A 70: 3321- 3323.
PERRIER X, JACQUEMOUD-COLLET JP, (2006). DARwin software.
http://darwin.cirad.fr/darwin
ROY R, STEFFENS DL, GARTSIDE B, JANG GY, BRUMBAUGH JA (1996). Producing STR locus patterns from bloodstains and other forensic samples using an infrared fluorescent automated DANN sequencer. J. Forensic Sci. 41:418–424
SAITOU N and NEI M (1987). The neighbor-joining method: a new method for reconstructing phylogenetic trees. Mol. Biol. Evol. 4: 406–425.
Table 1. Synopsis of 20 Microsatellite Loci Used in the SSR Analysis of Sampoerna Agro’s Pisifera Oil Palm Genetic Diversity.
SSR Locus Linkage Group
Accession Number
Allele Size (bp)
Annealing Temperature (0C)
mCnCIR 0038 13 AJ865151 104 52
mCnCIR 0067 1 AJ865174 146 52
mEgCIR0173 3 AJ578503 132 52
mEgCIR0353 16 AJ271935 102 52
mEgCIR0802 1 AJ578549 217 52
mEgCIR0886 8 AJ578561 157 52
mEgCIR0894 7 AJ578562 186 52
mEgCIR2414 12 AJ578595 195 52
mEgCIR2422 12 AJ578597 248 52
mEgCIR2813 5 AJ578618 210 52
mEgCIR3282 2 AJ578632 245 52
mEgCIR3346 15 AJ578649 237 52
mEgCIR3362 11 AJ578652 151 52
mEgCIR3392 1 AJ578660 260 52
mEgCIR3533 4 AJ578674 139 52
mEgCIR3543 6 AJ578678 232 52
mEgCIR3546 14 AJ578680 286 52
mEgCIR3745 16 AJ578718 273 52
mEgCIR3785 10 AJ578726 284 52
I O P C – J o g y a k a r t a , 1 – 3 J u n i 2 0 1 0 | 7 Table 2. Mean number of Alleles Per Locus, Polymorphic Information Content
(PIC), Observed (Ho) and Expected (He) Heterozygosities of 20 Microsatellite loci.
Microstellite Loci Number of
Alleles/locus PIC (%) Ho He
mCnCIR0038 8 65.9 0.235 0.695
mCnCIR0067 3 43.8 0.153 0.547
mEgCIR0173 6 48.9 0.282 0.518
mEgCIR0353 7 74.3 0.412 0.778
mEgCIR0802 12 76.9 0.435 0.79
mEgCIR0886 6 61.5 0.424 0.672
mEgCIR0894 10 84.7 0.435 0.867
mEgCIR2414 10 81.1 0.435 0.836
mEgCIR2422 6 40.2 0.271 0.425
mEgCIR2813 5 54.7 0.459 0.614
mEgCIR3282 7 70.6 0.447 0.751
mEgCIR3346 13 80.1 0.506 0.823
mEgCIR3362 11 77.3 0.435 0.800
mEgCIR3392 7 54.3 0.047 0.571
mEgCIR3533 6 52.7 0.412 0.605
mEgCIR3543 6 62.5 0.376 0.686
mEgCIR3546 10 82.2 0.647 0.845
mEgCIR3745 8 70.4 0.388 0.745
mEgCIR3785 11 82.7 0.412 0.85
mEgCIR3886 11 70.6 0.518 0.737
Mean 8.2 67 0.4 0.7
Tabel 3. Mean Number of Alleles Per Locus, Polymorphic Information Content (PIC), Observed (Ho) and Expected (He) Heterozygosities of 7 Sampoerna Agro’s pisifera Oil Palm Based on Their Origin
Origin
Number of population
Mean number of alleles per
locus
PIC (%) Ho He
Avros 8 3.05 34.8 0.279 0.401
Nigeria 3 4.50 58.7 0.482 0.663
Ekona 3 3.85 56.2 0.604 0.645
Ghana 3 2.85 39.6 0.373 0.471
Yangambi 2 3.50 48.0 0.356 0.567
Dami 2 3.00 42.3 0.463 0.520
I O P C – J o g y a k a r t a , 1 – 3 J u n i 2 0 1 0 | 8 Figure 1. Clustering of 85 individues of Sampoerna Agro’s pisifera oil palm
germplasm collections using Neighbor-Joining trees based on Simple
Matching Dissimilarity Matrix analysis
I O P C – J o g y a k a r t a , 1 – 3 J u n i 2 0 1 0 | 9 Figure 2. Multivariate factorial analysis on axis 1 and axis 2 of 85 individues of