AN APPLICATION OF GENETIC ALGORITHM FOR
CLUSTERING OBSERVATIONS WITH
INCOMPLETE DATA
FRISCA RIZKI ANANDA
DEPARTMENT OF STATISTICS
FACULTY OF MATHEMATICS AND NATURAL SCIENCES BOGOR AGRICULTURAL UNIVERSITY
PERNYATAAN MENGENAI SKRIPSI DAN
SUMBER INFORMASI SERTA PELIMPAHAN HAK CIPTA*
Dengan ini saya menyatakan bahwa skripsi berjudul An Application of Genetic Algorithm for Clustering Observations with Incomplete Data adalah benar karya saya dengan arahan dari komisi pembimbing dan belum diajukan dalam bentuk apa pun kepada perguruan tinggi mana pun. Sumber informasi yang berasal atau dikutip dari karya yang diterbitkan maupun tidak diterbitkan dari penulis lain telah disebutkan dalam teks dan dicantumkan dalam Daftar Pustaka di bagian akhir skripsi ini.
Dengan ini saya melimpahkan hak cipta dari karya tulis saya kepada Institut Pertanian Bogor.
Bogor, Juni 2014
Frisca Rizki Ananda
ABSTRACT
FRISCA RIZKI ANANDA. An Application of Genetic Algorithm for Clustering Observations with Incomplete Data. Advised by ASEP SAEFUDDIN and BAGUS SARTONO.
Cluster analysis is a method to classify observations into several clusters. A common strategy for clustering the observations uses distance as a similarity index. However distance approach cannot be applied when data is not complete. Genetic Algorithm is applied by involving variance (GACV) in order to solve this problem. This study employed GACV on Iris data that was introduced by Sir Ronald Fisher. Clustering the incomplete data was implemented on data which was produced by deleting some values of Iris data. The algorithm was developed under R 3.0.2 software and got satisfying result for clustering complete data with 95.99% sensitivity and 98% consistency. GACV could be applied to cluster observations with missing value without any pre-processing step to incomplete observations. Performance on clustering observations with incomplete data is also satisfying but tends to decrease as the proportion of incomplete values increases. The proportion of incomplete values should be less than or equal to 40% to get sensitivity and consistency not less than 90%.
Scientific Paper
to complete the requirement for graduation of Bachelor Degree in Statistics
at
Department of Statistics
AN APPLICATION OF GENETIC ALGORITHM FOR
CLUSTERING OBSERVATIONS WITH
INCOMPLETE DATA
DEPARTMENT OF STATISTICS
FACULTY OF MATHEMATICS AND NATURAL SCIENCES BOGOR AGRICULTURAL UNIVERSITY
Title : An Application of Genetic Algorithm for Clustering Observations with Incomplete Data
Name : Frisca Rizki Ananda
NIM : G14100102
Approved by
Prof Dr Ir Asep Saefuddin, MSc Advisor I
Dr Bagus Sartono, MSi Advisor II
Acknowledged by
Dr Anang Kurnia, MSi Head of Departemen
ACKNOWLEDGEMENTS
Alhamdulillah, many thanks to Allah subhanahu wa ta’ala for the strength, willingness and opportunity that I can finish my research with the title An Application of Genetic Algorithm for Clustering Observations with Incomplete Data.
I realize the completion of this research will not happen without the big support from many people. I would like to express my sincere gratitude to my advisors, Prof Dr Ir Asep Saefuddin, MSc for his advices and Dr Bagus Sartono, MSi for his helpful guidance. I also thank Septian Rahardiantoro, SStat for his suggestions while discussing this study.
Thank you for all my friends who have continuously supported me during this research completion that I cannot mention one by one. Thank you for both of my parents who always give support from an invisible line almost every night to keep reminding me to what I am fighting for and make it comes true.
Finally I hope this research can be useful for many people.
Bogor, June 2014
CONTENT
LIST OF TABLE vi
LIST OF FIGURE vi
LIST OF APPENDIX vi
INTRODUCTION 1
CLUSTER ANALYSIS 1
GENETIC ALGORITHM 2
THE APPLICATION OF GA ON CLUSTER ANALYSIS 4
PERFORMANCE OF GACV 5
Methodology and Data 5
Adaptation Phase of GACV 5
Implementation GACV in R 8
Performance Analysis 9
CONCLUSION 10
REFERENCES 10
APPENDIX 12
LIST OF TABLE
1 Illustration of generating a seed individual 6
2 Illustration of generating an additional individual 6
3 Performance of GA on incomplete data 10
LIST OF FIGURE
LIST OF APPENDIX
1 Illustration of genetic elements 2
2 Crossover for binary variable 4
4 Fitness value 7
5 Illustration of crossover 7
6 Chart of correctness for several mutation rates 8
1 GACV developed under R 12
INTRODUCTION
Cluster analysis is an important technique in a wide variety of fields, such as psychology, economics, biology, bioinformatics, medicine, business and marketing, social science, world wide web, and data mining. Zadeh (2011) applied cluster analysis for profiling customers of a bank based on their behavior. The analysis helped bank to identify the best retention strategies for current customers and the best acquisition strategies for new customers. Ketels (2008) explained that clustering locations based on the specific conditions can improve the efficiency of economic policy. Li (2007) showed that clustering provides an efficient way to classify sessions, a semi-permanent interactive information interchange between two or more communicating devices, into several classes that efficiently describe web workloads.
Most of clustering methods employ distance as a similarity index for clustering the observation. This index requires complete information for all observations. But sometimes we are faced with the observations that have incomplete values for some variables. This will disrupt the process of calculating the distance to each observation, so that we should be filling in the missing values or excluding those observations. Filling in the missing values will result an addition error in the analysis due to estimate the missing value, whereas excluding observations will reduce the information, other than that sometimes we want to know the group from an observation although these observations have incomplete value, so this technique cannot be applied. Employing a different similarity index with other approaches can overcome this problem.
The objective of this study is applying Genetic Algorithm (GA) to cluster observations with missing values without filling in the missing values or excluding these observations.
CLUSTER ANALYSIS
2
There are several problems in using classical methods for clustering observations, such as determining the number of clusters, similarity measure, and handling incomplete data. Common methods to determine number of cluster are theoretic approach, kernel matrix, the elbow method, etc. However, it should be determining by the user so it is better to run algorithms more times to select a number of cluster that perform best characteristics.
Similarity index is employed to classify similar observations into a cluster. Most of classical clustering methods employ distance as a similarity index. However, this method cannot be implemented to data containing observations with incomplete value in one or more variables because those observations cannot involved in calculating distance. Therefore, implementation of this method on incomplete data will reduce the information due to excluding the observation with incomplete values.
GENETIC ALGORITHM
Natural selection encourages individuals compete against each other to survive longer. Individuals who cannot adapt with their environment over time will extinct. So that only individuals whose high performance remained in next generations. This idea inspired people to construct GA for solving optimization problems. Haupt R and Haupt S (2004) explained the history of GA which was developed by John Holland in 1975 over the course of the 1960s and 1970s and finally popularized by his student, David Goldberg, who was able to solve a difficult problem involving the control of gas-pipeline transmission for his dissertation. Liu (2011) mentioned some previous studies that implemented GA to solve problems and got the optimal solutions. GA is optimally fit to optimize solution of big data. However it is not always be the best way to solve every problem, especially for data with only has few variables or problems that are not overly difficult because other methods may find solutions faster than GA.
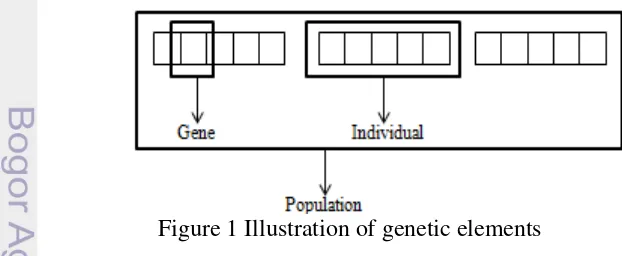
Suppose that we would like to find x so that a certain function f(x) is maximum. We call f(x) as an objective function and x is a solution. In GA implementation a solution is represented by an individual while an individual is collection of genes and an objective function is represent as a fitness function that is employed to find the best solution of problem. Illustration of gene, individual, and population are shown by Figure 1.
3 The individuals should be initiated in beginning of the GA phase as an initial population. Each individual has an associated fitness value which quantifies its value as a solution to the problem, so we can select individuals who represents a better solution. The selected individuals are recombined to form new generation of the population. Then, individuals in new generation mutate their self and continue to selection phase. This phase will stop when the individuals in a generation has been similar. Further explanations of the GA phase are as follows: a. Initial population
Since GA searches over feasible solution, initial population should be complete and valid in order to make sure there is no redundancy that causes problem of convergence. Initial population may use a random initial or generated from seed points. These seed points may be random or selected by using a method.
b. Selection
Fitness value indicates the suitability of each individual as a solution. This value is a basis value for selecting nselect individuals in selection phase. The performance of GA depends on fitness function because selection phase provides the pressure for GA to evolve its population toward individuals of better fitness. There are several selection techniques, those are ranked selection, tournament selection, fitness proportional selection or roulette wheel selection, and stochastic universal sampling.
Cole (1998) used ranked selection by ranking the individuals based on their fitness value and selected top nselect individuals. Liu (2011) applied tournament selection by obtaining two individuals randomly and compared their fitness values, the selected individual has a better fitness value. This process is repeated nselect times. Cole (1998) explained that roulette wheel
selection chooses individuals based on a probability proportional to their relative fitness, so individuals with the optimal fitness value have bigger probability to be selected than the others. Pencheva (2009) applied stochastic universal sampling by mapping the individuals to contiguous segments of a line such that each individuals segment is equal in size to its fitness as in roulette wheel selection.
c. Crossover
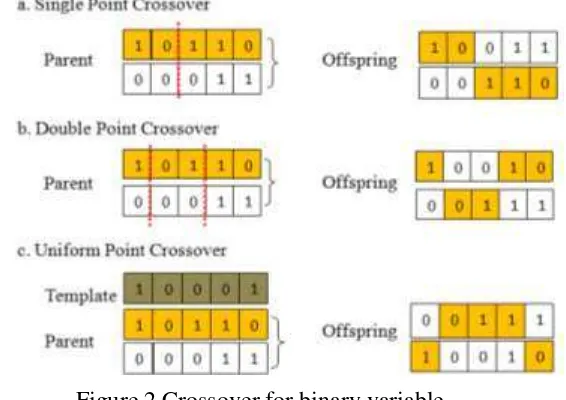
Crossover recombines two individuals as parent to produce new individuals, offspring, who inherit the characteristic of their parents moreover they are expected to be better than their parent. Cole (1998) mentioned there are several techniques to crossover binary variable, such as single point crossover, double point crossover, and uniform point crossover. Figure 2 illustrates crossover for binary variable.
4
d. Mutation
Mutation is a genetic operator which alters one or more genes values in an individual to maintain genetic diversity. With these new gene values, the genetic algorithm may be able to arrive at better solution than was previously possible. Mutation is an important part of the genetic search as it helps to prevent the population from stagnating at any local optima. However, mutation occurs at a small probability, referred to mutation rate, to ensure that good solutions are not distorted too much.
THE APPLICATION OF GA ON CLUSTER ANALYSIS
An optimization method is popular in the field of clustering because of their fast processing speeds and ease of implementation. This method search over for feasible solution by optimizing an objective function and usually begins with an initial solution, after which reallocation occurs according to some optimality criterion. Most of optimization methods are developed based on the principle of
K-means to make it more effective and efficient than K-means.
GA as an optimization method can be applied for cluster analysis as part of an optimization method by adapting its parameter with a clustering technique. After adapting parameters of GA with clustering technique, the phase of GA can be applied to obtain optimum solutions. The genes value are used to signify which cluster the object belongs to and an individual is candidate solution which have information about cluster for all observations.
An objective functions or a similarity index which is employed for traditional clustering method can act as fitness function for implementing GA on clustering the observation. The fitness function could be ratio of between sum of squares and within sum of squares, distance, correlation, or variance.
Cole (1998) has applied GA to cluster the iris data set and succeed for clustering Iris data with 100% sensitivity and consistency over the 10 runs. Unfortunately, his study employed distance as a similarity index for clustering
5 observation, so it could not be implemented for clustering incomplete data. In this study, variance as a similarity index was expected for clustering the observation without inputting or excluding the observation with incomplete value. This similarity index was used in GA to find clusters which have minimum variance within a cluster.
PERFORMANCE OF GACV
Methodology and Data
This study applied GA by using variance as a similarity index. It was named GACV. This algorithm was applied to Iris data which was introduced by Sir Ronald Fisher. Iris data consist of 150 observations and 4 variables. The variables are length and width of sepals and petals in centimeters which have positive correlation each other. The species on Iris data were known, namely Iris setosa, Iris versicolor, and Iris virginica. One species is linearly separable from the other two, but the other two are not linearly separable from each other. The cluster result of GACV could be compared with the correct cluster to assess its performance since the species of this data is given. In this study, the Iris data was standardized by dividing values with the maximum value of its variables. Data should be standardized before clustering because variables should have same scale for a fair comparison between of them.
This study was begun by developing GACV function under R 3.0.2 software and then compared several trial techniques in GA phase to determine the best adaption for clustering. The performance of this function then was assessed for clustering complete data. If GACV has a good performance for clustering the complete data, it would be continued for clustering incomplete data. Clustering incomplete data also involves Iris data, so this study can assess its performance. Several values in Iris data was deleted randomly for producing the incomplete data. There should be no observation which missed all values in the incomplete data.
The performance of GACV is assessed based on sensitivity and consistency. Sensitivity was defined as the maximum percentage of observations that were clustered in the same groups as the correct clustering. For example, if the correct clustering was {{ , , , , , , }}, the clustering {{ , , , , , , }} has 85.7% sensitivity. Consistency is the maximum percentage of runs that has same sensitivity for all runs.
Adaptation Phase of GACV
As mentioned before, in order to get good results then conducted several trials for each phase of GA. For further explanation will only describe the best techniques on GACV function.
6
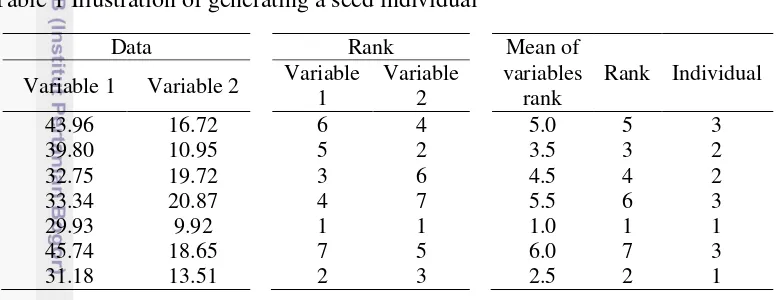
achieve convergence. Occasionally, population may be seeded in areas where optimal solutions are likely to be found for reducing iteration on generating randomly. This study initiated a seed individual by ranking the mean of observation rank of variable and used rank to determine value of gene. The first top s, rounded down value of number of observation divided by number of cluster, will be members of first cluster, the second top s will be members of second cluster and so on. Table 1 illustrates how to generate a seed individual. Data column shows the example of data set that consist of 2 variables and 7 observations. The observations were ranked for each variable that is shown by rank column and then determined mean of rank for each observation, this mean was used to rank observations. If there are 3 clusters on this data, s is equal to 2. So, observations which have rank 1st and 2nd are members of first cluster, observations which have rank 3rd and 4th are members of second cluster and the others are members of third cluster. This seed individual was employed to generate the other individuals by adding the random number on a seed individual.
This study also initiated an additional individual which is illustrated by Table 2. An additional individual was obtained by ranking the mean of observation value and then applied the previous way for determining the values of genes.
Table 2 Illustration of generating an additional individual Data
Table 1 Illustration of generating a seed individual
Data Rank Mean of
variables rank
Rank Individual Variable 1 Variable 2 Variable
7 Variance was utilized for clustering because an objective of this study is clustering the incomplete data without filling in the missing value or excluding the observations with incomplete value. The function of fitness value is:
Fitness value =
where c is number of clusters, m is number of variables, and var is variance of values on ith cluster and jth variable. This function has the best performance than other functions in trial.
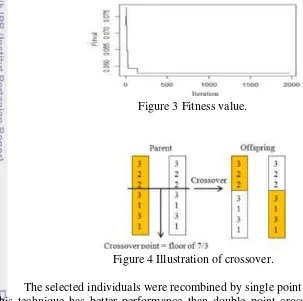
Since good cluster should has a minimum variance of observations within a cluster, so it is expected that this algorithm can minimize the fitness value as small as possible. Selection operator employed ranked selection to select top 5 individuals which have the minimum fitness value. Figure 3 shows that fitness value decreases and approaches zero, so the algorithm is good enough to minimize the fitness value.
The selected individuals were recombined by single point crossover because this technique has better performance than double point crossover and uniform point crossover. Single point crossover employed one fixing point which is half of
n, a number of observations. So half of genes from each parent were exchanged to produce offspring and then the parents joined them became a new generation. Figure 4 illustrates the single crossover which is used in this study.
Process of GACV continued to mutation phase after mating individuals by crossover. Genes mutated by changing its value with a random number. Chart in Figure 5 shows that sensitivity increases by decrement of mutation rate where it is more than 0.007, but it constant until 0.005 and then decreases by decrement of mutation rate where it is less than 0.05. This study used 0.005 as mutation rate because it has shorter time running than 0.007.
8
Implementation GACV in R
Function of implementation GACV in R is shown on Appendix 1. Input of this function consists of X, c, alpha, and “iteration”, where X is an n×m matrix that contains standardized data, c is a number of clusters, alpha indicates the convergence parameter, and “iteration” is a maximum number of iteration.
GACV consists of four subfunctions which are: 1. Initial population
This function is employed to initiate the population. The initial population consists of 10 individuals which 8 of them were generated based on a seed individual. The population is expressed as an n×10 matrix which each row corresponding to an observation and each column associated with an individual. This function puts missing value on the last rank to generate a seed individual and ignores missing value on determining mean of observations to generate an additional individual.
2. Selection
Selection function determines the fitness value of each individual and ranks them based on its fitness value and then selects the top five of them. This function determines the variance of existing values in a cluster for each variable and ignores the incomplete values.
3. Crossover
This function loops the crossover to recombine an individual with others. It recombines 5 selected individuals to produce 20 individuals as offspring and then the parent join them as a new generation. So, it always produces 25 individuals as a new generation.
4. Mutation
A new generation mutated by generating a mutation matrix which has same dimensional with a new generation based on Bernoulli distribution with mutation rate as its success probability. This matrix consists of 1 and 0. Genes who have the same position with 1 on mutation matrix will mutate and others will not. Genes mutates by changing their value with the random
9 numbers between 1 and c except its value to make sure that all genes changes their value in mutation.
Establishing the convergence of GACV optimization may not be an easy matter because we do not know for sure if it converges to a local or global minimum. Iteration of GACV will stop if the condition, range of fitness value, is less than or equal to alpha. However, iteration will stop on maximum number of iteration which is input on argument list if the range is never less than or equal to alpha. The outputs of GACV are a solution with its fitness value, number of iteration, and time for running the program.
Since an objective of this study is applied GA for clustering incomplete data, we need to produce the incomplete data from Iris data. Function on Appendix 2 was employed for deleting some values randomly to produce incomplete data. After running this program, the data was checked manually to make sure that there was no observation which missed all values.
Performance Analysis
GACV was executed 100 times to evaluate its consistency. Its result has 95.99% sensitivity and consistent with the result 98% for all 100 runs on clustering complete data. It means the sensitivity average of 100 runs is 95.99% and 98 from 100 runs consistent to state that the sensitivity is equal to 95.99%. In other word, GA miss clustered 6 from 150 observations. Although it did not outperform result of Cole (1998), it could be expected for clustering the incomplete data, because the sensitivity and consistency are quite satisfying (more than 95%).
10
CONCLUSION
This study applied GA for clustering by employing GACV function. GACV has satisfying result for clustering complete data with 95.99% sensitivity and 98% consistency. In complete data, GACV does not perform better than algorithm of Cole (1998). However GACV can be applied for clustering observation with incomplete data without any pre-processing step to incomplete observations while algorithm of Cole (1998) is incapable. In reality, case of incomplete data is common issue in statistical analysis. Performance on clustering observations with incomplete data is also satisfying but its performance tends to decrease as the proportion of incomplete data increases. The proportion of incomplete data of less than 40% produces high sensitivity and consistency.
Johnson RA, Wichern DW. 2007. Applied Multivariate Statistical Analysis. 6th ed. New Jersey (US): Pearson Education, Inc.
Ketels CHM, Memedovic O. 2008. From Cluster to Cluster-Based Economic Development. Journal of Technological Learning, Innovation, and Development. 1(3):357-392.
Li F, Goseva PK, Ross A. 2007. Discovering Web Workload Characteristics Through Cluster Analysis. Proceedings ofThe IEEE International Symposium on Network Computing and Applications; 2007 Jul 12-14; Cambridge, United States. Cambridge (US): IEEE. p 61-68.
Table 3 Performance of GA on incomplete data Incomplete value
proportion
11 Liu ZC, Lin XF, Shi YJ, Teng HF. 2011. A Micro Genetic Algorithm with Cauchy Mutation for Mechanical Optimization Design Problems. Information Technology Journal. 10(9):1824-1829.doi:10.3923/itj.2011.1824.1829.
Pencheva T, Atanassov K, Shannon A. 2009. Modeling of a Stochastic Universal Sampling Selection Operator in Genetic Algorithms Using Generalized Nets.
Proceedings of Workshop on Generalized Nets; 2009 Dec 5; Sofia, Bulgaria. Sovia (BG): Ifigenia. p 1-7.
Rencher AC. 2002. Methods of Multivariate Analysis. 2nd ed. New York (US): J Wiley.
12
Appendix 1 GACV developed under R GACV<-function(X,c,alpha,iteration) variance <- function(x) var(x,na.rm=TRUE) for(i in 1:c)
fitval <- apply(fitness,2,sum) G<-G[,order(fitval)]
Gnew<-G[,1:5] list(Gnew,fitval) }
14
p<-p+1
fit<-rbind(fit,min(selects[[2]])) }
res<-mutations[,order(selects[[2]])] ress<-res[,1]
result<-fTable(data.frame(ress,iris[,5])) ti<-Sys.time()-ts
15 Appendix 2 Function of incomplete data
incomplete <- function(x,p) {
A<-matrix(1,(nrow(x)*ncol(x)),1)
b<-sample((1:(nrow(x)*ncol(x))),(nrow(x)*ncol(x)*p),replace=F) A[b,]<-NA
A<-cbind(A[1:150,],A[151:300,],A[301:450,],A[451:600,]) id <- x*A
16
BIOGRAPHY
Frisca Rizki Ananda was born in Padang Panjang (West Sumatera) as the eldest daughter of Syafrizal and Yefrida on February 12th, 1993. She accomplished high school study on the same city and was graduated from SMAN 1 Padang Panjang and SMPN 2 Padang Panjang before planning study of bachelor degree in IPB on 2010.
During her college life, besides studying statistics in formal academic form, she also ever being an assistant of several subjects which are methodology of statistics, regression analysis, and experimental design and being a teacher of expert course.