Analysis of the Mental Workload on a Public Bus Driver
HartomoSoewardi
*,Eko Budi Wibowo
#*
Industrial Engineering Department Islamic University of Indonesia
Industrial Engineering Department Islamic University of Indonesia
Abstract
One of the causes of traffic accidents involving buses is human error. Human error is often the case one of them as a result of excessive load received by the driver. In addition to physical, mental workload is one of the causes of high workload. The purpose of this study was to analyze the mental workload experienced by the bus driver Yogyakarta-Semarang. The method used is the NASA-TLX. Numbers of respondents were 16 bus drivers. The results found that the average mental workload on the bus driver is 62.4. The indicators most influence is Effort with an average of 18, Physical Demand with an average of 12.67, Mental Demand with an average of 10.67. Other indicators, Temporal Demand with an average of 10:10, Own Performance by an average of 6.08 and the frustation level with an average of 4.88.
Key words –Bus driver, Mental workload, NASA-TLX
I. INTRODUCTION
Based on data Korlantas Police of Republic Indonesia, in 2013, in one day about 13 buses involved in the accident. Meanwhile, in 2012, in one day there are 23 bus involved accident. And in 2011 there were 14 buses involved in traffic accidents.Common causes of bus accidents is damage to infrastructure such as potholes, damage completeness instrument bus (such as brake failure, the lights go out, etc.), fatigue or drowsiness experienced by the driver, to drive aggressive or reckless, the driver is under the influence of alcohol or drugs, as well as bus speeds that exceed the limit to meet the transportation route schedule. From some of these factors, fatigue was the most common factor as the cause of the accident. If further study, fatigue itself is one of the implications of workload experienced by the driver.
Ability to work a labor differ from each other, depending on the level of skills, physical fitness, nutritional status, gender, age and body size of the job is concerned (Suma’mur,1984)[1]. Generally workload and work capacity is influenced by many factors that are very complex, in the form of external factors and internal factors. The external factor is the workload that comes from outside the body, while internal factors workers workload is a factor derived from the worker's own body as a result of reaction (strain) of the external work load (Rodahl, 1989)[2]. Character of human work is divided into two types, namely physical and mental which each influenced by different factors. Physical work is work that requires physical energy of human muscle as a source of strength. Physical work will result in some changes
in the function of human organs. Therefore, the physical workload can be measured via oxygen consumption, heart rate, blood circulation is pumped lungs, body temperature, the concentration of lactic acid in the blood, the chemical composition of the blood and urine, evaporation rates, and other factors. While the mental work is work that involves thinking of the brain where the mental work can lead to the onset of mental workload.
According to Henry R. Jex (in Hancock & Meshkati, 1988) mental workload can be defined as the load assumptions derived from the work of a worker process to achieve a certain performance level[3]. Mental workload is the difference between the mental demands of work with the mental ability of the workers is concerned. O'Donnell and Eggemeler (1986) said that, as the mental work load capacity of a person to complete the task, may be the extent to which the level skill and job performance worker individually owned by another individual [4].
Widyanti, et al (2010) says that the mental workload can be measured by a physiological approach (as quantified by the objective criteria, so-called objective methods). While the measurement of workload is a measure of subjective mental workload subjective perception of the respondents or worker [5]. This research attempts to analyze mental workload on the public bus driver. Measurement of mental workload done subjectively by the method used is the NASA-TLX..Previous studies using the same method is Workload Analysis of Air Traffic Control Operator Xyz service performed by Jerry Budiman, et al [6]. Other studies were also conducted by Siti Miranti Astuti, et al in which the research is to measure the perceived mental workload machinist Daop II Bandung with offices close range (Bandung-Padalarang, Cicalengka) and train away (Banjar, Bandung-Jakarta) [7]. Charles Aldey and Michele Terranova also been doing similar research with the aim of measuring the mental workload experienced by supervisors pipelines on the day shift and the night shift at the company Clock Spring [8].
II. METHODS 2.1 Object Research
2.2Research Design
Research conducted by the NASA-TLX questionnaires to the bus driver. The questionnaires were distributed after the driver do his job. Questionnaire consists of two parts, namely weighting consists of 15 pairs of the six dimensions of NASA-TLX consisting of Mental Demand (MD), Physical Demand (PD), Temporal Demand (TD), Own Performance (OP), Effort (EF). In the first part, respondents will choose one of the indicators of perceived partner more dominant cause of mental workload. The second part is the rating. This section contains questions with answers in the form of a scale of 0-100. Based on the weighted workload value to be obtained, it will be known categories of perceived driver workload, whether the category of low workload (underload): a score of <40, the optimal workload (optimal load): 40 ≤ score <60, or excessive workload (overload): a score of ≥ 60 (Syafei and Katon, 2011) [9].
2.3 Research Instruments
The research instrument is an equipment used for mental workload on the intercity bus drivers across provinces of Yogyakarta-Semarang. In this study, the instrument used is the NASA-TLX questionnaire. NASA-TLX consists of six dimensions of workload measurement, the mental demand, physical demand, temporaldemand, performance, effort, and frustration level.
III.RESULTS AND DISCUSSION
3.1 Calculation of Mental Workload
The results of the calculation of the weighted workload of the NASA-TLX questionnaire can be seen in Table 1.
Table1 Weighting Data Questionnaire
Bus driver
(MD) (PD) (TD) (OP) (FR)
(EF) Total
1 2 2 3 1 3 4 15
2 2 3 3 3 1 3 15
3 2 2 2 4 0 5 15
4 1 2 4 4 0 4 15
5 2 2 3 2 1 5 15
6 1 2 2 3 2 5 15
7 2 2 3 4 0 4 15
8 2 5 3 2 0 3 15
9 1 3 4 3 2 2 15
10 1 3 0 4 2 5 15
11 2 0 4 4 0 5 15
Bus driver
(MD) (PD) (TD) (OP) (FR)
(EF) Total
12 2 3 1 4 1 4 15
13 2 2 1 5 1 4 15
14 2 1 1 3 3 5 15
15 4 3 0 2 1 5 15
16 5 4 3 2 0 1 15
Results of rating administration are shown in Table 2. Table2 Awarding Rating
Bus Driver
MD PD TD OP FR EF
1 85 100 65 20 100 100
2 80 80 60 0 30 50
3 100 100 80 50 10 50
4 60 60 70 80 20 75
5 70 60 70 30 60 80
6 90 60 80 20 70 70
7 65 80 50 10 30 40
8 80 80 70 30 40 80
9 50 100 75 50 75 50
10 60 60 60 20 70 60
11 70 80 70 30 60 70
12 60 70 50 40 60 50
13 60 80 80 10 50 70
14 70 70 80 20 50 60
15 80 80 30 30 90 90
16 100 80 30 10 40 90
Table 3 Average Weighted Workload
Bus
Driver MD PD TD OP FR EF Total
1 11.33 13.33 13.00 1.33 20.00 26.67 85.67
2 10.67 16.00 12.00 0.00 2.00 10.00 50.67
3 13.33 13.33 10.67 13.33 0.00 16.67 67.33
4 4.00 8.00 18.67 21.33 0.00 20.00 72.00
5 9.33 8.00 14.00 4.00 4.00 26.67 66.00
6 6.00 8.00 10.67 4.00 9.33 23.33 61.33
7 8.67 10.67 10.00 2.67 0.00 10.67 42.67
8 10.67 26.67 14.00 4.00 0.00 16.00 71.33
9 3.33 20.00 20.00 10.00 10.00 6.67 70.00
10 4.00 12.00 0.00 5.33 9.33 20.00 50.67
11 9.33 0.00 18.67 8.00 0.00 23.33 59.33
12 8.00 14.00 3.33 10.67 4.00 13.33 53.33
13 8.00 10.67 5.33 3.33 3.33 18.67 49.33
14 9.33 4.67 5.33 4.00 10.00 20.00 53.33
15 21.33 16.00 0.00 4.00 6.00 30.00 77.33
16 33.33 21.33 6.00 1.33 0.00 6.00 68.00
Table 4Categorization of the Value of Mental Workload an average of 60.4. The high values acquired mental workload can be described in detail when observed by the NASA-TLX indicator.
1. Mental Demand (MD)
From the overall data obtained the average number of indicators MD of 10.67. This value shows a significant influence on the mental workload on the driver. This is because during the work or performing their duties, a driver is required to concentrate fully. They are fully responsible for the safety of passengers during the trip. Mileage trips that must be taken long enough, that is as far as 117 km to the destination of Yogyakarta-Semarang. Within a day, the driver worked for almost 12 hours, divided into 3 time travel. In addition, it takes a pretty powerful ability to operate the bus, because the bus operation is somewhat different from a regular car, although in principle the same. The difference is the dimensions of the vehicle, the weight of the vehicle, the transmission system gearshift, steering wheel position etc. Plus the volume of traffic on the line is pretty crowded as it is the connecting line between the north coast of Java (Pantura) and south coast lines of Java. Heavy traffic dominated the motorcycle which often makes unexpected maneuvers in driving. Thus in addition to requiring a high concentration in the control of the vehicle (in this case driving the bus) is also required to keep a wary eye on the surrounding environment (traffic in general). However, to reduce the pressure faced by the driver, the company implemented a policy that all passengers, the driver and the vehicle is insured. So that if in
case of adverse conditions (an accident) the driver does not through the number shown. A driver is required to always be in good shape in the works. On each day, a driver has a duty to drive as many as three trips (setangkepselirang), for example, the first trip Yogyakarta-Semarang at 07.00, at 10.15 second trip from Semarang-Yogyakarta, and on the third trip Yogyakarta-Semarang 13.45. Each interval trips, the driver only rested about 15 minutes if on schedule. If late then, rest time is also reduced to meet the target of the scheduled departure. After finishing the third trip, the driver can not immediately break, they still got other responsibilities such as cleaning the bus and checking the condition of the bus. So obviously, the physical demand of the bus driver is very high.
3. Temporal Demand (TD)
The average value of the indicator is 10.10. In their work, the driver targeted the 3 hour trip to Yogyakarta-Semarang or otherwise and 4-hour trip to Kudus Yogyakarta. However, it is often difficult to fulfill this target. This is because the traffic condition of this track is often unpredictable. Condition that often occurs is congestion due to an accident or road works and lane diversion. Moreover, as mentioned above, the volume of vehicle was also crowded and in some point of the narrowing of the road so the bus had to drive slowly. So that it makes the target time is not too much of a strain for the driver. However, if trips exceeds the target time, this resulted in reduced allocation driver rest because it is not possible to change the scheduled departure time. So the work is considered quite tiring for the driver.
4. Own Performance (OP) passengers to the destination safely and survived. Moreover, this satisfaction, influenced by the results of the other end received by the driver, the wages or salary. In this research object, the payroll system is done on commission. Where the driverrevenue is affected how much passengers carried. They get a percentage of the ticket price paid by the passenger, the rest is left to the company.
5. Frustration Level (FR)
conditions however, this cannot be avoided. So, they think this is just a natural thing because it is beyond the power of them.
6. Effort (EF)
Effort has an average of 18.00. This indicator is an indicator which has the highest average value. So the effort is the most dominant indicators that affect the value of the bus driver's mental workload as a whole. This is because each driver was exerting every effort to carry out the work both physically and mentally. They consider the accumulation of physical and mental high is a guarantee of success in achieving work targets.
Overall, the average mental workload endured by the bus driver was 62.40, for the value of each respondent can be seen in Table 4 Table categorization of mental workload. Based on research conducted by Syafei and Katon, mental workload endured by the respondents included in the category of overload. Wiebe, et al (2010) says that the mental workload overload occurs if the mental workload endured by workers too much [10]. Wicknes (2002) says that the mental workload has limitations [11]. While mental workload underload, when the effort required to complete a small task Overload allows a decrease in performance (Cassenti & Kelley, 2006) [12]. According Angelucci, et al (2010) states that the mental workload overload will affect the productivity and decision-making [13].
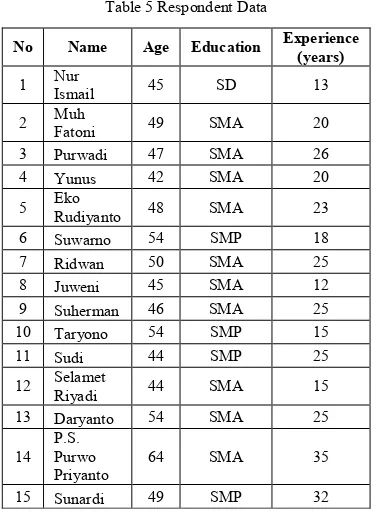
The study also attempted to analyze the variables outside of the NASA-TLX indicators are possibility of having a relations with the mental workload on the driver. The variables are age, education and work experience. Foreach variable the data is shown in Table 5. The method used to find the relationship of these variables is linear regression test.
Table 5 Respondent Data
No Name Age Education Experience (years)
1 Nur
Ismail 45 SD 13
2 Muh
Fatoni 49 SMA 20
3 Purwadi 47 SMA 26
4 Yunus 42 SMA 20
5 Eko
Rudiyanto 48 SMA 23
6 Suwarno 54 SMP 18
7 Ridwan 50 SMA 25
8 Juweni 45 SMA 12
9 Suherman 46 SMA 25
10 Taryono 54 SMP 15
11 Sudi 44 SMP 25
12 Selamet
Riyadi 44 SMA 15
13 Daryanto 54 SMA 25
14 P.S. Purwo Priyanto
64 SMA 35
15 Sunardi 49 SMP 32
16 Hariyanto 34 SMA 12
Regression test results are as follows:
Table 6Model Summaryb
Model R
R
Square
Adjusted R
Square
Std. Error of
the Estimate
Durbin-Watson
1 .671a .450 .312 9.74850 1.816
a. Predictors: (Constant), x3, x2, x1
b. Dependent Variable: y
Table 7ANOVAb
Model Sum of Squares df
Mean
Square F Sig.
1 Regression 932.671 3 310.890 3.271 .059a
Residual 1140.399 12 95.033
Total 2073.070 15
a. Predictors: (Constant), x3, x2, x1
b. Dependent Variable: y
Table 8 Coefficientsa
Model
Unstandardized
Coefficients
Standardized
Coefficients
t Sig.
Collinearity
Statistics
B
Std.
Error Beta Tolerance VIF
1 (Constant) 131.535 22.611 5.817 .000
x1
-1.124 .470 -.633
-2.392
.034 .655 1.526
x2
-9.365 4.207 -.493
-2.226
.046 .934 1.071
x3 .444 .457 .261 .971 .351 .634 1.577
a. Dependent
Variable: y
(2007) indicates that the value of the variable relations to the strong category [14]. While the value of R Square or coefficient that indicates how well the regression model were established Rated R Square of 0:45 meaningful variables X1, X2, X3 has an influence on Y variables by 45% While the other 55% is influenced by other factors.
In Table 7 shows the level of significance and linearity in the regression. Own criteria based on the F test or tests of significance (Sig). If the Sig <0.05 then, is a linear regression model. In the table it can be seen that the value of Sig 0.059 which is 0.059> 0.05. Thus, the regression model based on the research is not significant. In Table 8 shows the regression model. Based on the table obtained regression model:
= 131,535 + −1,124 1+ −9,365 2+ 0,444 3
Solutions to problems:
Overall physical and mental factors are affecting the mental workload endured by the driver. Thisis influenced by long working hours, rest periods were short and the complexity of the current work. Things that might be done to at reducing the mental workload endured by the driver is to set the work time, rest time and maximize the role of reserve driver.
As in the Government Regulation No. 44 of 1993 chapter 240 of the vehicle and the driver. In paragraph 2, it says that the working time for drivers of public transport is 8 hours a day In paragraph 3 reads public vehicle driver after driving the vehicle for 4 hours in a row, should be given a break of at least half an hour Deviations exceeding 8 hours of working time must not exceed 12 hours
Improving the working time cannot be done by changing the scheduled departure time because it is very risky. Considering it can significantly affect the company's revenues and could harm trajectory license and disturbing the other bus departure schedule. This can be done only limited work time around the driver, the use of a substitute driver to the fullest If the previous driver was a substitute only in Terminal Semarang then, it is advisable also provided in Terminal Yogyakarta. So the first replacement driver on Yogyakarta standby and the other one in Semarang. Each completed run 2 times the trips, the driver must be replaced regularly substitute driver at the next scheduled departure. Additionally, at each terminal should be provided a special resting place driver. This place is useful for relaxation immediately after driving. Health check for the driver also needs to be done regularly to monitor the condition of driver fitness.
IV. CONCLUSIONS
Based on the research that has been done, it was concluded as follows:
1. Mental workload endured by inter-city bus drivers between provinces overload with a value 62.4 is the dominant factor influencing the effort while the smallest factor influencing it is frustration level.
2. To reduce the mental workload endured by the driver, the driver needed a replacement at any terminal so after two trips, the regular driver was replaced by a substitute driver. Additionally, at each terminal needs to be made specifically for a driver break room, to the driver can rest properly before starting work again.As a precaution, should the holding of periodic health checks for the driver so that the condition of each driver can be monitored well.
REFERENCES
[1] Suma’mur. “Higiene Perusahaan dan Kesehatan Kerja”. Jakarta: PT. Gunung Agung.1984.
[2] Rodahl, Kare. “The Physiology of work”. London: Taylor & Francis Ltd. 1989.
[3] Hancock, P. A. & Meshkati, N. “Human Mental Workload”. Amsterdam:
Elsevier Science Publishing Company, Inc. 1988.
[4] O’Donnell, R.D., & Eggemeier, F.T. “Workload Assessment
Methodology”. New York: Wiley. 1986.
[5] Widyanti, A., et al. 2010. “Pengukuran Beban Kerja Mental Dalam
Searching Task Dengan Metode Rating Scale Mental Effort (RSME)”.
Semarang: JTI Undip. 2010.,in press
[6] Budiman, J., dkk. “Analisis Beban Kerja Mental Operator Air Traffic
Control Bandara XYZ Dengan Menggunakan Metode NASA-TLX”.
e-Jurnal Teknik Industri FT USU Vol. 3, No. 3, pp. 15-20. 2013., in press.
[7] Astuty, M.S., dkk. “Tingkat Beban Kerja Mental Masinis Berdasarkan
NASA-TLX (Task Load Index) di PT. KAI Daop II Bandung”. Jurnal
Online Institut Teknologi Nasional Bandung. Reka Integra– ISSN:
2338-5081. 2013., in press.
[8] Aldey, C. & Terranova, M. “Measuring Control Room Mental
Workload witha Multi-Dimensional Measure”. Pipeline & Gas Journal;
ProQuest. 2012., in press.
[9] Syafei, M. & Katon, W. 2011. “Analisis Beban Kerja Pegawai Secara Subjektif dengan Menggunakan Metoda NASA-TLX (Studi Kasus pada Bagian Proses Manufaktur di PT. Agronesia Divisi
Industri Plastik-Bandung)”. Proceeding 11th National Conference of
Indonesian Ergonomics Society 2011. ISSN: 2088-9488. 2011., in press. [10] Wiebe, E.N., et al. “An examination of two mental workload
measurement approaches to understanding multimedialearning.
Computers in Human Behaviour”, 26, 474-481. 2010.
[11] Wickens, C.D. “Multiple resources andperformance prediction.
Theoretical Issues in Ergonomic Science”, 3, 159-177. 2002.
[12] Cassenti, D.N., Kelley, T.D. “Differences in Performance with
Changing Mental Workload as Basis for an IMPRINT Plug-in Proposal”.
Ottawa: BRIMS Society. 2013.
[13] Angelucci, M., et al. “Mental Overload, Productivity, and
Decision-Making”. Arizona: University of Arizona. 2010.
[14] Sugiono, Prof. Dr. “Statistik Nonparametrik Untuk Penelitian”.