ANALYSIS OF SOUND PRESSURE LEVEL (SPL)
AND LAY OUT OF ENGINES IN THE FACTORY
Wijianto
Mechanical Engineering Dept. Muhammadiyah University of Surakarta Jl. A. Yani Tromol Pos I Pabelan Kartasura Sukoharjo
E-mail : [email protected]
ABSTRACT
Modeling layout of engines in the factory is very useful to know how many dB sound pressure level that are occur in the building in order to avoid hearing damage of employees that are caused by noise. The objective of this research is to know how many dB sound pressure level that are occur in the factory with engine composition such as boiler, diesel, turbine, motor and gear box with dimension of building are 40 m length, 35 m width and 10 m height. With MATLAB analysis can be obtain that the highest SPL is 104.7 dB and the lowest is 93.5 dB, so, this range are dangerous for human hearing. To avoid hearing damage in this area, employees must use hearing protector.
Keywords: dB, noise, sound pressure level, MATLAB
INTRODUCTION
Noise is defined as unwanted sound. The vibration of sound pressure waves in the air produces sound. Sound pressure levels are used to measure the intensity of sound and are described in terms of decibels. The decibel (dB) is a logarithmic unit that expresses the ratio of the sound pressure level being measured to a standard reference level. Sound is composed of various frequencies, but the human ear does not respond to all frequencies. Frequencies to which the human ear does not respond must be filtered out when measuring highway noise levels. (Fhwa highway noise barrier design handbook, 2006)
Sound-level meters are usually equipped with weighting circuits that filter out selected frequencies. It has been found that the A-scale on a sound-level meter best approximates the frequency response of the human ear. Sound pressure levels measured on the A-scale of a sound meter are abbreviated dBA.(Guidelines of noise barrier, 2003)
In addition to noise varying in frequency, noise intensity fluctuates with time. The equivalent sound level is the steady-state, A-weighted sound level which contains the same amount of acoustic energy as the actual time-varying, A-weighted sound level over a specified period of time. If the time period is l hour, the descriptor is the hourly equivalent sound level, Leq(h). An additional descriptor, which is sometimes used, is the L10. This is simply the A-weighted sound level that is exceeded 10 percent of the time. (Irwin JD, Graf ER 1979)
THEORITICAL BACKGROUND
Sound Pressure Level (Lp)
Average of Sound Pressure Level (Lp)
Total of Sound Pressure Level (Lp total)
dB total
L iN
Lpi
p =10log10 ⎢⎣⎡
∑
=110 10⎥⎦⎤ ..….[3]Sound Power Level
⎟⎟⎠
Pressure in the far field can be expressed as
[ ]
2Sound power can be determined by
[ ]
By introducing the reference quantities for sound power and pressure and taking logs, the sound power level can be expressed as
( )
Where Wref = is the standard reference sound power = 10-12 Watt
If the source is placed on hard reflective ground, the radiation energy is transmitted into a hemisphere instead of a sphere. For this situation, the directivity factor D can be used in equation (7) to account for the fact that the sound pressure will be higher.
The equation providing an estimate of sound power level will thus be given by
⎟⎟⎠
Where the directivity factor D for different source locations will be as shown in the table below: (Bies, D.A., Hansen, C.H., 2003)
Absorption Coefficient (α)
Average of absorption coefficient α
∑
i : absorption coefficient of the i th surface
Room constant (R)
The room constant can be expressed as
α
The sound pressure level can be determined by
⎟
Where D is directivity factor
ANALYSIS
A. Calculation of sound Power level total every engine (Lw total)
According to the equation 3, Lw total every machine can be summaries in this table bellow
Source Location Directivity Factor (D)
Free Field (suspended away from surfaces)
1
On a flat plane (hard reflective surface)
2
Junction of 2 planes (hard reflective surfaces)
4
Junction of 3 planes (hard reflective surfaces)
8
B. Sketch the Building
Dimensions of the building are: Length : 40 m
Width : 35 m Height : 10 m
From the data above, calculation about area are: Floor area : (40 x 35) m = 1400 m2 Wall area : (2 x 40 x10) + (2 x 35 x 10) m = 1500 m2
Ceiling area : (40 x 35) m = 1400 m2 Total area : (1400 + 1500 + 1400) m2 = 4300 m2
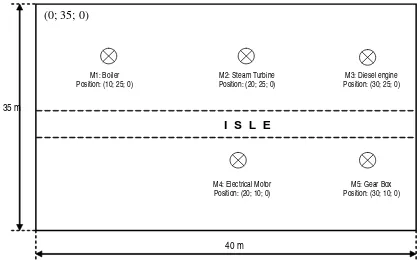
Considering the values of sound pressure level every engine, position of every engine can be placed in the building.
The highest sound pressure level (diesel engine) is placed far from central axis (0,0,0) because to reduce more noise, follow by gear box position, steam turbine, boiler and electrical motor closer with central axis.
The sketch of the building is described in the figure below:
Table 2: Lw total every engine
40 m 35 m
(0; 35; 0)
I S L E
M3: Diesel engine Position: (30; 25; 0) M1: Boiler
Position: (10; 25; 0)
M4: Electrical Motor Position: (20; 10; 0)
M5: Gear Box Position: (30; 10; 0) M2: Steam Turbine
Position: (20; 25; 0)
Figure 1: Sketch of The Building
Octave band (Hz) 31.5 63 125 250 500 1000 2000 4000 8000 Lw total (dB)
4MW Elec. Motor (dB) 88 90 92 93 93 93 98 88 81 99.07
Gearbox (dB) 95 98 105 105 101 108 100 95 92 109.07
Boiler (dB) 85 95 95 98 98 96 96 92 88 101.58
Steam Turbine (dB) 100 103 104 101 100 100 98 97 93 106.95
C. Different acoustic treatment for floor, wall and ceiling (Irwin JD, Graf ER 1979)
Table.3. Sabine absorption coefficients for chosen material
D. Calculation of absorption coefficient (a) and Room constant (R)
According to the equation 10 and 11 above to fine values and R, every frequency octave band can be summaries in this table below:
Table.4. Sabine absorption coefficients for chosen material
E. Calculation of sound pressure level in the building
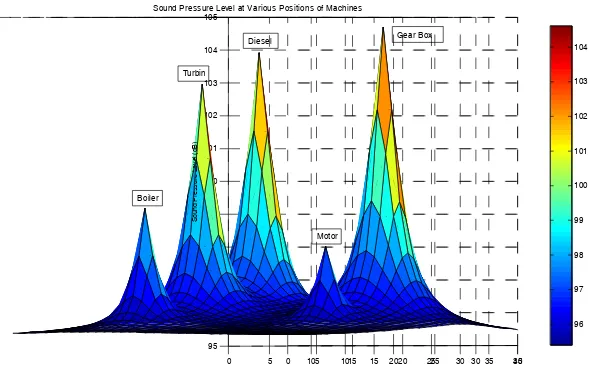
To obtain the values of sound pressure level in the building, according equation 12 above, computer program is used to determine values sound pressure level every location in the building.
With MATLAB program, sound pressure level every machine in any positions can be presented in this graph below:
Octave Band Centre Frequency (Hz) Surface Material
31.5 63 125 250 500 1000 2000 4000 8000
Floor Concrete or Terrazzo 0.01 0.01 0.01 0.01 0.01 0.02 0.02 0.02 0.02
Wall Brick, unglazed, painted 0.01 0.01 0.01 0.01 0.02 0.02 0.02 0.02 0.03
ceiling Mineral fiber 0.18 0.18 0.18 0.45 0.84 0,97 0.87 0.87 0.87
Octave Band Centre Frequency (Hz)
surface Material Area
(m2)
31.5 63 125 250 500 1000 2000 4000 8000
Floor Concrete or
Terrazzo 1400 0.01 0.01 0.01 0.01 0.01 0.02 0.02 0.02 0.02 Wall
Brick, unglazed,
painted 1500 0.01 0.01 0.01 0.01 0.02 0.02 0.02 0.02 0.03 ceiling Mineral fiber 1400 0.18 0.18 0.18 0.45 0.84 0.97 0.87 0.87 0.87
Total area 4300
absorption coefficient α 0.332 0.332 0.332 0.332 0.336 0.339 0.339 0.339 0.343
Room constant R 2140.7 2140.7 2140.7 2141.3 2176.0 2208.2 2208.0 2208.0 2242.5
0 5 10 15 20 25 30 35 40
Sound Pressure Level at Various Positions of Machines
S
DISCUSION
A. General Summaries
Table 2 shown that the highest sound power level total every machine occur in the diesel engine (111.06 dB), followed by gear box (109.07 dB), steam turbine (106.95 dB), boiler (101.58) and the lowest is 4MW electric motor (99.07 dB).
From the analysis above, that are can used to design layout of every machine in the room building, for example the engine with the highest sound power level we are placed most far from central axis (0; 0; 0) and the engine with the lowest sound power level is placed nearest with central axis in order to reduce more noise from this area that are close with central axis because for example this area can be used to office of head department or office of operators.
B. Sound Pressure Level Total in the building
Using MATLAB computer program to analysis sound pressure level total the building,
the highest sound pressure level total (104.7 dB) occur in position length 31 m and width 11 m, which this position where the gear box is placed. The lowest sound pressure level total in this building is around area that is close with central axis, that the sound pressure level approximately 95.34 dB.
Moreover, sound pressure level in the isle area is about 95.37 dB (near the axis area) to 97.12 dB (close with diesel engine position).
CONCLUSION
According to this analysis above, as can be seen in figure 2, with the dimension of building (40 m length, 35 m width and 10 m height), the sound pressure level total that are occur in the building when all machine is operated, in the range 95.52 dB to 104.7 dB.
The sound pressure level totals that occur in the room of building are influences from: • Dimension of room building
• Sound pressure level that are produce by machine in that building
• Number of machine • Position of every machine • Material to build this building
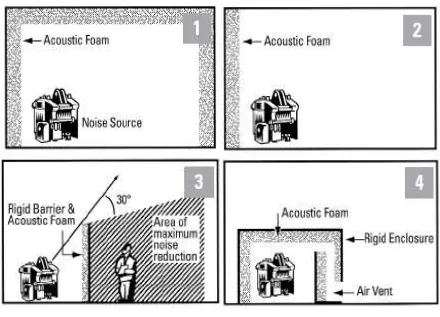
To quite a noise area in the building, design of building is very important, for example can de illustrated in figure 3 below:
As can be seen in the table 5, that the sound pressure level within the room range
between 95.52 to 104.7 dB, give information that the noise exposure at the room exceeds the exposure standard. While the exposure standard is defined as the 8 hour equivalent continuous sound pressure level of 85 dB (A) measured in A-weighted decibels referenced to 20 micro Pascals at an employee’s ear position. So, to protect operator from hearing damage, hearing protector must be used. (Sharma O, Mohanan V and Singh M 1979)
Table 5: Types of Approved Hearing Protection.
REFERENCES
Bies, D.A., Hansen, C.H., 2003, Engineering Noise Control: Theory and Practice, 3rd ed., E & FN Spon, New York, USA
Howard I, Engineering Noise Control: lecture note, Department of Mechanical Engineering Curtin University of Technology
Irwin JD, Graf ER 1979, Industrial Noise and Vibration Control, Prentice Hall Inc, New Jersey.
NN, 2003, Guidelines of noise barrier, Barriers Environmental Protection Department Highways Department Government of the Hong Kong, Hong Kong.
NN,2006, Industrial noise control that works: sound solutions for a noisy world retrieved from www.illbruck sonex.com