2
BORANG PENGESAHAN STATUS TESIS*
LAND SURFACE TEMPERATURE DETERMINATION FOR SELANGOR AREA
SESI PENGAJIAN : _ _ _ _
UMMI KALSOM BINTI MOHAMAD HASHIM
mengaku membenarkan tesis Projek Sarjana Muda ini disimpan di Perpustakaan Fakulti Teknologi Maklumat dan Komunikasi dengan syarat-syarat kegunaan seperti berikut:
1. Tesis dan projekadalah hakmilik Universiti Teknikal Malaysia Melaka.
2. Perpustakaan Fakulti Teknologi Maklumat dan Komunikasi dibenarkan membuat salinan untuk tujuan pengajian sahaja.
3. Perpustakaan Fakulti Teknologi Maklumat dan Komunikasi dibenarkan membuat salinan tesis ini sebagai bahan pertukaran antara institusi pengajian tinggi.
4. ** Sila tandakan (/)
(Mengandungi maklumat yang berdarjah keselamatan atau kepentingan Malaysia seperti yang termaktub di dalam AKTA RAHSIA RASMI 1972)
(Mengandungi maklumat TERHAD yang telah ditentukan oleh organisasi/badan di mana penyelidikan dijalankan)
TIDAK TERHAD
(TANDATANGAN PENULIS) (TANDATANGAN PENYELIA)
Alamat tetap: KG.PULAU KABONG DR. ASMALA BIN AHMAD
32700, BERUAS Nama Penyelia
PERAK
Tarikh: Tarikh:
CATATAN: * Tesis dimaksudkan sebagai Laporan Projek Sarjana Muda (PSM). ** Jika tesis ini SULIT atau atau TERHAD, sila lampirkan surat
daripada pihak berkuasa. 2011 / 2012 JUDUL :
Saya
SULIT
UMMI KALSOM BINTI MOHAMAD HASHIM
LAND SURFACE TEMPERATURE DETERMINATION FOR SELANGOR AREA
UMMI KALSOM BINTI MOHAMAD HASHIM
This report is submitted in partial fulfillment of the requirements for the Bachelor of Computer Science (Artificial Intelligence)
FACULTY OF INFORMATION AND COMMUNICATION TECHNOLOGY UNIVERSITI TEKNIKAL MALAYSIA MELAKA
DECLARATION
I hereby declare that this project report entitled
LAND SURFACE TEMPERATURE DETERMINATION FOR SELANGOR AREA
is written by me and is my own effort and that no part has been plagiarized without citations.
STUDENT : ____________________________________Date: _________
UMMI KALSOM BINTI MOHAMAD HASHIM
SUPERVISOR : ____________________________________Date: _________
iii
DEDICATION
ACKNOWLEDGEMENTS
v
ABSTRACT
ABSTRAK
vii
TABLE OF CONTENTS
DECLARATION ... ii
DEDICATION ... iii
ACKNOWLEDGEMENTS ... iv
ABSTRACT... v
ABSTRAK ... vi
TABLE OF CONTENTS ... vii-x LIST OF TABLES ... xi-xii LIST OF FIGURES ... xiii-xiv LIST OF ABBREVIATIONS ... xv
CHAPTER 1: INTRODUCTION ... 1
1.1 Project Background ... 1-2 1.2 Problem Statements ... 2-3 1.3 Objectives ... 3
1.4 Scopes ... 3
1.4.1 Software Scope ... 4
1.4.2 Area of Study Scope ... 5-7 1.4.3 User Scope ... 8
1.5 Project Significance ... 9
1.6 Expected Output ... 9
1.7 Conclusion ... 10
CHAPTER 2: LITERATURE REVIEW AND PROJECT METHODOLOGY ... 11
2.3 Supervised Method ... 14
2.3.1 Maximum Likelihood ... 14-15 2.3.2 Neural Network ... 16-17 2.4 Project Methodology ... 17-19 2.5 Project Schedule and Milestone... 20
2.6 Conclusion ... 21
CHAPTER 3: ANALYSIS ... 22
3.1 Introduction... 22-23 3.2 Problem Analysis ... 23
3.3 Requirement Analysis... 24
3.3.1 Data Requirement ... 24-30 3.3.2 Software and Hardware Requirement ... 30-34 3.3.3 Ancillary Data Requirement ... 34
3.4 Conclusion ... 35
CHAPTER 4: DESIGN... 36
4.1 Introduction... 36
4.2 LST process ... 37-38 4.2.1 Input ... 39
4.2.2 Geometric correction... 40
4.2.3 Subset/Resize ... 40
4.2.4 Ocean Masking ... 40-41 4.2.5 Cloud Masking ... 41
4.2.6 Classification using Maximum Likelihood and Neural Network ... 41-44 4.2.7 LST modeling ... 44-45 4.2.8 LST derivation ... 45
ix
4.2.11 Accuracy assessment/Testing ... 46
4.3 Conclusion ... 47
CHAPTER 5: IMPLEMENTATION... 48
5.1 Introduction... 48
5.2 Data preprocessing... 49
5.2.1 Input data process ... 49-51 5.2.2 Geometric correction process... 52-55 5.2.3 Subset/resize process ... 55-60 5.2.4 Ocean masking process ... 61-62 5.2.5 Cloud masking process ... 62-64 5.3 Classification using Maximum Likelihood and Neural Network ... 64-66 5.4 LST modeling process ... 66-67 5.4.1 Conversion from Digital Number to Radiance ... 67
5.4.2 Conversion from Radiance to Brightness Temperature ... 68
5.5 LST derivation ... 69
5.6 LST segmentation ... 70
5.7 Output ... 71-78 5.8 Accuracy Assessment/Testing ... 79
5.9 Conclusion ... 79
CHAPTER 6: TESTING... 80
6.1 Introduction... 80
6.2 Maximum Likelihood Classification ... 81 6.3 Neural Network Classification ... 81-82 6.4 Comparison Between Region of Interest (ROI) and Maximum Likelihood
Classification... 83-89 6.5 Comparison Between Region of Interest(ROI) and Neural Network
6.6 Comparison Between Maximum Likelihood and Neural Network
Classification... 95-99 6.7 Comparison Between Maximum Likelihood Map and Temperature Map. 100-101 6.8 Conclusion ... 101-102 CHAPTER 7: APPLICATION OF LAND SURFACE TEMPERATURE
DETERMINATION USING ANDROID ... 103
7.1 Introduction... 103
7.2 Requirement... 104
7.2.1 Sofware ... 104
7.2.2 Hardware ... 104-105 7.3 Graphical User Interface ... 106-109 7.4 Codes ... 110
7.4.1 XML Codes ... 110
7.4.2 Java Codes ... 111-113 7.5 Conclusion ... 114
CHAPTER 8: CONCLUSION ... 115
8.1 Introduction... 115
8.2 Strengths ... 116
8.3 Weakness ... 117
xi
LIST OF TABLES
TABLE TITLE PAGE
Table 1.0 List of software required 4
Spectral range of bands and spatial resolution for the
Table 1.1 Landsat 5 TM sensor 6
Table 2.0 LandSat TM spectral consideration 11
Table 2.1 FYP schedule and milestone 19
Spectral range of bands and spatial resolution for the
Table 3.0 Landsat 5 TM sensor 26
Table 3.1 Envi 4.5 Specifications 29
Table 3.2 Mathlab R2010a Specifications 31
Table 3.3 List of Hardware Requirement 31
Table 5.0 Sources of Geometric Error 49
Table 5.1 Image value before and after subset 55
Table 5.2 List of pixel changes at different temperatures 71
Table 5.3 Total of pixel at different temperatures 71
Confusion Matrix in Pixels; Region of Interest vs
Table 6.0 Maximum Likelihood 79
Confusion Matrix in Percent; Region of Interest vs
Table 6.1 Maximum Likelihood 79
Confusion Matrix in Commission and Ommission; Region
Table 6.2 of Interest vs Maximum Likelihood 80
Confusion Matrix in Prod. Acc and User Acc; Region of
Table 6.3 Interest vs Maximum Likelihood 80
Confusion Matrix in Pixels; Region of Interest vs Neural
Table 6.4 Network 83
Confusion Matrix in Percent; Region of Interest vs Neural
Table 6.5 Network 83
Confusion Matrix in Commission and Ommission; Region
Confusion Matrix in Prod. Acc and User Acc; Region of
Table 6.7 Interest vs Neural Network 84
Confusion Matrix in Pixels; Maximum Likelihood vs
Table 6.8 Neural Network 87
Confusion Matrix in Percent; Maximum Likelihood vs
Table 6.9 Neural Network 87
Confusion Matrix in Commission and Ommission;
Table 6.11 Maximum Likelihood vs Neural Network 88
Confusion Matrix in Prod. Acc and User Acc; Maximum
Table 6.12 Likelihood vs Neural Network 88
Table 7.0 Specification of laptop 94
Table 7.1 Specifications of tablet 95
xiii
LIST OF FIGURES
FIGURE TITLE PAGE
Figure 1.0 Focus Area of Study 6
Figure 2.0 System Development Cycle of Waterfall Model 17
Figure 3.0 Process capture satellite image 24
Figure 3.1 Envi Interface 29
Figure 4.0 LST process 35
Classification process using maximum likelihood
Figure 4.1 method 40
Overview of how remotely sensed data are turned
Figure 5.0 into useful information 47
Figure 5.1 Spatial Subset (Subsetting by Images) 52
Figure 5.2 (a) Image before subset, (b) Image after subset 52 Histogram of the difference image value: (a)Image
Figure 5.3 before subset, (b)Image after subset 55
Ocean masking: (a)Masking into 0 and 1 data value,
Figure 5.4 (b) Masking into 0 data value only 56
Cloud masking: (a) Image before mask, (b) Image
Figure 5.5 after mask 58
Figure 5.6 Classification using Maximum Likelihood method 60
Figure 5.7 Temperature value of land cover histogram 62
Temperature value range for different land cover
Figure 5.8 type 64
Comparison Landcover Classification Using (a)
Figure 6.0 ROI and (b) Maximum Likelihood 76
Regions of interest (ROIs) Using by Maximum
Figure 6.1 likelihood and Neural Network 77
Comparison Landcover Classification Using (a)
Figure 6.2 ROI and (b) Neural Network 82
Comparison Landcover Classification Using (a)
Figure 6.3 Maximum Likelihood and (b) Neural Network 86
Comparison Landcover Classification Using (a)
Figure 6.4 Maximum Likelihood and (b) Neural Network 90
Determination Application
Second Page of Land Surface Temperature
Figure 7.1 Determination Application 96
Third Page of Land Surface Temperature
Figure 7.2 Determination Application 97
Fourth Page of Land Surface Temperature
xv
LIST OF ABBREVIATIONS
LST - Land-surface temperature
TM - Thematic Mapper
OS - Operating Windows
UHI - Urban Heat Island
IFOV - Instantaneous Field Of View
ML - Maximum Likelihood
ENVI - ENvironment for Visualizing Images
MATLAB - Matrix Laboratory
ROI - Regions of Interest
ARSM - Malaysian Remote Sensing Agency
MACRES - Malaysian Centre for Remote Sensing
MOSTI - Ministry of Science, Technology and
Innovation
TDRS - Tracking Data and Relay Satellites
GCP - Ground Control Point
IR - Infra-Red
PSM2 - Projek Sarjana Muda 2
CHAPTER 1
INTRODUCTION
1.1 Project Background
2
This study used data recorded from a remote sensing satellite. Landsat platform use TM (Thematic Mapper) sensor. It is a multispectral scanning Earth surface. Images captured from such sensor usually has sharper spectral separation and greater image resolution. Other than that, it also has greater geometric accuracy. The TM data are scanned simultaneously by the TM sensor that is equipped with different spectral bands. Before the advent of this technology, land mapping information is done by using a plane that would cost. By using this technology mapping method can be done in a better way and save costs. Nature of technology requires data from satellite images to identify and use the land surface through the spectral response.
1.2 Problem Statements
The study of LST mapping using remote sensing technology offers a new alternative over the convensional methods practiced elsewhere. This technology has not been widely used in Malaysia as compared to western countries.
technique used does not give a good result because they could not prevent the images from environmental interference such as noise. Moreover, ground truth information of earth surfaces is hard to obtain due to the factors such as time, logistic and cost. The aim of the study is to derive derive LST information using remote sensing technology.
1.3 Objectives
In order to achieve aim of the study, the specific objectives are:
1) To design a method to derive LST information.
2) To develop LST information.
3) To assess the accuracy of the LST map.
1.4 Scopes
4
1.4.1 Software Scope
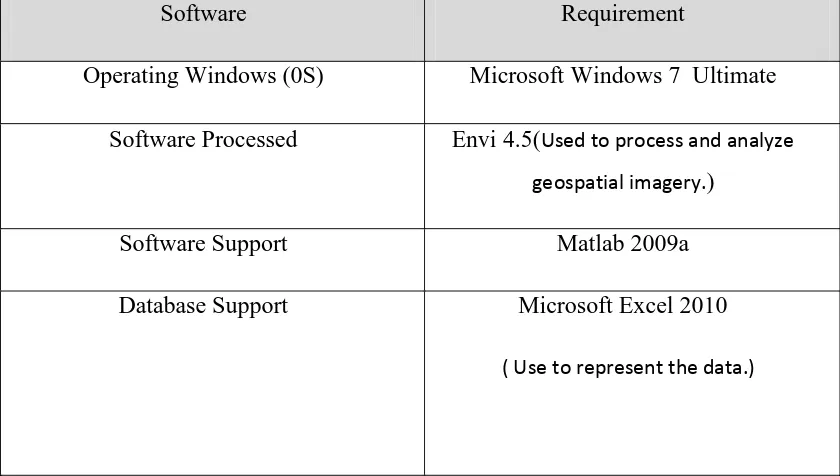
All of the software in Table 1.0 is required in LST mapping process from start to end of the process of mapping.
Software Requirement
Operating Windows (0S) Microsoft Windows 7 Ultimate
Software Processed Envi 4.5(Used to process and analyze
geospatial imagery.)
Software Support Matlab 2009a
Database Support Microsoft Excel 2010
( Use to represent the data.)
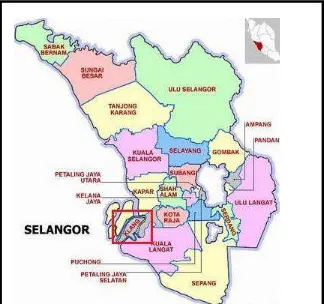
1.4.2 Area of Study Scope
Klang was chosen as the focus area of the study. Klang, Selangor is located at latitude: 3.043061 and Longitude: 101.440657, 573KM2). Klang is the royal town and former capital of Selangor. The Klang River was separates Klang town into north and south sections. Klang is also the main port of Malaysia. On the east side, Klang borders with Shah Alam, on the north side borders with Kuala Selangor, on the west side borders with the Straits of Melaka and borders with Banting (Kuala Langat) to the south. Klang is booming and becoming the focus cityrapid development and high growth of urbanisation and industrialisation.
If unplanned development is practiced in Klang, various problems tend to exist. These urban transformations have altered the physical and natural environment. The urban surfaces absorb heat and will increase the temperature. This leads to Urban Heat Island (UHI) phenomenon. Therefore, a systematic urban planning is needed in order to avoid this phenomenon to occur. By using an appropriate Land Surface Temperature Determination the urban areas can be planned and developed systematically. Figure 1.0 show the location of Klang as the focus area of study.
6
resolution, sharper spectral separation, improved geometric fidelity and greater radiometric accuracy and resolution.
TM data are processed in seven spectral bands simultaneously (Table 1.1). Band 6 senses thermal (heat) infrared radiation. Landsat can get night scenes in band 6. A TM scene has an Instantaneous Field Of View (IFOV) that capable to view image of 30m x 30m in bands 1-5 and 7 while band 6 has an IFOV of 120m x 120m on the ground.
Landsat 5 (TM sensor) Wavelength(micrometers) Resolution (meters)
Band 1 0.45 - 0.52 30
Band 2 0.52 - 0.60 30
Band 3 0.63 - 0.69 30
Band 4 0.76 - 0.90 30
Band 5 1.55 - 1.75 30
Band 6 10.40 - 12.50 120
Band 7 2.08 - 2.35 30