ESTIMATION OF LAND SURFACE TEMPERATURE USING
LANDSAT TM THERMAL INFRARED IN SELANGOR-NEGERI
SEMBILAN
Asmala Ahmad
1, Noorazuan Md Hashim
2& Zolkepli Buang
31Jabatan Sains & Matematik Pusat Perkhidmatan Akademik
Kolej Universiti Teknikal Kebangsaan Malaysia (KUTKM)
2Pusat Pengajian Sosial, Pembangunan & Persekitaran Universiti Kebangsaan Malaysia (UKM), Bangi
3Pusat Kecemerlangan Pengajaran dan Pembelajaran Kolej Universiti Teknikal Kebangsaan Malaysia (KUTKM)
Abstract
A full-scene of Landsat TM acquired on April 17, 1988 (path 127/row58) was used in this study. This scene covers the areas of Selangor and north part of Negeri Sembilan in Peninsular Malaysia. The main objective of this study is to evaluate the use of remote sensed information, especially thermal band 6 to gain land surface temperature (LST) using thermal band of Landsat images. The result will be compared with urban and non-urban surfaces by using normalised difference vegetation index (NDVI) and compare relationships between them. The initial result showed that the correlation between the LST and the NDVI over ten locations in the study area is quite significant. The derivation of LST map using remote sensing technique in this study is useful in providing information for analysing geophysical parameters over Selangor-Negeri Sembilan area, especially dealing with the urban heat island phenomenon.
Key Words
Landsat, Thermal band, LST, Emmisivity, NDVI
1
Introduction
Land-surface temperature (LST) can be defined as the thermal emission from the landscape "surface", including the top of the canopy for vegetated surfaces as well as other surfaces (such as bare soils).
LST is an important parameter in the field of atmospheric sciences as it combines the result of all surface-atmosphere interaction and energy fluxes between the ground and the atmosphere and is, therefore, a good indicator of the energy balance at the Earth’s surface (Wan and Snyder, 1996). LST controls the surface heat and water exchange with atmosphere. Estimation of LST from satellites infrared radiometers has been proven useful. Most studies have focused on the use of polar orbiting satellite systems because of their high spatial resolution (Sun et al., 2004).
Figure 1. Area under study (shaded)
2
Data
This study used data recorded from a remote sensing satellite that was developed by NASA of USA - Landsat 5. Landsat 5 platform carries along the so called TM sensor, which is an advanced,
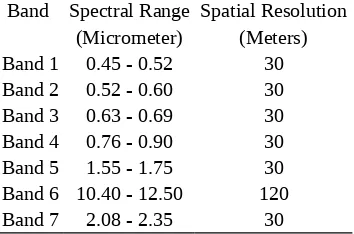
[image:2.595.89.266.379.496.2]multispectral scanning, Earth resources instrument designed to achieve higher image resolution, sharper spectral separation, improved geometric fidelity, and greater radiometric accuracy and resolution. The TM data are scanned simultaneously in seven spectral bands. Band 6 scans thermal (heat) infrared radiation. For this study, the data was recorded on April 17, 1988 for path 127/row58 (Figure 1). Spectral range of the all seven bands is shown in Table 1.
Table 1. Spectral range of bands and spatial resolution for the Landsat 5 TM sensor
Band Spectral Range Spatial Resolution (Micrometer) (Meters) Band 1 0.45 - 0.52 30 Band 2 0.52 - 0.60 30 Band 3 0.63 - 0.69 30 Band 4 0.76 - 0.90 30 Band 5 1.55 - 1.75 30 Band 6 10.40 - 12.50 120 Band 7 2.08 - 2.35 30
2
Methodology
In order to estimate LST from Landsat data, the methodology in this study will be divided into four phase: (1) Data Calibration, (2) Conversion from Radiance to Brightness Temperature, (3) LST retrieval and NDVI retrieval.
2.1 Conversion from Digital Number to Radiance
All TM bands are quantized as 8 bit data thus, all information is stored in digital number (DN) with range between 0 to 255. The data was converted to radiance using a linear equation as shown below:
CV
B
G
CV
R
DN
(1)Where:
CVR is the cell value as radiance CVDN is the cell value digital number
G is the gain (0.005632156 for TM6 and 0.003705882 for ETM+6) B is the offset (0.1238 for TM6 and 0.3200 for ETM 6)
2.2 Conversion from Radiance to Brightness Temperature
By applying the inverse of the Planck function, thermal bands radiance values was converted to brightness temperature value.
6
100 102 104
6 4 4 2 2 0
0 0 0
0 0 0 0 0 ROW 56 ROW 57 ROW 58 ROW 59 1 04 102
1000 0 0
6
100 102 104
6 4 4 2 2 0
0 0 0
0 0 0 0 0 ROW 56 ROW 57 ROW 58 ROW 59 1 04 102
1
CV
K
ln
K
T
R 1 2 (2) Where:T is degrees Kelvin
CVR is the cell value as radiance
K1 is calibration constant 1 (607.76 for TM) and (666.09 for ETM+) K2 is calibration constant 2 (1260.56 for TM) and (1282.71 for ETM+) 2.3 LST Retrieval
LST was derived from TM6 using model developed by Qin et al. (2001) which uses the
atmospheric water vapor and the near-surface air temperature on the mono-window algorithm for retrieving the LST. The surface emmissivity was fixed at 0.98 (Hadi et al., 1997). The atmospheric transmissivity was calculated using LOWTRAN 7 developed by Kneizys et al. (1989).
sensor a
a a1 C D b1 C D C DT DT
C 1
T (3)
Where
C = es, where e is the land surface emissivity (e = 0.98 for Malaysia), s = the total atmospheric transmissivity (s = 0.021 from LOWTRAN 7) D=(1 _s)[1+(1 _e)s],
a = -67.355351, b = 0.458606, and
Tsensor = the sensor brightness temperature,
Ta represents the mean atmospheric temperature for Tropical Climate given by
Ta=17.9769+0.91715•T0 (4)
T0 is near surface air temperature (300.45 K for Malaysia)
2.4 NDVI Retrieval
A vegetative index is a value that is derived from sets of remotely-sensed data that is used to quantify the vegetative cover on the Earth's surface. The NDVI is calculated as a ratio between measured reflectivity in the red and near infrared portions of the electromagnetic spectrum. These two spectral bands are chosen because they are most affected by the absorption of chlorophyll in leafy green vegetation and by the density of green vegetation on the surface. Also, in red and near-infrared bands, the contrast between vegetation and soil is at a maximum.
The Thematic Mapper bands 3 and 4 provide red and near-infrared measurements respectively and therefore can be used to generate NDVI data sets with the following formula:
BandBand44 BandBand33
NDVI
(4)
3
Result
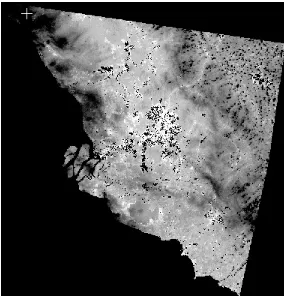
Figure 2. Combination of TM band 3,2,1 in red, green, and blue channel
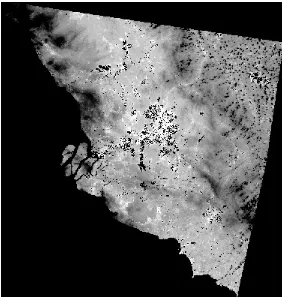
[image:4.595.155.442.408.704.2]Figure 4. TM band 6 in radiance
LST (Kelvin) 40-50 51-10 101-200 201-300 301-400 401-500 Clouds, water
Figure 5. Map of LST
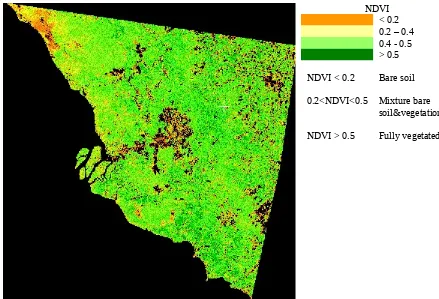
NDVI < 0.2 0.2 – 0.4 0.4 - 0.5 > 0.5
NDVI < 0.2
0.2<NDVI<0.5
NDVI > 0.5
Bare soil
Mixture bare soil&vegetation
Fully vegetated
[image:6.595.87.526.404.703.2]4
Relationship Between LST and NDVI
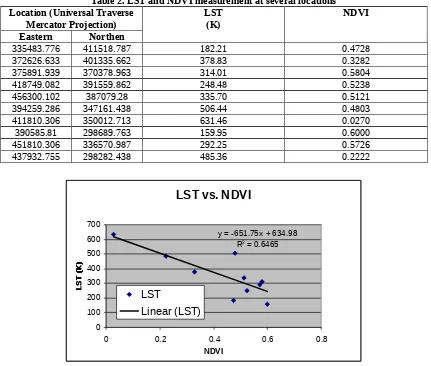
[image:7.595.84.515.128.494.2]In order to find the relation ship between LST and NDVI, 10 locations in the in the study area were determined (Table 2). A graph of LST vs. NDVI was plotted as shown in Figure 7.
Table 2. LST and NDVI measurement at several locations Location (Universal Traverse
Mercator Projection) LST(K) NDVI
Eastern Northen
335483.776 411518.787 182.21 0.4728
372626.633 401335.662 378.83 0.3282
375891.939 370378.963 314.01 0.5804
418749.082 391559.862 248.48 0.5238
456300.102 387079.28 335.70 0.5121
394259.286 347161.438 506.44 0.4803
411810.306 350012.713 631.46 0.0270
390585.81 298689.763 159.95 0.6000
451810.306 336570.987 292.25 0.5726
437932.755 298282.438 485.36 0.2222
LST vs. NDVI
y = -651.75x + 634.98
R2 = 0.6465
0 100 200 300 400 500 600 700
0 0.2 0.4 0.6 0.8
NDVI
LST
Linear (LST)
Figure 7. Relationship between LST and NDVI
5
Conclusion
The result shows that estimation of land surface temperature using thermal band 6 of Landsat 5 satellite gives a promising result. Relationship between LST and NDVI based on 10 locations can be shown as linear model y = -651.75x + 634.98 with R2 = 0.6465. Future study will include comparison between satellite measurement and insitu readings using conventional instruments.
References
[1]. Hadi Batatia and Nabil Bessaih (1997). Satellite Land Surface Temperature for Sarawak Area. Proceedings of the 1997 Asian Conference on Remote sensing. Global Environment Session. [2]. Kneizys, F.X., Shettle, E.P., Gallery, W.O., Chetwynd, J.H., Abren, L.W., Selby, J.E.A.,
Clough, S.A. and Fern, R.M. (1989). Atmospheric Transmittance/Radiance: Computer Code
LOWTRAN 7. Hanscom Air Base, Massachusetts : U.S. Air Force Geophysical Laboratory.
[3]. Qin, Z., Karnieli, A., & Berliner, P. (2001). A mono-window algorithm for retrieving land surface temperature from Landsat TM data and its application to the Israel–Egypt border region. International Journal of Remote Sensing. 22(18), 3719–3746.
[4]. Sun, D. and Pinker, T. (2004). Case study of Soil Moisture effect on Land Surface
Temperature Retrieval. IEEE Geoscience And Remote Sensing Letters. Vol. 1. No. 2 : 127 – 130.