THESIS
ALPHONCE JOSEPH OBADO
GRADUATE SCHOOL
BOGOR AGRICULTURAL UNIVERSITY
BOGOR
I do hereby declare that the thesis entitled “Competitiveness of
Indonesian Crude Palm Oil and the Effect of Export Tax on its Performance
in the World Market” ismy original work produced through the guidance of my academic advisors and that to the best of my knowledge it has not been presented for the award of any degree in any University. All of the incorporated material originated from other published as well unpublished papers and are stated clearly in the text as well as in the references.
Bogor, August 2008
Alphonce Joseph Obado. 2008. Competitiveness of Indonesian Crude Palm Oil and the Effect of Export Tax on its Performance in the World Market (Yusman Syaukat, Chairman and Hermanto Siregar, Member of Advisory Committee)
The objectives of this research include: (1) to find out the export competitiveness of the Indonesian CPO in the world market; (2) to assess the impacts of CPO export tax on Indonesian CPO industry. In addition it will assess the effect of exchange rate on Indonesian CPO industry; and (3) to propose strategies that can improve the competitiveness of Indonesian CPO in the world market.
Indonesia was found to be most competitive in the CPO export market than any other country, especially in India and China but it faces strong competition from Malaysia. Both Indonesia and Malaysia have comparative advantage of exporting CPO to China and India. Export tax was negatively related to mature area of oil palm plantation, production, export, and domestic price of CPO and positively related to CPO consumption and stock. The export tax policy benefitted the domestic consumers of CPO. Clearly, the export tax policy reduces competitiveness of the Indonesian palm oil industry and also hurts producers of CPO. The foreign exchange rate effect was discovered to be positively related to domestic CPO price, export and consumption but negatively related to production and stock. Alternative strategies to be utilized include: (1) improvement in the promotion, negotiation and enhancement of bilateral relationships between Indonesia and China to improve infrastructure; (2) Indonesia must cooperate and work closely with Malaysia to enable Indonesia to learn from Malaysia how to efficiently produce CPO; (3) development of palm oil projects that can be integrated with other industrial production programs through the revitalization of plantation systems, rejuvenation and rehabilitation of existing farm product; and (4) creation of a conducive atmosphere for investment, permit ownership of plantations by individuals, reducing import cost on farm machines and implements, provide incentives on imports of agricultural machines to improve the competitiveness of Indonesian CPO in the world market. It is recommended that export tax formulation with well considered and sound justifications is needed and from the study, 11.13 percent export tax on CPO was recommended.
Agricultural products have a very important role to perform in the development of the Indonesian national economy. These commodities and specifically crude palm oil, has contributed immensely in the Gross Domestic Product of Indonesia, led to growth in production and areal development, created forms of employment for more than 3.5 million people, increased international and national trade, improved living standards for the local people, and improved financial status of the local people. Crude palm oil is considered a strategic commodity in the Indonesian economy as a source of raw material for the most commonly used cooking oil consumed in Indonesia and export earnings through foreign exchange inflows.
The crude palm oil industry in Indonesia has evolved from government sponsorship and market interventions to a private sector initiative in response to international price signals and market growth. Export growth can be decomposed into three factors: world demand factor, product and market effects and competitiveness effects. The world demand factor reflects growth in exports that can be attributed to rising international demand, i.e. the stronger global import demand, the stronger the country’s export growth. Considering the importance of CPO, Indonesia has launched policies to optimize the development of the industry, such as supply stabilization. The most important policies have been on export tax, first implemented in August 1994 to stabilize and secure the domestic supply and price.
This study has three main objectives that include the following; (1) to find out the export competitiveness of the Indonesian CPO in the world market; (2) to assess the impacts of CPO export tax on Indonesian CPO industry; in addition it will assess the effect of exchange rate on Indonesian CPO industry; and (3) to propose strategies that can improve the competitiveness of Indonesian CPO in the world market.
The research found out that India and China are the most important markets for Indonesian CPO. Considering the strength of CPO export into the India CPO market, Indonesia has dominated the market over the years. It was discovered during the study that Indonesia is highly competitive in the India CPO export market than any other country with competitiveness index value of greater than one. With respect to the China CPO export market, Indonesia is still competitive as its market share continued to increase.
include the demand condition of Indonesian CPO that has been on the rise internationally due to steady rise in population, new farming technologies that are used by Indonesian palm oil producers, the diversification of crude palm oil production and the escalating price of CPO in the world market.
Producers, mainly smallholders, have suffered a great deal due to the export tax policy. As the domestic price of CPO is depressed by this policy, the farm gate price of the farmers’ produce declines substantially. The export tax policy reduces the competitiveness of the Indonesian palm oil industry and also hurts producers of CPO (some of them small-holder farmers) due to the lower price of CPO relative to the world market price. The export tax policy benefitted the domestic consumers of CPO as it controls domestic price CPO.
Alternative strategies that can be utilized to improve the competitiveness of Indonesian CPO in the world market include: (1) improvement in the promotion, negotiation and enhancement of bilateral relationships between Indonesia and China and India to contribute towards the improvement of the infrastructure of the CPO industry in Indonesia; (2) Indonesia must cooperate and work closely with Malaysia to learn from Malaysia how to efficiently produce CPO; (3) development of an integrated palm oil sector with other industrial production programs through the revitalization of plantation systems, rejuvenation and rehabilitation of existing farm products; and (4) creation of a conducive atmosphere for investment in the agricultural sector by guaranteeing security, permit ownership of plantations by individuals, reducing import cost on farm machines and implements that are used in palm oil industry, provide incentives on imports of agricultural machines and reduce export tax by deregulating export tax and retribution that are not an incentive to or that negatively affect the competitiveness of CPO from Indonesia in the world market.
Copyright © 2008, by Bogor Agricultural University All rights reserved
1. No part or all of this thesis may be excerpted without inclusion or mentioning the sources
a. Excerption only for research and education use, writing for scientific papers, reporting, critical writing or reviewing of a problem
b. Excerption does not inflict a financial loss in the proper interest of Bogor Agricultural University
Alphonce Joseph Obado
Thesis
Submitted to the Graduate School in Partial Fulfillment of Master of Science
Degree in Agricultural Economics
GRADUATE SCHOOL
Name
:
Alphonce Joseph ObadoRegistration Number
:
H. 353078221Study Program
:
Agricultural EconomicsApproved
1. Advisory Committee
Dr.Ir. Yusman Syaukat, MEc. Prof.Dr.Ir. Hermanto Siregar, MEc Chairman Member
Agreed
2. Coordinator of Program 3. Dean of Graduate School Agricultural Economics
Prof.Dr.Ir. Bonar M. Sinaga, MA Prof.Dr.Ir.Khairil A. Notodiputro, MS
I would like to register my sincere gratitude to all those who may have assisted me in this work in one way or another either with resources or any other form. I am highly indebted to register my special thanks and dedication to my supervisors Dr. Yusman Syaukat who was the chairman of the advisory committee and Prof. Hermanto Siregar as advisory committee member whose positive criticisms and guidance shaped the outlook of this thesis. They have contributed immensely in this work and without them, I would have not reached this far. They dedicated their time, pieces of advice, resources and other material assistances that made this thesis to be acceptable in the academic cycles and among others done within the shortest time than had been anticipated. The two advisors made it easy for me to access information, consult them any time and were always ready for guidance whenever need arose.
The contributions of Prof. Bonar M. Sinaga, the coordinator of the study program also played a very important role in the production of this work. It was through his hard work, effort and dedication that contributed immensely towards the completion of this work. It was his tireless efforts from his busy schedule directed towards presentation of the thesis with a polished finish that has made this work to look more presentable. His counseling prowess always made this work to continue through some challenging and difficult times.
towards the production of this work as it involved making positive criticisms of this thesis together with recommendations of inputs which have made this thesis obtain a professional outlook and better for any reference thereby. He always availed himself for proof reading and critiquing this thesis despite his ever challenging busy schedule. His contribution towards the production of this final document cannot be underestimated as it makes the work easier to come into completion.
I have also to acknowledge the contribution of all my friends and comrades who have stood with me in this work during difficult times. I have to remember my friends that include Sally, Rodgers Atuhaire, Bruce Ochieng, Mammihery, Linda Hasu, Phimmasone and Robert Kibuuka for their moral support. My fellow classmates cannot be forgotten without whom my thesis would have not reached this far. Just to mention, Ambar Kurniawan contributed immensely by enabling me to access some data with ease hence deserves recognition especially data from oil world database.
The contribution of Netti Tinaprilla who contributed immensely towards the production of this work must also be appreciated. Also I have to thank my comrades and any other person who may have contributed towards the completion of this work. I have to remember my colleagues as Ruby, Dian, Fitri and Deasy for their cooperation just to mention a few.
Alphonce Joseph Obado, the author of this thesis was born on the 7th October 1975 in Bondo District, Kenya. He completed his primary education in 1990 and joined Maranda High School for secondary education from where he did his Kenya Certificate of Secondary education in 1994. He later joined Egerton University, Kenya in 1996 and graduated with Bachelor of Science Degree in Agricultural Engineering in 2002.
He joined Lagrotech Seed Company as a Field Assistant from January 2003 and served for one year. Between March 2004 and December 2005, he worked as Monitoring and Evaluation Assistant at Uhai Lake Forum, Kisumu. In January 2006, he joined Care International in Kenya, Western Kenya branch as Design, Monitoring and Evaluation Assistant where he worked until September 2006. He has also worked for World Vision Kenya as a consultant and carried out several project evaluation assignments. He has also performed similar duties for Plan International, Bondo Development Area.
LIST OF TABLES ………... v 2.2.2 Effects of Export Tax on Indonesian Crude Palm Oil… 2.2.3 Export Performance of Indonesian Crude Palm Oil…... 2.2.4 Government Subsidies……… 16 16 18 20 2.3. Status of Indonesian Palm Oil Industry……….. 2.3.1 Palm Oil Cultivation in Indonesia……….. 2.3.2 Supply and Demand……….…... 2.3.3 Indonesian Crude Palm Oil Export Markets…………... 21 21 22 23 2.4. Smallholder Scheme Types in Indonesia ………... 25
2.5.3 Constant Market Share Analysis……….
3.1. Welfare Effects of an Export Tax on Large Country………… 35
3.1.1 Export Tax Effects on Exporting Country……… 3.1.2 Export Tax Effects on Importing Country……… 3.1.3 Export Tax Effects onWorld Welfare……….. 3.1.4 Effect of Export Tax Policy on Crude Palm Oil……... 36 38 38 39 3.2. Competitiveness and Performance of an Industry……… 40
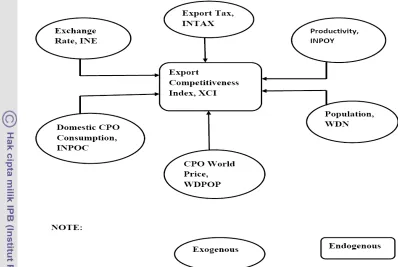
3.3. Conceptual Framework………... 43 4.2.1 Changing Export Structure and Dynamics of World Demand……….. 4.2.2 Export Competitiveness of the Indonesian Crude Palm Oil………... 4.3. Factors Contributing to Competitiveness of Crude Palm Oil... 51 4.4. Effect of Export Tax on Crude Palm Oil performance...
V. PALM PRODUCTION AREA, CRUDE PALM OIL PRODUCTION
AND CRUDE PALM OIL EXPORT……… 62
5.1. Palm Production Area………. 62
5.2. Development of Crude Palm Oil Production……….. 68
5.3. Development of Crude Palm Oil Export ……….. 76
VI. EXPORT COMPETITIVENESS OF INDONESIAN CRUDE PALM OIL……… 85
6.1. Indonesian Crude Palm Oil Export Market………... 86
6.2. Competitiveness of Indonesian Crude Palm Oil in World Market ……….. 89
6.3. Revealed Comparative Advantage of Indonesian Crude Palm Oil………. 91
6.4. Factors Contributing to Competitiveness of Indonesian Crude Palm Oil ………... 92 VII. EFFECT OF EXPORT TAX ON INDONESIAN CRUDE PALM OIL INDUSTRY………. 96
7.1. Indonesian Crude Palm Oil Supply Model………... 96
7.1.1. Indonesian Palm Oil Mature Area Model………. 7.1.2. Indonesian Palm Oil Yield Model……… 7.1.3. Indonesian Crude Palm Oil Consumption Model……. 7.1.4. Indonesian Crude Palm Oil Export Model……… 7.1.5. Indonesian Crude Palm Oil Production Model………. 7.1.6. Indonesian Crude Palm Oil Domestic Price Model….. 7.1.7. Indonesian Stock of Crude Palm Oil Model..………... 96
7.3. Evaluation of the Impacts of Crude Palm Oil Export Tax….... 107
7.4. Projection of the Impacts of Export tax on Crude Palm Oil Industry……….. 109
7.8. Problems and Prospect of Indonesian Crude Palm Oil Industry 120 7.9. Alternative Strategies that can Improve the Competitiveness
of Indonesian Crude Palm Oil in the World Market….…... 121
7.10 Policy Implication………... 124
VIII. CONCLUSIONS AND RECOMMENDATIONS……… 126
8.1. Conclusions………. 126
8.2. Recommendations………... 128
8.3. Suggestions for Further Research……….. 129
REFERENCES……….. 130
1. Indonesian Crude Palm Oil Export Tax in the Year 1997 to 2007…… 14
2. Impact of Export Tax of Crude Palm Oil in the Year 1994-1999……. 15
3. Revealed Comparative Advantage Index of Malaysia and Indonesia in China Crude Palm Oil Market in the Year 1999 to 2005………... 20
4. Export Markets for Indonesian Crude Palm Oil, Year 1995 to 2002... 24
5. Welfare Effects of Export Tax……… 36
6. Model Identification... 58
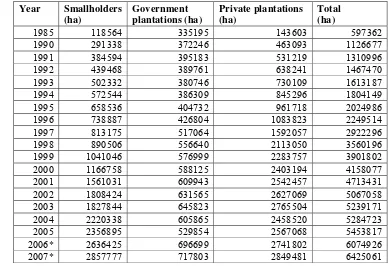
7. Areas of Palm Oil Plantation in Indonesia by Ownership, Year 1985 to 2007……… 63
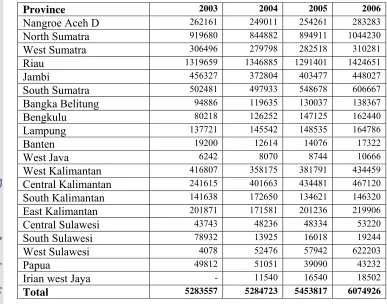
8. Area of Palm Oil Plantation in Indonesia by Province Hectares, Year 2003 to 2006………... 66
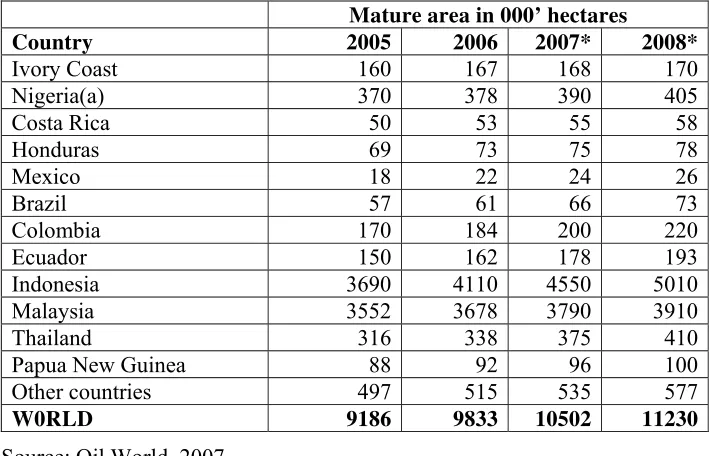
9. Mature Area Under Palm Oil, Year 2005-2008.……..……….. 67
10. Gross Domestic Product Contribution of Palm Plantation in Indonesia, Year 2003-2005………. 68 11. Production of Indonesian Palm Oil in Tons, Year 1997-2009……….. 69
12. World Crude Palm Oil Producing Countries in 2005 to 2008 ………. 73
13. World Palm Oil Productivity in the Year 2005-2008………... 74
14. Percentage Consumption and Export of Indonesian Crude Palm Oil in the Year 1997 to 2006... 77
15. Indonesian Crude Palm Oil Export in the Year 2002-2006………….. 81
16. Export Competitiveness of World's Crude Palm Oil Exporters, Year 1998 to 2005……... 85
17. Indian and Chinese Crude Palm Oil Imports by Country of Origin Year 2004 - 2006………... 87
18. Percentage of Crude Palm Oil Imported by Country of Origin, Year 2004 – 2006 ………... 88
22. Revealed Comparative Advantage of Indonesia in Crude Palm Oil
World Market in the Year 2004 to 2005……….….. 92
23. Regression Results for Export Competitiveness Factors…... 93
24. Regression Results of Oil Palm Mature Area………... 97
25. Regression Results for Palm Oil Productivity ………. 98
26. Regression Results for Crude Palm Oil Consumption ………. 99
27. Regression Results for Crude Palm Oil Export ……… 100
28. Regression Results of Crude Palm Oil Production ……….. 103
29. Regression Results of Domestic Price of Crude Palm Oil …………... 104
30. Regression Results for Crude Palm Oil Stock ………. 105
31. Model Validation Statistics……….. 106
32. Impacts of Export Tax on Indonesian Crude Palm Oil Industry………. 109
33. Projection of the Impacts of Export tax on Crude Palm Oil Industry... 112
34. Effect of exchange Rate on Domestic and World Prices …………... 114
35. Effect of Recommended Export Tax on Crude Palm Oil Industry…... 119
1. Revealed Comparative Advantages of Malaysia and Indonesia for
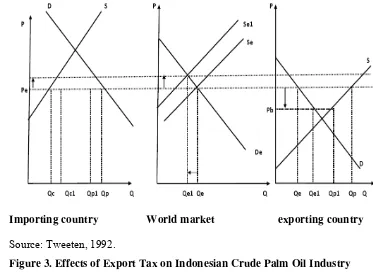
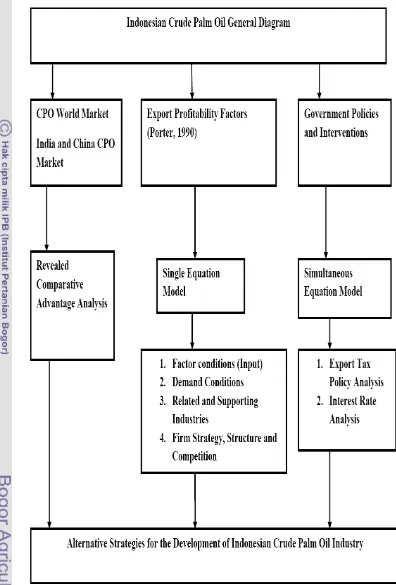
Palm Oil, Year 1996-2002……….. 19 2. Welfare Effects of Export Tax on a Large Country………. 35 3. Effects of Export Tax on Indonesian Crude Palm Oil………. 40 4. Conceptual Framework for Indonesian Crude Palm Oil Industry……. 44 5. Empirical Model for Factors Contributing to Competitiveness of
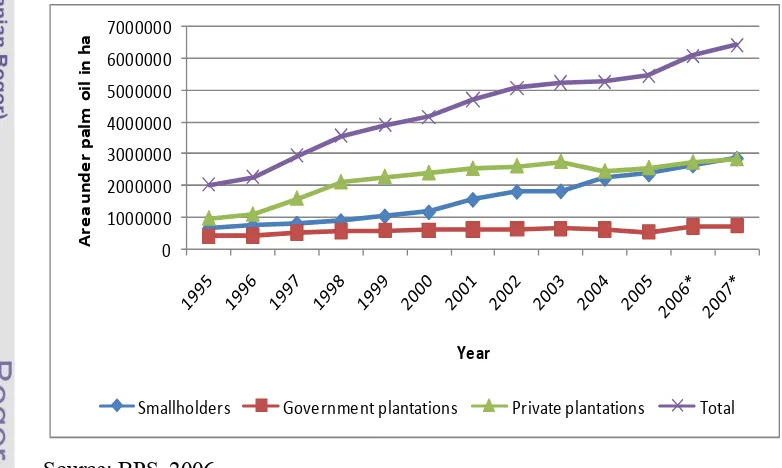
Crude Palm Oil………... 52 6. General Emprical Model of Crude Palm Oil... 54 7. Growth Trend of Palm Oil in Indonesia by Ownership……….. 64 8. Long Term Growth of Palm Oil Plantation area in Indonesia………... 65 9. Growth of the World’s Vegetable Oils from the Year 1999 to 2005…. 70
10. World Production Share of Indonesian Crude Palm Oil, Year 1997 to 2008………... 71
11. Malaysian and Indonesian Crude Palm Oil World Production Share,
Year 1997-2008………. 72 12. Output Share of Crude Palm Oil in Total Output of Manufacturing
Industry, Indonesia in the Year 2000-2004……… 75 13. Domestic Production, Consumption and Export of Crude Palm Oil in
Indonesia, Year 1997-2007……….... 76 14. Indonesian Export of Crude Palm Oil During 1980-2007………. 77 15. Indonesian Export of Crude Palm Oil, Year 1980-2007……… 78 16. Indonesia and Malaysia Crude Palm Oil Export, Year 2000-2007…… 79 17. Growth of World Demand of Vegetable Oils, Year 2002 and 2005….. 80 18. Export of Indonesian Vegetable Oils in the Year 2003 to 2006……… 81 19. The Indonesian Crude Palm Oil Export Market Year 2002-2006……. 83 20. World Market Share for Crude Palm Oil of Indonesia and Malaysia,
1. Parameter Estimation Program and Results……… 135
2. Parameter Validation Program and Results……… 139
3. Parameter Simulation Program and Results………... 142
THESIS
ALPHONCE JOSEPH OBADO
GRADUATE SCHOOL
1.1 Background Information
Agricultural products have a very important role to perform in the
development of the Indonesian national economy. These commodities, and
specifically crude palm oil (CPO), have contributed immensely to the Gross
Domestic Product (GDP) of Indonesia, led to growth in production and areal
development, created various forms of employment for more than 3.5 million
people in this sub-sector, increased international and national trade and improved
the living standards as well as the financial status of the local people (Siregar and
Sinaga, 2006). Crude palm oil is considered a strategic commodity in the
Indonesian economy being a source of raw material for the most commonly used
cooking oil consumed in Indonesia. The CPO price plays an important role in
determining the inflation rate of the Indonesian economy (Badan Pusat Statistik,
2001; Arifin and Susila, 1998; Amang, 1995). Palm oil is an important export
commodity that provides export earnings through foreign exchange inflows and it
is considered as one of the major sources of income for the Indonesian economy.
Indonesia is one of the highest CPO producers in the world. This can be
attributed to the country’s favorable climatic conditions, the large area of
production potential, its investment in research and technology, as well as the
availability of trained manpower that have necessary skills to bring about
improvements in CPO production. Such improvements have uplifted the quality of
Indonesian CPO to meet the specifications of the international market for crude
palm oil (Siregar and Sinaga, 2006). The development of CPO needs to focus on
requirements for the commodity for use in the food industry, industrial
applications, and as an alternative source of energy.
The crude palm oil industry in Indonesia has evolved from government
sponsorship and market interventions to a private sector initiative in response to
international price signals and continuous market growth. Induced by the
profitability in this sector,, oil-palm plantations in Indonesia have expanded from
600 000 hectares in 1985 to more than 6 million hectares by early 2007, and are
expected to reach 10 million hectares by 2010. At the same time, Indonesian
palm-oil production has increased from 157 000 metric tons to 16.4 million metric
tons in the same period, while exports have increased from 126 000 metric tons to
12 million metric tons (Rhett, July 20071).
From the global perspective, in 1962 world production of CPO recorded
1.2 million tons and in 2005 this reached 33.33 million tons, a staggering 28
million tons more than production in 1962. The world CPO production has grown
steadily and relatively faster as compared to other oil yielding crops. During the
period 2001-2005 the world CPO production grew on average 8.78 percent per
year (Soeherman et al., 2006). However, CPO production in Indonesia has been
constantly lower than that in Malaysia. During the period 2001-2002, Malaysia
produced 11 858 000 tons of CPO compared to 9 200 000 tons in Indonesia. In
2003-2004, the production in Malaysia reached more than 13 million tons while in
Indonesia was 11.6 million tons. The afore-going statistics reflect the relatively
stronger position of Malaysia in the world production of CPO in the past. In 2005,
Malaysia contributed 47 percent to total world CPO production, compared to
Indonesian with 38 percent. However, it is expected that in 2007 Indonesia will
surpass the Malaysian position in CPO production. Based on Oil World estimation (Soeherman, et al., 2006), in 2010 Malaysia is expected to produce 17.7 million
tons of CPO, while the level of production in Indonesia will reach about 22.5
million tons. Other important CPO producers in the world include Thailand,
Nigeria, Columbia, Venezuela, and Cote d’Ivoire. However, total CPO production
from these competitors has always been much smaller than that from Indonesia
and Malaysia.
In 2005, Indonesia and Malaysia together produced 85 percent of global
CPO supply that accounted for about 23 percent of the demand for vegetable oils
in the world. On the other hand, between 1999 and 2005 the other origin countries
produced, on average, less than one million tons. Even, in the last five years,
while the CPO production in Indonesia and Malaysia has kept growing annually,
the production in the other competiting countries have more or less stagnated.
Export growth can be attributed to three factors: world demand factor,
product and market effects and competitiveness effects. The world demand factor
reflects growth in exports that can be attributed to rising international demand, i.e.
the stronger global import demand, the stronger the country’s export growth
(Susila, 2004). However, an increase in a country’s share of world trade can only
be explained by factors beyond world demand effects. Major importers of
Indonesian CPO include India, the Netherlands, China, Pakistan, Bangladesh and
United Kingdom. As the production increases, the volume of export increases
while local demand remains relatively stable. The export of palm oil consists of
and Deodorized Palm Oil (RBD PO), RBD Palm Olein, RBD Stearin and Crude
Olein.
The export potential of Indonesian CPO does not depend only on the
excess supply of this commodity in the domestic market, but also on the world
market opportunity and capability of Indonesian CPO industry to make good use
of this opportunity. Tambunan reported that Indonesian export of CPO increased
from 117 300 Mt or US$ 21.39 million in 1961 to 6 386 410 Mt or US$ 2 454
million in 2003. The foreign currency contribution of CPO increases year by year.
In 2004, the country’s total non-oil and gas export revenues recorded at US$54
billion, of which US$ 4.43 million (8 percent) came from CPO export (Tambunan,
2006).
There are fundamental economic drivers that tend to result in countries
specializing in the production and export of products for which they have a
comparative advantage. Provided that technology can be directly acquired and
located with relative ease, comparative advantage between countries and regions
typically results from differences in the relative supply of inputs, such as labor or
natural endowments. Industries that rely on a relative abundance of factors of
production in a particular country or region are generally considered to have a
comparative advantage in the products they produce. By engaging in trade,
countries that specialize in producing goods at which they are relatively efficient
will maximize their economic wellbeing by importing the goods that they are
relatively less efficient at producing (Short et al., 2006).
Considering the importance of CPO, Indonesia has launched policies to
stabilize and secure the domestic supply and price. The export tax rate when first
introduced was linearly related to the CPO price, ranging from 40-60 percent of
the difference between the CPO price and minimum export price to be taxed.
From July 1997 to February 1998, the rate was changed to 5 percent of the CPO
price. Due to a sharp increase in the CPO price and substantial depreciation of the
rupiah, the government banned export in the beginning of 1998. Then, this policy
was replaced by an export tax of 60 percent which has since been gradually
reduced to 30 percent in July 1999 and approximately 3 percent in 2002 (Susila,
2004).
The export tax policy was expected to have a substantial impact on various
aspects of the industry, such as investment (area), production, consumption, trade,
domestic price, added-value, farm income and welfare distribution. On the other
hand, the magnitude and distribution of the impacts would brighten the future of
the industry. Therefore, an estimation of the magnitude and distribution of these
impacts is important in an effort to formulate an appropriate export tax rate
relatively fair to producers, consumers and the government.
1.2 Research Problem
The CPO industry is expected to play a greater role in the international
market for oils and fats. Basiron (2002), Sultoni and Susila (1998) and Pasquali
(1993) projected that the growth rate of CPO production would be the fastest
among edible oils. CPO has been predicted to overtake soya bean oil as the
biggest oil traded in the world oil market. The market development of CPO will
even be faster because of the success of the Uruguay Round (Susila et al., 2004
and Barton, 1993). However, for that to be maintained, it will heavily depend on
Comparative advantage is a fundamental economic driver in determining
the long-term export performance of any industry. By engaging in trade, countries
that specialize in producing goods in which they are relatively efficient will
maximize their economic benefits. Trade therefore plays a very significant role in
the economies across based on their comparative advantage. The developing
countries like Indonesia are relatively small as open-economies and therefore, rely
on income earned from export to create jobs, buy imports, and maintain an overall
healthy balance in external accounts. Furthermore, these countries are fiscally
dependent on international trade transactions for revenue to finance government
operations and increasing external debt payments.
The constraints of a small-sized economy render a country to open its
economy and integrate into the global trading system. In micro-states, the
smallness of domestic markets drive firms to seek external markets, while at the
same time, limited domestic resources increase the need for consumers and
producers to buy goods and services abroad. The openness of Indonesia is evident
through the trade openness indicator, measured as exports and imports of goods
and services as a percentage of output.
Indonesian CPO has been one of the leading agricultural exports that earn
foreign exchange for the country. The export market is quite strong for the
Indonesian CPO. More than 100 countries are found on the list of countries as
destinations of Indonesian palm oil, mainly through direct export. Major importers
are India, the Netherlands, China, Pakistan, Bangladesh, United Kingdom and
Malaysia. As the production increases, the volume of export increases as well
Refined, Bleached and Deodorized Palm Oil (RBD PO), RBD Palm Olein, RBD
Stearin and Crude Olein. However, Indonesia does not have the monopoly to
solely export CPO to the above countries hence faces a serious competition from
other CPO producers. It therefore has to be competitive in order to have control of
the market.
The competitiveness and performance of a particular product depends on
its productivity trend, export and its market share in such export markets where
the product is traded. Its export capability will be judged generally by its
contribution on the economy through foreign exchange earnings. This is realized
through the examination of its share in the GDP of the economy.
Due to the importance of the crude palm oil to the Indonesian economy,
and the world over, the Indonesian government decided to impose export tax on
its CPO. This was intended to improve the benefits of the local CPO producers
and consumers. The effect of this export tax needs to be critically studied to find
out whether it has positively contributed to the Indonesian CPO sector or it has led
to a deterioration of the sector. Therefore, it would be appropriate to assess the
performance of Indonesian CPO in the world market and the impacts that export
tax has on the CPO sector. This would result in the forecasting of the benefits of
massive investments employed in the CPO sector and find out whether it would be
a profitable venture for the Indonesian economy.
Therefore, the study wishes to answer the following questions
1. What is the performance and competitiveness of Indonesian CPO against
other CPO exporters in the world market?
3. What is the impact of the CPO export tax on Indonesian CPO industry and
specifically on domestic price, investment, production, consumption,
export, employment, added-value, cooking oil price, government revenue,
producer surplus and consumer surplus.
4. What strategies would make Indonesia improve its market share in the
world market?
1.3 Objectives
This study has three main objectives that are listed as follows:
1. To find out the export competitiveness of the Indonesian CPO in the world
market.
2. To assess the impact of CPO export tax on Indonesian CPO industry. In
addition, it will assess the effect of exchange rate on Indonesian CPO
industry.
3. To propose strategies that can improve the competitiveness of Indonesian
CPO in the world market.
1.4 Scope of Study
Farm production and the point of export are the focal points for the
analysis of comparative advantage and competitiveness, concentrating on
performance models. The concepts of competitive and comparative advantage are
applied as measures of economic profitability. The competitiveness measures the
efficiency of commercial activities of individual producers and firms in the
international markets.
The research considered the production, yield, export and competitiveness
national level. Growth trend of oil palm plantation in Indonesia was considered
and the results should reveal whether Indonesia is an efficient producer and
exporter of crude palm oil. The study further considered the export of crude palm
oil to the international market and its contribution to the Indonesian economy. The
performance of the CPO weighed against other leading world CPO exporters. The
global CPO demand was analyzed and compared to the export quantity from
Indonesia to establish the position of Indonesia in the CPO market.
Further, the effects of government policies especially export tax and
exchange rate on the performance and Competitiveness of CPO industry were
critically analyzed. The competitiveness of CPO were measured using revealed
comparative advantage (RCA) and export competitive index, while effects of
export tax and exchange rate were analyzed using simultaneous and single
econometric equations respectively. The strategies were formulated through the
SWOT analysis method that involved interviews with stakeholders in the
Indonesian CPO industry.
The limitations experienced in this research included limited finance that
could not allow the researcher to thoroughly visit oil palm plantations so as to
have first hand information from the farmers. The data used also were mainly at
the national level since local level data were inadequate. The export data could not
differentiate the quantities exported by Indonesians and Malaysians who own
plantations in Indonesia. This made it difficult to disaggregate the share of export
recorded as Indonesian CPO yet in actual fact should be recorded as Malaysian
2.1 Trade Competitiveness
A country’s trade competitiveness determines whether it has specialization
in the production of a good (Tam, 2001). A country has a comparative advantage
when it can produce the good more cheaply. As indicated by Kannapiran and
Fleming (1999), the country has a comparative advantage over another if in
producing the good it can do so at a lower opportunity cost. The country therefore
may gain from exporting the good so long as it has a marginover the world price.
Indices on the revealed comparative advantage (RCA) are commonly utilized as
proxies to measure trade competitiveness.
Comparative advantage entails the concept of opportunity cost either in
producing or exporting a particular good. The extent to which the domestic cost
differs from the world price reflects the competitiveness of that particular country
against others. The higher the cost-price differential, the higher is the advantage
for that country in producing the good (Simeh, 2004). The principle of
comparative advantage has been central to trade theory, demonstrating the gains
from, and direction of, trade. If every country specialized in the production and
export of goods in which another country is a relatively high cost producer, both
global welfare and the welfare of each trading country would be maximized.
Measures of comparative advantage are among the most useful guides to
optimal resource allocation in an open economy such as Indonesia where
international trade is vitally important. Economists have been applying the
principles of specialization and comparative advantage to explain the theory of
basic. The production and export of traded goods, including crude palm oil
exports, are normally guided by the international differences in costs of
production and prices of products measured in terms of comparative advantage
and international competitiveness.
The doctrine of comparative advantage has been one of the most powerful
influences on economic policy making and international trade in recent history. A
country has a comparative advantage over another if in producing a commodity it
can do so at a lower opportunity cost in terms of the foregone alternative
commodities that could be produced (Todaro, 1989). Economic planning involves
identification of the sources of comparative advantage and international
competitiveness, among other things, in a dynamic world.
The Ricardian and Heckscher-Ohlin doctrines of comparative advantage
(Ohlin, 1933) have been powerful influences on economic policy making and
international trade. The classical theory of comparative advantage was developed
by Ricardo to assess the economic efficiency of resource allocation in the
production of traded goods. He considered only one primary factor; labor, to
explain variations in labor productivity among industries and between countries as
the main source of comparative advantage.
According to the Heckscher-Ohlin doctrine, there are no variations in the
production function between countries and each country has a comparative
advantage in those industries that intensively use domestic factors available in
abundance (Warr, 1992). The Heckscher-Ohlin neo-classical model of
international trade and the Heckscher-Ohlin-Samuelson model (Samuelson, 1949)
include more than one primary factor. The Heckscher-Ohlin model is based on
influences such as technical change on the productivity of factors of production.
Some countries, such as Japan, have been successful in world trade with very
limited factor endowments but with great productivity improvements.
The development by Balassa (1965) of the ‘revealed comparative
advantage’ model, and its subsequent extension (Balassa, 1978) to encompass a
‘stages’ approach to industrialization, was a major innovation. For a particular
country, the revealed comparative advantage in a product is defined as the ratio of
the share of that product in world trade. If this index takes a value greater than
unity, the country is considered to have a revealed comparative advantage in the
product while a value below unity indicates a comparative disadvantage (Yeats,
1989).
A country’s trade performance can be affected by the sectoral composition
of its exports. For example, an increase in market share would be expected if
exports mainly comprise products for which world demand is growing more
rapidly than the global average. Export performance can also be affected by
changes in the demand for exports across regions such that an increase in global
market share would be expected if a country’s exports are destined for markets
that grow more rapidly than the global average. During the 1990s, the Irish
economy managed to substantially increase its share of exports to the United
States of America, which was the world’s fastest growing region during this
period. This mainly reflected the ability of the economy to attract US
multinational firms in high-technology sectors and much of the trade between
Ireland and the US represents intra-firm trade between branches of US
2.2 Government Policies
The government of Indonesia considers agriculture as a very important
sector in the national economy. Therefore all agricultural activities like cultivation
of rice, maize, spices, rubber, cacao and oil palm are encouraged. Agriculture
provides job opportunities for the majority of the labor forces in Indonesia. At the
same time, the government makes efforts to maintain the prices of basic goods
and services at levels affordable to low-income people.
Basic needs are mainly for food and clothing. Cooking oil also falls in this
category. Therefore the price of cooking oil has to remain at an affordable level.
When the price of palm oil in the international market went up in 1994, the price
of cooking oil in domestic market experienced a similar increase. In order to
lower the price of cooking oil, the government applies export tax on crude palm
oil and refined products. By export tax, the local price of the crude palm oil can be
brought down to a level which is considered affordable. When the price was not
excessively high, the tariff of the export tax was around 15 percent (Bangun,
2006).
However, when in 1998 the international price of palm oil reached US$
600 per metric ton (CIF Rotterdam) and the Indonesian currency suffered a
dramatic weakening of its exchange rate, the tariff of the export tax was increased
to 40 percent. Even such a high export tax was not sufficient to bring the local
price of cooking oil to the expectation of the public. So, the government further
increased the tax to 60 percent. As a result, the exporter of palm oil received only
US$ 240 per ton after a deduction of US$ 360 as export tax (Bangun, 2006).
Subsequently, the price of palm oil in international market declined and
to reduce the export tax to 30 percent, then to 10 percent, followed by 5 percent,
and subsequently to levels as shown in Table 1 (Bangun, 2006). In a new
regulation issued on September 10, 2005, the export tax is called “export
collection” which is categorized as non tax revenue by the government. It can be
easily calculated that the export of crude palm oil is subject to export collection as
much as US$ 5.25 per ton, and for RBD Olein US$1.14 per ton.
Table 1. Indonesian Crude Palm Oil Export Tax in the Year 1997 to 2007
From To CPO Export Tax (%)
December 1997 5
December 1997 January 1998 30
January 1998 April 1998 0
April 1998 July 1998 40
July 1998 February 1999 60
February 1999 June 1999 40
June 1999 July 1999 30
July 1999 September 2000 10
September 2000 February 2001 5
February 2001 December 2002 3
December 2002 June 2007 1.5
June 2007 To date 6.5
Source: BPS, 2007.
Since the policy implementation in August 1994, this export tax policy has
had significant impact on the industry. Within the time horizon 1994-1999 when
the effective tax rate was around 13.33 percent, the mature area of oil palm
plantation had been reduced by 2.56 percent per annum or around 37 000 ha per
annum as reported in Table 2. This indicates that this policy had a substantial
negative effect on investment in the industry. As a result of this negative
investment effect, CPO production had also been depressed by the policy. It is
estimated that the policy had caused a loss of around 0.81 percent of the total
Table 2. Impact of Export Tax of Crude Palm Oil in the Year 1994-1999
Variable Units Mean Impact in
percent
Impact in volume (Mean)
Mature Area 000’ ha 1445.00 -2.56 -37.00
Production 000’ tons 4484.00 -0.81 -36.32
Export 000’tons 2371.00 -6.20 -147.00
CPO Price Rp/kg 1525.00 -8.58 -130.85
Cooking Oil Price Rp/kg 2366.85 -7.77 -183.90 Source: Susila, 2004.
The most devastating impact of the policy had been on the export and farm
income. During that time horizon, this policy had caused a 6.02 percent drop in
exports compared to the pre-export tax period. This implies that Indonesia had
sacrificed her export of about 147 000 t annually. Similarly, the policy had caused
the farm income to be lower by around 11.35 percent or around Rp 400 000/ha/yr;
a substantial loss for farmers. On the other hand, this policy had been proven to be
effective in controlling domestic cooking oil price. With this policy, the
government had been successful to keep the cooking oil price down when the
world CPO price increased or when the rupiah was substantially depreciated.
Using this policy, the government had kept the cooking oil price at 7.77 percent,
or Rp 184/kg, lower than it should be. Moreover, from the government point of
view, significant tax revenue, estimated at around Rp 5241 billion, was also
considered to be a positive result of the policy (Susila, 2004).
The reference price was to be adjusted monthly based on the actual prices
in Rotterdam and Kuala Lumpur. With regard to laws and regulations and the
objective of achieving good governance, both the government and the parliament
promulgated laws on forestry and plantations. The law on forestry No.41 was
promulgated in 1999 and the law on plantations No.18 was promulgated only
palm plantation. Only certain forests can be converted into plantation. With these
new laws already in place, the government has been taking measures to enhance
the protection of forest and as well as endangered animals.
2.2.1 Effects of Export Tax
Export taxes are predominantly used by developing countries with the
objective either to generate government revenues or to protect particular groups
for political reasons. The effect of an export tax by a small country under a
competitive market structure causes the price in the exporting country to fall
below the world price (Reed, 2000; McCalla and Josling, 1985).
Empirical studies on the effect of export taxes have been conducted by
Akiyama (1992), Bruce and Perez-Garcia (1992) and Warr (1997). Akiyama
(1992) examined the effect of an optimal tax on perennial crops (cocoa) in a large
country case. In particular, his research focused on an optimal export tax and its
implications on producer surplus and government reserves. His results showed
that an export tax significantly affected the distribution of national welfare
between farmers and the government, and also significantly affected the long-run
production of cocoa. Bruce and Perez-Garcia (1992) examined the economic
impact of a USA export tax on forest products using a competitive global trade
model. Their results showed a loss of consumer welfare in the USA and a large
transfer of wealth from timber growers to processors. Warr (1997) conducted a
similar study on Thailand’s rice export tax and calculated economic gains and
losses.
2.2.2 Effects of Export Tax on Indonesian Crude Palm Oil
the implementation of the export tax in September 1994. The effect of the export
tax on Indonesian palm oil reached a peak in December 1994, when it reduced net
export shares by 64.4 percent. The export tax was quite variable during the
September 1994 through December 1997 period, but model results made it clear
that the export tax had tremendous impacts on palm oil exports from Indonesia.
Clearly, the export tax policy reduces not only competitiveness of the
Indonesian palm oil industry but also hurts producers of CPO, some of them are
small-holder farmers, due to the lower price of CPO relative to the world market
price. On the other hand, refiners that process CPO into various products such as
cooking oil, margarine, shortening gain from this policy since they get CPO at
lower prices (Mohamad et al., 2001). Finally, consumers may or may not gain
from this policy since there is no guarantee that the processors will pass on the
lower price of cooking oil. Considering that the concentration ratio in this industry
is large, which indicates a potential oligopolistic market structure; it is not likely
that the consumers fully benefit from the lower price of cooking oil.
The export tax policy also hinders the development of the cooking oil
industry in Indonesia as a whole and does not encourage diversification in
cooking oils. The major sources of cooking oil in Indonesia are coconut oil, which
is made from CCO (crude coconut oil), and RBD (refined, bleached, deodorized)
Olein, which is made from CPO. These two products are close substitutes so that
policies imposed on one commodity will have tremendous effects on the other
commodity.
The imposition of an export tax diverts CPO from the export market to the
domestic market, lowering all cooking oil prices. This causes more competition
more of the raw material for domestic cooking oil (Soeherman, et al., 2006).
Considering that significant amounts of copra, the raw material of coconut oil, are
made from coconuts that come from small-holder farmers, the export tax policy
on CPO could further lower price of coconuts and pressure farm incomes.
In light of the current economic crisis, the export tax policies discourage
the country’s recovery effort. Under current exchange rates, there is an
opportunity to increase Indonesia’s industrial export competitiveness to achieve
economic recovery. Improved competitiveness will benefit not only economic
growth but also overcome the bias against the rural and agricultural sectors which
has been associated with previous growth spurts. Thus, agricultural exports should
be encouraged at all costs. The implications are that taxes and non-tax barriers to
export should be removed if the potential gains from export are to be realized. By
imposing an export tax on CPO, the government creates an impediment to
increasing agricultural exports and competitiveness of the export-oriented
industry.
2.2.3 Export Performance of Indonesian Crude Palm Oil
Export value of Indonesian CPO in 1999 was US$ 118.37 million and in
2005 increased to US$ 493.39 million that contributed to 36.24 percent growth
rate per year. Indonesia CPO faces competition from Malaysia in the international
market. During the same period, in 1999, Malaysia exported CPO worth US$
311.46 million while in the year 2005 it received US$ 814.063 million from CPO
Source: Tambunan, 2006
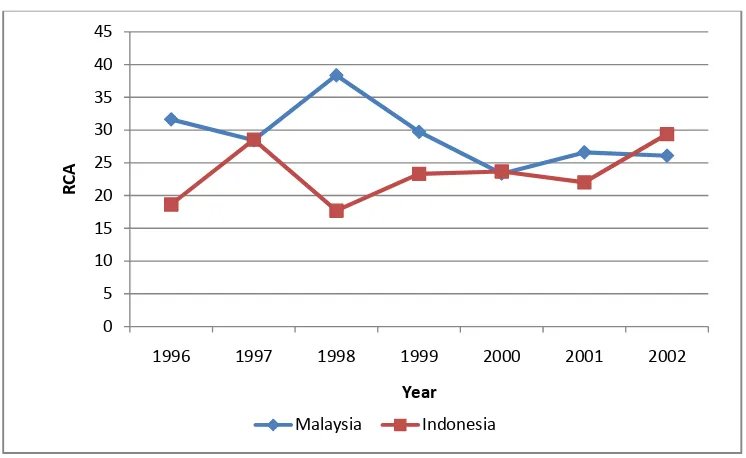
Figure 1. Revealed Comparative Advantages of Malaysia and Indonesia for Crude Palm Oil, Year 1996-2002
Tambunan (2006) used Revealed Comparative Advantage (RCA) Index
according to the Balassa formula. Based on data from the Ministry of Industry
(Deprindag), Figure 1 above shows the RCAs of Indonesia and Malaysia as
reported by Tambunan, 2006, which indicated that Malaysia is indeed the heaviest
competitor for Indonesia in palm oil trade, as in most years the RCA of Malaysia
is higher than that of Indonesia.
The export performance index of CPO (RCA) of Indonesia and Malaysia
in the period 1999 to 2005 had values greater than one (RCA>1). RCAI of
Indonesia in China’s market in the year 2005 was 1.29 while Malaysia had a value
of 1.66 as shown in Table 3, showing that Malaysia and Indonesia at that time had
comparative advantage in exporting CPO to China. In comparison of revealed
comparative advantage index per year, the export performance of Malaysian CPO
was higher than that of Indonesia (Siregar and Sinaga, 2006).
0 5 10 15 20 25 30 35 40 45
1996 1997 1998 1999 2000 2001 2002
RCA
Year
Table 3. Revealed Comparative Advantage of Malaysia and Indonesia in China Crude Palm Oil Market in the Year 1999 to 2005
Year Malaysia Indonesia
1999 1.88 1.76
2000 1.58 1.47
2001 1.33 1.05
2002 1.61 1.40
2003 1.82 1.62
2004 2.00 1.73
2005 1.66 1.29
Source: Siregar and Sinaga, 2006.
Simeh (2004) found that Indonesian CPO has comparative advantage like
Malaysian CPO because of the low cost of producing CPO in Indonesia (US$
165.2 per ton) compared to that of Malaysia that costs US$ 239.4 per ton. With
uniform price of US$ 433.0 per ton gives a profit margin between production cost
and price of CPO of US$ 277.8 for Indonesia which is higher as compared to that
of Malaysia that gets US$ 203.6 per ton (Siregar and Sinaga, 2006).
2.2.4 Government Subsidies
The Indonesian government has lessened the burden on the industry by
cutting export tax to 3 percent. However government gives no cash subsidy or
equivalent incentives, and allows market forces of supply and demand to govern
the price of palm oil paid to the producer (Howard, 2001). This is also the case in
Malaysia, although there is recognition that the current CPO market price paid to
smallholders is insufficient to maintain a reasonable standard of living. As a result
there is a proposal from the Malaysian government to pay an "incentive" of $260
per planted hectare to both smallholders and to estates that re-plant palms over 25
years of age.
In contrast, fat and vegetable oil producers in the United States and Europe
$28 billion to its farmers and ranchers in the financial year 1999-2000, equivalent
to almost half of total farm income. An additional $500 million ‘emergency
assistance’ was available in 2000 to 600 000 producers of oil seed (canola,
flaxseed, mustard, rapeseed, safflower, sesame, soybean and sunflower). Further
cash is available to all farmers if natural disasters cause losses. Within the
European Union the producers of rapeseed received a subsidy of 46 percent of
their production costs. The spirit of the World Trade Organization agreements to
stop farming subsidies is clearly being broken to the detriment of the Indonesian
and Malaysian producers of palm oil.
2.3 Status of Indonesian Palm Oil Industry
2.3.1 Palm Oil Cultivation in Indonesia
Palm oil trees were brought to Bogor, West Java as ornamental plants in
1908. Not until 1911 was it cultivated commercially, when oil palm plantations
were started on the East Coast of Sumatra Island. By 1969, Indonesia produced
180 000 tons of palm oil and around 40 000 tons of palm kernels. Small quantity
of palm oil was used in domestic market and the balance was exported. As for
palm kernel, total production was exported as no palm kernel crushing plant had
been installed in Indonesia (Bangun, 2006).
Until early 1970’s palm cultivation was done by large plantation
companies only. Small private companies and farmers came into this business in
1975. The soil and climate in many parts of Indonesia are suitable for growing oil
palm. But the soil and climatic condition are also suitable for cultivation of
coconut tree, rubber, cacao and spices. Small holders chose to grow coconut or
rubber trees because their crops could be easily marketed, while for oil palm fruit
international market was exceptionally high (around US$ 700 per ton), efforts
were made to increase the production. The government established a scheme
called Nucleus Estate Scheme (NES), where state-owned plantation companies
helped farmers to grow oil palm. The plantation companies provided seedlings,
technical assistance and finance to small holders. Their crops would be purchased
by the companies’ mills (Bangun, 2006).
The farmers’ access to processing mills was greatly enhanced. As a result,
more and more farmers and small companies were attracted to cultivate oil palm.
Consequently the growth of oil palm area after 1975 was through the effort of
multiple players: large companies (both foreign and domestic), state owned
companies and small holders. Presently about 32 percent of the total planted area
belongs to small holders, about 50 percent to large companies and about 18
percent to state-owned companies.
2.3.2 Supply and Demand
The productive area in 2006 was only 4.15 million hectares out of 5.15
million hectares planted area. The productivity varies from company to company
due to different factors like soil and climatic conditions, efficiency of
management and security problems. Large companies have better management
resulting in higher productivity. A certain company produces an average of 23
tons of Fresh Fruit Bunches (FFB) per hectare per year with an oil extraction rate
(OER) of 24 percent. That means a productivity of 5.52 tons of palm oil per
hectare per year. In addition, this company produces 4.6 percent or 1.06 ton of
palm kernel. Total production is 6.58 tons. Smaller companies produce much less.
in productivity of 3.04 tons of palm oil per hectare per year. Small holders
produce even less. Some only make 13 tons FFB with OER of 18 percent resulting
to 2.34 tons of palm oil per hectare per year (Bangun, 2006).
Demand for palm oil is growing very fast. Global production has doubled
over the past ten years and is expected to double again in the next decade. A major
opportunity exists to meet the rising demand in an environmentally and socially
sustainable manner through expansion and improvement of smallholder
production. Smallholders already play a significant part in the palm oil industry.
In the two countries responsible for over 80 percent of world oil palm production,
Indonesia and Malaysia, smallholders account for 35-40 percent of the total area
of planted oil palm and up to 33 percent of the output. In other countries,
considerable numbers of smallholder producers are present, but are often not
properly linked to world markets (Vermeulen et al., 2006).
The demand for palm oil consists of domestic and export components.
Domestic demand is to fulfill the need of over 240 million people for cooking oil.
Average consumption of cooking oil is around 12 kg per capita per year. Small
part is contributed by coconut oil, so that palm oil supplies about 10.5 kg per
capita in the form of RBD Palm Olein. In total 2.31 million tons of palm cooking
oil is needed which is equivalent to 3.2 million tons of crude palm oil per year.
Other domestic demand is for soap making and oleo-chemical industries. This
accounts for 200 to 500 thousand tons of crude palm oil. Total domestic demand
varies from 3.4 to 3.7 million tons (Soeherman et al., 2006).
2.3.3 Indonesian Crude Palm Oil Export Markets
The development of the Indonesian oil palm sector is increasingly
4 provides an overview of the main export markets for Indonesian palm oil both
crude and refined.
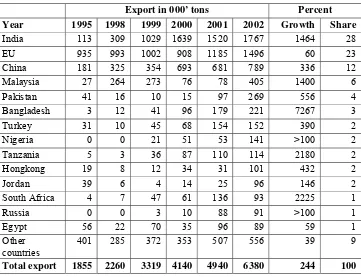
Table 4. Export Markets for Indonesian Crude Palm Oil, Year 1995 to 2002
Export in 000’ tons Percent
Year 1995 1998 1999 2000 2001 2002 Growth Share India 113 309 1029 1639 1520 1767 1464 28
EU 935 993 1002 908 1185 1496 60 23 Total export 1855 2260 3319 4140 4940 6380 244 100
Source: BPS, 2004.
Despite a volume growth of 60 percent since 1995, the European Union
lost its position as the most important export market for Indonesian palm oil to
India. The share of the EU declined from 50 to 23 percent, while India now
accounts for 28 percent of Indonesian palm oil exports. Some other Asian
markets, especially China, Malaysia, Pakistan, Bangladesh and Hong Kong are
quickly expanding their palm oil imports from Indonesia. On a lower level, the
same applies to some African countries that include Egypt, Tanzania, Nigeria and
South Africa as well as to others like Jordan and Russia. In the past seven years,
Indonesia has further diversified its export markets, a development that looks
oil exporter in the world are worth remarking on. It is probable that this palm oil is
re-exported from Malaysia, but classified as Malaysian palm oil.
2.4 Smallholder Scheme Types in Indonesia
2.4.1 Nucleus-Plasma Schemes
Between 1978 and 2001, the Government of Indonesia provided policy
support and the World Bank financial assistance to nucleus-plasma (Perkebunan Inti Rakyat or PIR) supported grower schemes, in which plantation companies would develop palm oil plots for smallholders in a ‘plasma’ area around their own
plantation ‘nucleus’. Management of plasma plots, generally 2 hectare of oil palm
plus one hectare for other crops, would be transferred to individual smallholders
after 3-4 years. The nucleus-plasma schemes were conceived as an integral part of
the government’s resettlement (transmigrasi) programme, through which Javanese and Sumatran people transferred to start a new life in the less populated
islands. Thus many, though not all, of the plasma smallholders have been new
settlers (Vermeulen et al., 2006).
Nearly 900 000 hectares of palm oil smallholdings were established under
variations of this model. Land for the schemes was allocated by central
government from a land category called conversion forest. Much of this land was
simultaneously under the management and traditional ownership (adat) of local communities, who in this sense were, consensually or not, contributing a capital
investment of land into the nucleus-plasma schemes. The original apportionment
between nucleus and plasma was 20-80, but this tended towards 40-60 percent
over time (Vermeulen et al., 2006).
In a typical scheme, holders of the plasma plots would be supported in the
inadequate) subsistence agriculture. The management of the plasma area would
come officially under a cooperative of smallholders, which would generally
contract technical functions back to the nucleus plantation company. Hence
growers often work as laborers on their plots. They receive additional income
through the guaranteed sale of fresh fruit bunches at a price set through a
government formula (Zen et al., 2005).
The nucleus-plasma schemes continue, though government sponsorship of
expansion stopped in 2001 following Indonesia’s major decentralization of
government functions that year, and a renewed support for traditional individually
owned smallholdings. Zen et al. (2005) reported that, although there are
exceptions, many of the smallholders in mature nucleus-plasma schemes are
getting good incomes today. But underlying issues such as control over land
remain unresolved. Nucleus-plasma schemes not only occupy lands where there
are overlapping systems of customary (adat) ownership, but also disrupt adat
arrangements, for example by allocating plasma farmers 2 hectares plots
belonging to another community or even in another sub-district.
2.4.2 Koperasi Kredit Primer Anggota Schemes
The Indonesian government introduced the KKPA (Koperasi Kredit Primer Anggota), which literally translates as Members’ Primary Credit Co-operative Scheme as a general rural micro-finance programme, through which
formalized local cooperatives could borrow up to a maximum of IDR50 million,
at a partially subsidized repayment rate of 16 percent, for small business
development (Vermeulen et al., 2006). The scheme was widely applied in the
Cooperatives of smallholders have more autonomy under KKPA than under
earlier nucleus-plasma models.
Both nucleus-plasma schemes and the modified KKPA schemes are not
without problems – smallholders report an abiding set of difficulties, such as:
1. Long delays (of up to eight years) in receiving allotted land and credit
2. Allocated plots are inaccessible
3. Roads are poorly maintained
4. Traditional intercropping disallowed
5. Decision-making is in the hands of the company (land allocations,
recruitment of labor, prices for fresh fruit bunches)
6. After production, land reclamation costs are high
7. Broader scale social and environmental impacts such as rivers drying up
and cost of living rising
2.4.3 Pola Patungan Scheme
In a variation on the nucleus-plasma and KKPA schemes, the Pola Patungan (Joint Venture Model) scheme gives local residents, who are settlers under the Indonesian transmigration programme, share certificates for their 2
hectares, rather than allocating an actual block of land. Shareholders are then
given the choice of working either in the plasma under the cooperative, trained by
the plantation company, or in the nucleus staff. The reasoning behind this is to
pre-empt conflicts arising from the variable performance of individual blocks, but
another outcome was greater efficiency analogous to the Malaysian scheme.
Anecdotal evidence suggests that the standard of living is relatively high among
2.4.4 Income Diversification Sub-Scheme
A medium-sized plantation company in Sumatra, Indonesia, distributed 3
cattle to every one of 500 employees, with supplementary feeding on oil palm
waste and kernel cake. The cattle are used for breeding, fattening and transporting
fresh fruit bundles and the scheme is considered a huge success economically and
socially (Zen et al., 2005).
2.5 Measurement of Comparative Advantage
2.5.1 Price Competitiveness
International competitiveness relates to an economy’s ability to compete in
international markets by either producing goods at a lower cost or selling goods at
a lower price than competitor countries. Obviously these two concepts are
interrelated, as the lower the production costs the lower the price firms can charge
for their products yet remain profitable. In the short term, competitiveness
developments are often equated with the evolution of the real exchange rate. The
real exchange rate is essentially a relative price or cost index expressed in some
common currency. The Central Bank’s real trade weighted competitiveness index
(RTWCI), for example, shows changes in the relative price of a country’s goods
expressed in a common currency. As a result, it takes into account changes in both
the nominal exchange rate and prices relative to our major trading partners.
2.5.2 Cost Competitiveness
The Real Trade Weighted Competitiveness indicator provides one measure
of export competitiveness. One advantage of this measure is that because it is
based on consumer or producer prices and it offers the most up to date data,
producer prices relative to our trading partners. It can be argued, however, that
since this includes a very large number of non-traded goods and services it does
not provide a very good indication of international competitiveness.
An alternative would be relative export prices since they cover only
tradable products. They suffer from other drawbacks, however, one of which is
particularly relevant for any country. As a small open economy, the country’s
export prices are generally set in international markets and, effectively, given for
home country’s exporters. Therefore, changes in competitiveness manifest
themselves through changes in profitability (export prices less the cost of
producing exports) rather than changes in prices. For this reason, relative cost
indicators, which overcome the difficulty with export prices, are a useful
alternative measure of export competitiveness.
Wage costs are an important component in the total costs of producing
exports and unit wage costs in the traded (manufacturing) sector relative to our
main trading partners, expressed in a common currency, are generally accepted as
a useful proxy for cost competitiveness. It is important to recognize, however, that
unit wage costs do not take into account changes in non-labor business costs,
including rents, energy, communications, insurance, waste and cost of capital.
2.5.3 Constant Market Share Analysis
An approach used to establish the position of a commodity in the world
market in terms of growth, composition, distribution and competition is based on
constant market share (CMS) analysis. This analysis is used to measure export