AFTA AND ITS IMPLICATION TO THE EXPORT DEMAND OF
INDONESIAN PALM OIL
Ernawati, Fatimah, Moh. Arshad, Mad Nasir Shamsudin, dan Zainal A. Mohamed
ITAP-USAID Lt. 9 Gedung I Departemen Perdagangan Jl. M.I. Ridwan Rais No. 5 Jakarta 10110
ABSTRAK
Makalah ini mengkaji dampak perubahan kebijakan liberalisasi perdagangan (penurunan pajak ekspor dan tarif impor) terhadap permintaan ekspor minyak sawit Indonesia. Kajian ini menggunakan Error Correction Model. Pertama dilakukan simulasi model secara parsial dengan menurunkan pajak ekspor dan tarif impor berturut-turut 10, 30, 50 dan 100 persen. Simulasi berikutnya adalah menurunkan pajak ekspor dan tarif impor secara simultan berturut-turut 10, 30, 50 dan 100 persen. Hasil kajian menunjukkan liberalisasi perdagangan mengakibatkan harga minyak sawit dalam negeri meningkat dan harga pasar dunia menurun. Akibat penurunan pajak ekspor menyebabkan volume ekspor ke India, China, Eropa dan sisa negara dunia meningkat masing-masing 0,38; 3,77; 0,67; dan 4,63 persen. Pengurangan tarif impor menyebabkan volume ekspor ke negara tujuan yang sama meningkat masing-masing 0,25; 2,67; 0,49;, dan 2,96 persen. Sementara penurunan pajak ekspor dan tarif impor secara bersamaan mengakibatkan volume ekspor meningkat masing-masing 0,64; 6,23; 1,11; dan 7,35 persen.
Kata kunci:liberalisasi perdagangan, error correction model, permintaan ekspor
ABSTRACT
This paper examines the impacts of trade liberalization policy changes (reduction in export duty and import tariff) on the export demand of the Indonesian palm oil. The study utilised an error correction model. The model is simulated by decreasing the export duty and import tariff individually by 10, 30, 50 and 100 percent. To see the combine effect both in export duty and import tariff were simultaneously reduced by 10, 30, 50, and 100 percent. The findings indicate that trade liberalization due to increase domestic price and reduce in world price. Due to the reduction in export duty, the quantity exported to India, China, Europe, and ROW increased by 0.38, 3.77, 0.67 and 4.63 percent respectively. Reduction on import tariff on the exportedquantity to India, China, Europe, and rest of the world increased by 0.25, 2.67, 0.49, and 2.96 percent respectively. And export duty and import tariff reduction by 10 percent increased export to India, China, Europe, and ROW by 0.64,6.23, 1.12, and 7.35 percent, respectively.
INTRODUCTION
The palm oil industry is an important sector in the Indonesian economy as it is one of the country's major export earners as well as food source for her population. The production of palm oil in Indonesia has increased from 450 000 tonnes in 1976 to 12.11 mn tonnes in 2004 indicating a drastic increase of more than 2000 percent. This makes Indonesia as the second world largest producer of palm oil after Malaysia. Indonesia accounted for about 34.04 percent of the world production compares to Malaysia which accounted for 55.26 percent in the year 2005. In the last a decade the average annual growth rate of production of palm oil in Indonesia was 21.67 percent while the figure for Malaysia was 7.71 percent suggesting a rapid expansion of hectarage and production of palm oil in this country.
Unlike Malaysia, Indonesia consumes about 45 percent of domestic production of palm oil in the form of cooking oil. Indonesia is the largest consumer of palm oil in the developing economies. In 2005 Indonesia consumed a total of 5.5 mn tonnes of palm oil which comprises frying oil (76.75%), soap and detergent (7.12%), and oleochemicals (9.62%) (Indonesian Palm Oil Commission Board, 2005). About 54 percent of the production is exported in the form of crude palm oil. The total of palm oil exports increased from 406,000 tonnes in 1976 to 9.4 mn tones in 2005. In 2005 Asia has become the primary market for Indonesian crude palm oil exports, taking about 70 percent of its total exports. The E. U is the second largest market for Indonesian crude palm oil exports, taking almost 25 percent of its export (Oil World, 1999-2005).
With the advent of ASEAN Free Trade Area (AFTA), Indonesia as a member ASEAN4 has pledged to reduce the tariff under the CEPT5 programme. This trade liberalization move is expected to bring some major changes onto the Indonesian palm oil industry which has been subjected to various degrees of intervention and protection. Hence, this study intends to examine the implications of trade liberalization through AFTA on the Indonesian palm oil industry. Specifically it aims at firstly; examining the factors that influence the export demand of the Indonesian palm oil. Secondly, ascertaining the direct effect of trade liberalization vis-a-vis a reduction of export tax on export demand of Indonesian palm oil industry. Lastly to recommend policy strategies to ensure the competitiveness of the Indonesian palm oil sector.
The paper is organized as follows: Section II discusses the conceptual framework. It is followed by methodology in section III. Section IV presents and discusses the results. And finally, Section IV states the conclusion and policy implications of the study.
METHODOLOGY
A number of studies have been carried out to analyse the palm oil market in Malaysia and Indonesia. The notables ones are: Lubis (1994), Shamsuddin et aI. (1994) and Susila (1995) which examined supply demand system of the Malaysian palm oil. Dradjat (1995), Simatupang and Purwanto (1995), and Sumaryanto and Rantenata (1996) investigated the domestic demand for palm oil in Indonesia. Larson (1996) and Shamsuddin et al. (1997) examined the determinants and implications of policy instruments on the Indonesian and Malaysian palm oil market respectively. Suryana (1986), Tondok (1998), Ibrahim (1999), Basiron (2001) examined the prospect of palm oil in the international market in the case of both Malaysia and Indonesia.
indicate correlated trends and it is not the implication of a real economic relationship. To remedy this problem, the co-integration technique and error correction modeling are recommended.
Some recent studies have confirmed the existence of a co-integrating longrun relationship between the agricultural commodity and economic variables, such as McKay (1998), Angulo and Zapata (2000), Warr and Wollmer (2000), Mushtaq and Dawson (2000), Thompson (2000) and Salih (2001).
An econometric approach with inclusion of an error correction model on the simultaneous equation model was employed in this study to investigate the impact of trade liberalization on the Indonesian export demand for palm oil.
Export demand is a derived demand, as palm oil is used as an input for final food product, which depends on the price of inputs and the price of outputs (Shamsudin et aI., (1988)). Therefore, the export demand function is influenced by the price of palm oil and the price of substitute of palm oil. The palm oil price is expected to be negatively related, whereas the soybean oil price is expected to be positive. In addition substitute of palm oil is used because buyers of Indonesian palm oil would be expected to make decision based on world substitute price of palm oil.
Other factors that influence export demand are exchange rates, and government policy. Beside the policy imposed by exporting countries, government policy imposed by importing country also influences the export demand. Since 1994, when the CPO domestic supply for cooking oil factories were in deficit, the government then regulated some policies including export tax regulation. Meanwhile, tariff import imposed by the importing country also influences the export demand; hence these government policies should be taken into account in the model of export demand. However, these two factors directly influence the price of palm oil, hence in order to accommodate the purpose of the study, these two variables are expressed in the price equation.
To achieve the objectives of the study, four export destinations of Indonesian palm oil were selected in estimating export demand functions for Indonesian palm oil. The destinations were India, China, Europe, and the rest of the world (ROW). Hence the specific variables such as the substitute of palm oil included in the model are based on the conditions operating in each country. For example, for the USA export model, the substitute for palm oil is soybean whereas for China it is rapeseed as these countries have comparative advantage on these cqmmodities respectively .
Generally, the export demand function can be specified as:
t t t
t
f
WPO
PSTO
EX
IP
The description of Indonesian palm oil structural condition implicitly illustrated that the government policy is very important especially the distribution and export tax policy. According to Larson (1996), the export tax variable has had a demonstrable effect on domestic prices. Furthermore, palm oil has become an international commodity, thus, the global CPO price directly impacted the domestic pnce.
However, in order to capture the effects of variations in the Indonesian exchange rates and export duties imposed by the Indonesian government on palm oil exporters, and to link the domestic price to the world price, it is necessary to introduce a new price transmission identity. This identity can be written as:
DPt = XPt – XTt (2)
where:
DP2 =Domestic price
XPT = Export price of Indonesian palm oil
XTt = Indonesian palm oil export tax
The price transmission equation (equation 2) is only an approximation because there are other costs and profits which should be deduced, such as transportation cost and profit margin, but they are not available (Lubis, 1994).
In order to evaluate the impact of trade liberalization on the Indonesian palm oil market, the effects of imposition of import duties by the importing countries on Indonesian palm oil market should also be taken into consideration. The import duty is obtained by multiplying the import duty rates imposed in each importing countries by CIF prices of Indonesian palm oil in the Europe market as a proxy for the world market price. Therefore:
WPOit = PXt* t (3)
However, since most importing countries imposed ad valorem tariff, equation (3) can be express as:
WPOit = PXt(1+t) (4)
Where i indicated the country, for this purpose, only the importing countries that actually imposed import duties on Indonesian palm oil export, such as EEC countries, China, India, and ROW are taken into account. Therefore, in this study 1 = China, 2 = India, 3 = Europe, and 4 = Rest of the world.
In attempting to evaluate the sensitivity of the Indonesian palm oil industry to the level of export duty and import tariff, which are imposed by importing country, the model was simulated again by reducing the export duty and import tariff, by 10, 30, 50, and 100 percent.
This study utilised annual data for the period 1969-2004 for selected countries compiled from different sources. Indonesian data on palm oil acreage, harvested area, yield, production, consumption, export, price, policy and others were obtained from the Indonesian Palm Oil Research Institute (IOPRI), Indonesian Palm Oil Producers Association (GAPKI) all,d Indonesian Statistics Bureau. World data on these components were obtained from mainly Oil World, Malaysian Palm Oil Board and various publications related to this study such as FAO Production and Trade Year Books, World Bank, ASIA's Economic Indicators and Malaysian Financial.
RESULT AND DISCUSSION
The Unit Root Test for Non-Stationarity and Cointegration Test
Since this study utilized the error correction model, then the first step on the data analysis is to make sure that all data are stationary. The results of ADF test indicate that the null hypothesis of a unit root could not be rejected for all variables in levels. It implies that all the variables in the model are found to be 1(1) nonstationary. As at level the null hypothesis of no unit root cannot be rejected at 1 percent, 5 percent and 10 percent affirming the conclusionJhat all the variables are non stationary at level. However, this hypothesis of unit root was rejected for the first difference for most of the variables (see Appendix 1).
Then the second 'step was for more meaningful results, therefore, the possibilities of long-run equilibrium relationships among the variables in the export demand equation using the Johansen procedure were investigated. The results concluded that there is at least one stochastic trend shared by the variables in the system in each equation. One significant co integrating vector was identified by the trace and A.-max for the following equations: export demand to India (IX,), export demand to China (IXc). In the case of export demand to ED (IXEU) and export demand to ROW (IXRow) equations the
unadjusted trace and A.-max tests point to the existence of two co-integrations. This confirms the economic theory that state that one economy should impact the others; it suggests any long-run equilibrating mechanism that would force them into co-integration (Engle and Granger, 1987) (see appendix 2).
Error Correction Model
Granger (1987), the ECM has three independent variables, which are the first differences of independent variables with appropriate lags), the-lag terms of the first difference of the dependent variables, and the residuals with a unit lag of the cointegrating relationships equations (1).
Applying the procedure following a "general-to-specific" method to arrive at a parsimonious model, several specifications of the general to model were tested. And the results from each model specification were tested for statistical significance of the estimated coefficients as well as for consistency of economically correct sign and the Indonesian palm oil market condition. After discarding the model specification that is neither statistically significant nor economically corrected sign, the results of the most parsimonious ECM are presented in Tables 2.
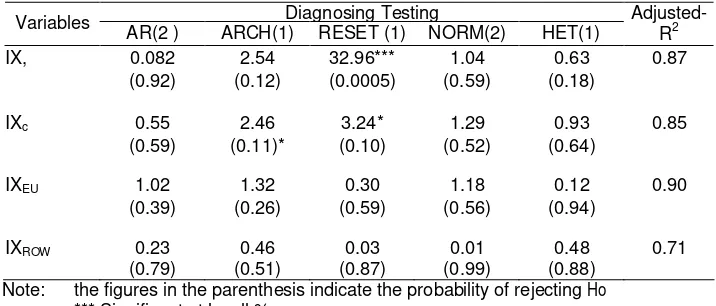
But before going to detail explanation of ECM results, Table 1 presents the diagnostic tests of the export demand equation. The ECM coefficients integrate the short-run dynamics in the long-run of the variables relationship. Given that the regressants are cast in the first difference, the empirical results indicate a satisfactory statistical fit as judged by the adjusted-R2s. For all the dependent variables, the statistic test for residual autocorrelation does not reject the null hypothesis of no autocorrelation in the residuals at 5 percent level. According to the J-B and ARCH tests, heteroscedasticity does not pose any problem for any of the relationships at 5 percent level. These test statistics do not reject the hypothesis that the estimated equations possess a normal distribution. Moreover, except for the export demand to India (IXI) that fails the
Chow (1960) test for structural stability, all the relationships are structurally stable.
Table 1. Diagnostic Testing for Error Correction Model
Diagnosing Testing
Variables AR(2 ) ARCH(1) RESET (1) NORM(2) HET(1) Adjusted-R2
IX, 0.082 2.54 32.96*** 1.04 0.63 0.87
(0.92) (0.12) (0.0005) (0.59) (0.18)
IXc 0.55 2.46 3.24* 1.29 0.93 0.85
(0.59) (0.11)* (0.10) (0.52) (0.64)
IXEU 1.02 1.32 0.30 1.18 0.12 0.90
(0.39) (0.26) (0.59) (0.56) (0.94)
IXROW 0.23 0.46 0.03 0.01 0.48 0.71
(0.79) (0.51) (0.87) (0.99) (0.88)
Note: the figures in the parenthesis indicate the probability of rejecting Ho *** Significant at levell %
The results of the error correction estimation on the export demand of the Indonesian palm oil are presented in Table 2.
Table 2. Summary of Estimates of the Equations in the Indonesian Palm Oil Industry Model
VARIABLES ESTIMATED EQUATION RESULTS
Export Demand to India (IXIt)
Export Demand to China (IXo)
Export Demand to Europe (IXElJt)
Export Demand to ROW (IXROWt)
--458.08 + 405.90**PSOr/WPOt + 5.83*IPI - 5.91
ERI + 0.97***IXIt_1 + 5.71 IClIX
8.61-2.02***WPOt + 1.66**PSOt +
0.39**IPC-18.07***ERC + 0.88***IXCt_1
-43.85 - 2.22**WPOt + 1.84*PROt + 103.89***D +
1.21 IPEUt + 23.13 EREUt + 0.89***IXEUt_1 + 0.13
ECIXElJ
-279.89 - ] 0.33***WPOt + 6.47**PSOt +
6.90**IPROWt + 0.73***IXROWt_1 - 0.7] ECMI
IXROWt + 0.19 ECM2 IXRowt
*** Significant at level 1% ** Significant at level 5% * Significant at level 10%
Indonesian Export Demand to India
As presented in Table 2, the error correction model estimates of the export demand equation for Indonesian palm oil to India and the export demand elasticity. They indicate that the following variables, ratio of soybean oil price and world palm oil price (PSOt/WPOt), industrial production index (IPI), and
lagged of export demand to India by one period, not only have the correct expected sign, but also are statistically significant. While the India's exchange rate (ERI) has correct theoretical sign but is not statistically significant. These results suggest that changes in the export demand of Indonesian palm oil to India are due to changes in the ratio of soybean oil price and world palm oil price (PSOt/WPOt), IPI, and lagged of export demand of Indonesian palm oil to India
by one year period.
decrease the quantity of palm oil demanded, hence suggesting that soybean oil is a substitute for palm oil in India.
The elasticity of the export demand to India with respect to the industrial production index of India is 2.69. This indicates that the variations in the index have a large effect on the export demand for Indonesian palm oil to India. An increase in the index by one percent would increase the export demand by 2.69 percent. This result is consistent with the finding by Lubis (1984) and Dradjat et al. (1995).
Export demand for Indonesian palm oil to India is also significantly dependent on lagged one period of palm oil export. The adjustment coefficient is 0.03 indicating that the adjustment to optimal level of palm oil export to India is relatively small at 3 percent per year. This adjustment coefficient is smaller than that found by Lubis (1994) which was 56 percent. This may be due to the technology development in the industry since 1994 (Lubis, 1994) .
With the computed F-value of 42.92 and R2 0.87, one would not reject of the null hypothesis at the 10 percent level, that the coefficients for long run variables presented by the ECEU1, are jointly equal to zero. This result suggests that as a group, the long run variable have not influenced the changes in the export demand to India which is indicated by the insignificance of the coefficient.
Indonesian Export Demand to China
Findings presented in Table 2, the coefficients for all the variables have signs consistent with the demand theory. The following findings can be drawn from palm oil export demand to China. First, in the short run, the world price, soybean oil price as a palm oil substitute in China, China's industrial production (IPC), China's exchange rate (ERC), and lag export demand to China (IXCt-1)
have all been proven to be significant adjusting factors for the short run disequilibrium of China's export demand for Indonesian palm oil. This reflects the significance of these variables as determinants of China's export demand for Indonesian palm oil.
Palm oil export demand to China is significantly influenced at one and five percent level by world palm oil price and soybean oil price respectively. The elasticity of export demand to China with respect to own price and soybean oil price is 1.49 and 1.4 7 respectively. An increase of oDe percent in own price will reduce the quantity export to China by about 1.49 percent. On the contrary, an increase of one percent in soybean price would increase the quantity export demand to China by approximately 1.47 percent. This finding implies that the quantity export demand to China is very sensitive to the changes of world palm oil price as well as the soybean oil price as a major substitute of palm oil. This finding confirms the finding by Susila et al. (1995) and Dradjat et al. (1995).
variables, the results indicate that the export demand to China should rise by 0.24 percent when the industrial production index rises by one percentage point and decrease by 0.59 percent when the exchange rate rises by one percentage point.
The adjustment coefficient which is reflected by one period of lag the export demand is 0.12, suggesting that adjustment to the desired level of palm oil export to China is rapid at about 12 percent per year.
An additional important result is the error correction term of China's export demand equation which was found to be highly significant, giving evidence of the existence of long term causal relationship between the variables of the equation. However, the magnitude of the error correction term elasticity is small (0.12) implying a slow speed of adjustment of the dependent variable and a small response to the error term.
Indonesian Export Demand to Europe
Overall, the results of regression model for export demand to Europe are quite reasonable. They indicate that the following variables WPOE, PROE, Dummy and IXEUt_1 not only have the priori signs, but also are statistically
significant. These results suggest that changes in the quantity export demand to Europe are due to changes in world price of palm oil, rapeseed oil price, dummy, and lagged of export demand to Europe by one period. Indeed, with a one percentage-point reduction in the world palm oil price, there should be a 0.42 percent decrease in the export demand to Europe. For the variable rapeseed oil price, the result indicates that export demand of Indonesian palm oil to Europe should rise by 0.43 percent when the world rapeseed oil price increas,e by one percent, while one percent increase in the lagged of export demand to Europe is expected to generate an increase of 11 percent. The inelastic nature of both own and substitute price in the export demand to Europe is consistent with the finding by Susila et al. (1995), even though it is different with the finding of India and China cases.
With the computed F-value of 21.55 and R2 of 0.96, one would not reject the null hypothesis of the 10 percent level that the coefficients for the long run variables which are captured by the ECIXEu are jointly equal to zero. This result
suggests that as a group, the long run variables have influenced the changes in the export demand to Europe, but this group is not statistically significant.
Indonesian Export Demand to Rest of the World
equation as shown by the small value of 15t order autocorrelation 0.05 while all the estimated coefficients have the expected signs.
Palm oil export demand to ROW is significantly influenced by own price and one period lag of palm oil export demand at one percent level and at five percent level for price of soybean oil and ROW industrial production index. These findings indicate that these variables are important in determining the performance of palm oil export to ROW. These results suggest that changes in the export demand are due to changes in the own price, soybean oil price, industrial production index, as well as, lagged one period of export demand. The significance of soybean oil price in influencing palm oil export demand to ROW confirms the belief that soybean oil is indeed a substitute for palm oil in the world oils and fats.
The elasticities of the export to ROW with respect to own price and soybean oil price, are at 2.23 and 1.69 respectively. These indicate that the variations in the prices have a substantial effect on the demand for palm oil in the Rest of the World. An increase in own price by one percent would reduce palm oil export to ROW by about 2.23 percent, meanwhile an increase in soybean oil price by one percent will increase export demand by 1.69 percent.
The elasticity with respect to the industrial production index of ROW is elastic at 1.42. This implies that the export demand to the countries in the Rest of the World is responsive to the index. An increase in the index by one percent would increase the export demand by about 1.42 percent. This result is consistent with the results on export to India and China which also showed that export demand to the ROW are responsive to changes in the industrial production index.
Export demand for palm oil to the ROW is also significantly determined by one period lag of palm oil export demand. The adjustment coefficient is 0.27, implying that adjustment to optimal level of the export demand to.ROW, is slow at about 27 percent per year.
With a computed F-value of 12.97 and R2 0.76, one would not reject the null hypothesis at the 10 percent level that both of the coefficients for the long run variables, ECMROW1 and ECMROW2, are jointly equal to zero, indicating the nonexistence of long term causal relationship between the variables of the equation. This does not provide additional support for finding long run relationship.
The Effects of Trade Liberalization
The reduction both in export duty and import tariff by 10 percent would increase domestic price by 12.22 percent. Furthermore, Table 3 shows the effects of 10 percent reduction in export duty and import tariff on export demanded. As shown, the reduction of export duty and import tariff would result in the increasing quantity exported. The positive effects of the reduction of export duty on quantities exported to India, China, Europe and rest of the world are substantial. The quantity exported to India increased 0.38 percent, while quantities exported to China and Europe increased by 3.77 and 0.67 percent respectively. The increase in quantity exported to the rest of the world due to export duty reduction by 10 percent is quite similar with the other countries. The export duty reduction increase quantity exported to the rest of the world by 4.63 percent, while the rest of the world excess demand also increased by 0.02 percent.
Meanwhile, the positive effects 10 percent reduction on import duty on quantities exported to India, China, Europe, and rest of the world shows that quantity exported to India increased by 0.25 percent while quantities exported to China and Europe increased by 2.67 and 0.49 percent respectively. The increase in quantity exported to the rest of the world due to import tariff reduction by 10 percent is 2.96 percent while the rest of the world excess demand increased by 0.002 percent.
And finally, the positive effects of both export duty and import tariff reduction by 10 percent shows that export to India increased by 0.64 percent while the quantities exported to China and Europe increased by 6.23 and 1.12 percent respectively. Furthermore, the increase in quantity exported to the rest of the world is quite similar with that for the other countries, quantity exported to the rest of the world increased by 7.35 percent.
Moreover, Table 3 also shows the effect of 50 and 100 percent reduction in export duty, import tariff and combination of export duty and import tariff on the export demand. It can be seen that the simulation results of the effect of those reduction by 50 and 100 percent are consistent and have similar patterns with the effect of reduction in export duty by 10 percent as presented earlier and the effect is higher along with the level ofreduction.
CONCLUSION AND POLICY IMPLICATIONS
Conclusion
Palm oil export demand to India is significantly influenced by the price ratio between soybean oil and palm oil, industrial production index, and lag of export to India. The export demand to India with respect to price ratio between soybean oil and palm oil is elastic at 2.74, IPI 2.69, and the adjustment coefficient is 0.89.
Palm oil export demand to China is significantly influenced by world palm oil price and soybean oil price respectively, with the elasticity being 1.49 and 1.47 respectively. It is also significantly influenced by the Chinese industrial production index and Chinese exchange rate with the elasticity 0.24 and -0.59 respectively. And the adjustment coefficient which is reflected by one period of the export demand is 1.39.
Export demand to Europe is significantly influenced by the world price, rapeseed oil price, dummy variable and lagged export. The own price elasticity is 0.42 and the elasticity of substitute oil is 0.43. The adjustment coefficient is 0.83. The world palm oil price, soybean oil price, ROW industrial production index and lagged export demand significantly influenced the export demand to ROW. The own price and substitute price elasticity was -2.23 and 1.69 respectively. The elasticity of export demand to ROW with respect to industrial production index is 1.42 and the adjustment coefficient is 0.68.
Furthermore, based on the simulations result of the impacts of the reduction in export duty and import tariff, it can be seen that the effects of the policy variations are substantial on the export demanded. Due to the reduction in export duty, the quantity exported to India, China, Europe, and ROW increased by 0.38, 3.77, 0.67 and 4.63 percent respectively.
Reduction on import duty on quantities exported to India, China, Europe, and rest of the world increased by 0.25, 2.67, 0.49, and 2.96 percent respectively. And export duty and import tariff reduction by 10 percent increased export to India, China, Europe, and ROW by 0.64,6.23, 1.12, and 7.35 percent, respectively.
Policy implications
The significance of the industrial production index as a major determinant of export demand has the implication of being an important monitor of the growth of the industry in the major importing counties. The aim of such monitoring is to enable the Indonesian palm oil industry to capture higher demands in these countries as a result of industrial development.
REFERENCES
Angelo, A. and Zapata, H. 2000. Further Empirical Evidence of Wheat and Barley Market Integration in the EU. Department of Agricultural Economics. Lousiana State University.
Basiron, Y. 2001. Global Oils and Fats Business: Challenges in the New Millenium. Oil Palm Industry Economic Journal vol. 1 Number 1/2001 pp. 1-10. Malaysian Palm Oil Board. Malaysia.
Dickey, D. A. and Fuller, W.A. 1991. "Distribution of the Estimators for Autoregressive Time Series With a Unit Root", Journal of the American Statistical Association, 74, pp. 427-431.
Dradjat, B. 1995. Upaya Pengembangan Produck Agroindustri Perkebunan (Komoditi Kelapa Sawit). Pusat Penelitian Sosial Ekonomi Pertanian. Badan Penelitian dan Pengembangan Pertanian. Departemen Pertanian. Bogor.
Engle, R and Granger, C. 1987. "Co-integration and Error Correction Representation, Testing and Telling" Econometrica 55(2),: 251-276.
Ibrahim, A. 1999. The International Trade in Palm Oil :.:PIospects and Challenges. Proceedings of the 1999 PORIM International Palm Oil Congress. Economics Marketing Conference. Palm Oil Research Institute of Malaysia.
Indonesian Palm Oil Commission Board. 2005. Role of Palm Oil Industry in Indonesian Economy. Power Point presentation.
Larson, D. F. 1996. Indonesia's Palm Oil Subsector. Policy Research orking Paper 1654. The World Bank International Economics Department Commodity Policy and Analysis Unit, September 1996.
Lubis, A. 1994. A Market model for Malaysia Palm Oil Industry. PhD Thesis. Faculty of Economics and Management, University Putra Malaysia, Serdang, Selangor; Malaysia.
McKay, A. 1998. Aggregate Export and Food Crop Supply Response in Tanzania. DFID-TERP: Credit Discussion Paper 4 (CDP04). University of Nottingham.
Mushtaq, K. and Dawson. 2000. Acreage Response in Pakistan: A Cointegration Approach. Department of Agricultural Economics. University of Agriculture. Faisalabad. Pakistan. Oil World Annual, 1990-2005.
Shamsudin, M.N., Fatimah, M.A., Zainalabididn, M. and Lubis, A.R. 1994. A Market Model for Malaysia Palm Oil Industry. The Malaysian Journal of Agricultural Economics 11 (19.94) : pp 81-102.
Shamsudin, M.N., et al. 1997. The Effect of Export Duty Liberalization on the Malaysian Palm Oil Industry. Faculty of Economics and Management, University Putra Malaysia, Serdang, Selangor, Malaysia.
Simatupang and Purwoto. 1995. Konsumsi Minyak Goreng untuk Pangan. IPB Press. Indonesia.
Sumaryanto and Rantenata, M. 1996. Sistem Agribisnis dan Peranan Minyak Goreng dalam Perekonomian Nasional. IPB Press. Bogor.
Suryana, A. 1986. Trade Prospects of Indonesian Palm Oil in the International Markets for Fats and Oils. A thesis submitted to the Graduate School of North California State University. America.
Susila, W.R. 1995. Model Ekonomi Minyak Sawit Mentah. Pusat Penelitian Sosial Ekonomi Pertanian. Badan Penelitian dan Pengembangan Pertanian. Departemen Pertanian. Bogor.
Thompson, S. 2000. Spatial Equilibrium Market Efficiency and Policy Regime Change: Seemingly Unrelated Error Correction Model Estimation. The Ohio State University.
Tondok, A.R. 1998. Production and Marketing of the Indonesian Palm Oil: Past, Present, and the Future. International Oil Palm Conference, September 23-25. 1998. Nusa Dua, Bali-Indonesia.
Appendix 1. The Unit Root Test for Non-Stationarity
Augmented - Dicky Fuller Phillip-Peron Variables
Level 1
51
Difference
2nd
Difference Level
151 Difference
2nd Difference
WPOt -3.00769 -8.25*** -3.2503 -5.591 ***
ROWQPT -3.37177 -4.94*** -1.486 -9.4951 ***
WQXT -3.47218 -6.95*** -2.2693 -7.8282***
INDXt -2.10555 -6.40*** -3.3731 -9.6158***
IXlt -2.27735 - -6.07*** -2.764 -4.7105***
IXet -1.13285 -6.89*** -2.8853 -6.8792***
IXEut -3.82285 -5.68*** -5.3504
13.4159*** IXROWt -1.60284 - -7.46465* -2.3903 -7.7893***
PSOt -3.66133 -7.77*** -3.0816 -5.4354***
PGOt -3.02558 -6.22*** -2.8603 -5.5737***
PROt -3.4126 -7.94*** -3.2006 -5.5034***
IPI -2.10175 - -6.79*** -2.5088 -6.9437***
IPe -1.82418 -4.58*** -1.5177 -7.2542***
IPEU -3.61253 - -6.42*** -2.3622 -3.8737**
IPROW -3.51292 - -5.48*** -2.2511 -4.2985***
ER, -1.8341 -11.03*** -1.204 -3.668***
ERe -0.1431 -5.46*** -0. 143 -5.46***
EREU -3.3123 -9.83*** -2.238 -10.50***
ERROW -1.2221 -3.77*** -0.810 -3.48**
Critical Value
1% -4.6193 -4.3226 -4.2929 -4.2713 -4.2826
5% -3.7119 -3.5796 -3.2109 -3.5614
10% -3.2964 -3.2239 -3.5562 -3.2138
Appendix 2. Testing for Cointegration Using the Johansen and Juselius Method
Tests
Ho HI
Export Demand to
India IXIt
k= 1 r= 1
Export Demand to
China IXCt
k=2 r= 1
Export Demand
Europe IXEUt
k= 1 r=2 to
Export Demand to ROW
IXROWt
k= 1 r=2
-max
r 1 r = 1 49.51 ** 34.89** 53.17*** 115.41***
r ≤ 1 r = 2 23.82 20.49 33.79* 44.58*
r ≤ 2 r =3 17.74 15.26 21. 73 26.16
r ≤ 3 r = 4 13.81 11.09 16.44 10.16
Trace
r 1 r ≥ 1 56.21*** 81.88** 132.57*** 42.97***
r ≤ 1 r≥ 2 32.39 46.99 45.61* 27.86
r ≤ 2 r ≥3 14.64 26.51 23.88 18.41
r ≤ 3 r ≥ 4 4.23 11.25 16.44 10.16
AR(2) 4.23 1.27 8.85 2.59
ARCH(2) 6.80* 6.03 1.96 2.04
RESET(1) 4.33 1.94 3.04 0.46
Norm(2) 7.58* 5.19 0.31 1.25
Table 3. Historical Simulation on the Major Variable on Indonesia's Palm Oil Industry Before and After Trade Liberalization-Reduction of Export Duty
Table 3. continued
Reduction of
Export Duty Reduction of Import Tariff
10% 50% 100% 10% 50% 100%
Variables Based Scenario
'000
Tones %
'000
tones %
'000
Tones %
'000
Tones %
'000
tones %
'000
tones %
IXj 202.96 237.57 0.4 476.44 12.9 648.91 19.5 211.46 0.3 240.07 1.2 263.09 2.1
IXc 25.36 48.23 3.8 139.6 18.8 253.82 37.7 34.21 2.7 60.66 10.7 78.3 16.0
IXEu 362.95 388:.03 0.7 488.23 3.4 613.48 6.7 372.65 0.5 401.67 2.0 421.01 3.0
IXRow 27.57 114.45 4.6 595 23.2 504.28 46.3 114.45 3.0 106.54 11.8 216.96 17.8
Reduction of Export Duty
10% 50% 100%
Variables ScenarioBased '000
tones %
'000
tones %
'000
tones %